
Impacts of Covid-19’s Health Crisis on the National Electricity Grid:
The Contribution of Renewable Energies in the Defense Plan
Saida Karmich and El Mostafa Ziani
Laboratory of Electrical Engineering and Maintenance– LEEM,
Mohammed 1st University, High School of Technology, Oujda, Morocco
Keywords: Covid 19 health crisis, electricity sector, declining demand, renewable energy, energy security and flexibility.
Abstract: Today the corona virus crisis reminds us of the vital role of electricity in our lives. It also gives an overview
of our future and how can change. The current society relies on new technologies to survive; hence, the
consumption of energy is more and more increasingly done in the form of electricity from wind and solar
sources for some European countries and for Morocco also. The health crisis linked to the COVID-19 virus
has a strong influence on electrical systems. In particular, electricity consumption dropped dramatically as
soon as the containment measures were adopted. However, the evolution of electricity consumption is
considered a good indicator of economic activity. Beyond this, the functioning of the electrical system and
the continuity of electricity supply during this period of health emergency remains the concern of each
network operator, the role of renewable energies becomes important to guarantee the supply of electricity
during this crisis. In such a society, electrical security is essential to the thing that requires more stable and
more flexible resources.
1 INTRODUCTION
The corona virus is transforming into an
unprecedented international crisis, with serious
repercussions on people's health and economic
activity (Baldwin, 2020). The impacts of the corona
virus pandemic on the electricity sector are harmful
and measurable (FEIL, 2020), we can distinguish
between two categories, short-term effects and other
medium and long term. However, we can already
identify some fairly intuitive tracks. The global
impact of corona virus and the resulting turmoil in
global markets dominate global attention.
The first section describes the need for access to
electricity especially in the crisis caused by the
coronavirus. The second part treats the description of
the short term impacts. In the third part we describe
the medium and long term impacts; finally, we
identify the wind and solar potential in Morocco, how
this form of energy can fill the gap and provide clean
energy at lower cost.
2 THE GLOBAL CORONA VIRUS
CRISIS HAS SHOWN US THE
NEED FOR ACCESS TO
ELECTRICITY
The health crisis we are experiencing today has
shown us the importance of electricity. we are
confined, teleworking remotely, using shopping sites
for our purchases and websites for entertainment and
finally television to be able to follow the courses
programmed by the Ministry of education, for this a
reliable power supply is necessary. The need for a
reliable source for hospitals at this time of crisis
where many sick people are refugees, thus the
reliability of the flow of information between all
members of society and the communication between
doctors and patients is guaranteed thanks to electricity
(Graff, 2020).
3 SHORT-TERM IMPACT OF
CORONOVIRUS CRISIS
3.1 Continuity of Public Service
Electricity is a basic necessity in our life so ensuring
the quality and continuity of the electricity supply is
one of the essential tasks of the network operator.
There is no fear on that side because the grid operator
has plans which guarantee that the controllable plants
will continue to operate, and that the transport
networks will be in good working order. As
distributors have set up, a system aimed at ensuring
the continuity of services and limiting customers trips
to the agencies of these distributors to the strict
minimum. Priority is given to operational agents,
those responsible for operating the power plants and
maintaining the HTB and HTA lines. Thus, and
throughout the period of the state of health emergency,
the Distributors decided to postpone some activities at
home, in particular, the counting, the distribution of
consumption invoices and home collection. However,
the Distributors announce that the interventions
planned for network maintenance, during this period,
will be limited to absolutely essential and urgent
maintenance works. Permanent intervention teams
will ensure the continuity of electricity supply in the
best conditions of quality of service. Support agents
can continue their telework activity.
3.2 Electricity Demand
Electricity demand fell 10% between March 9 and
March 16 in France, mainly due to the drop in
economic activity. The transmission system operator
announced a trend of - 15% on March 18. It is the
slowdown and in some cases, the shutdown of
industry, shops and transport (TGV, metro, tram) that
explain this decline and things should even get worse.
The increasing use of digital technology due to tele-
work and confinement (digital technology accounts
for around 12% of electricity consumption in France
and consumption in this sector would have increased
by 40 to 50% in the context of the epidemic) should
not offset the drop in demand for electricity in other
sectors. The same scenario is probably expected for
the North African countries like Morocco since their
economy is focused on industry, trade and tourism,
they could experience significant losses in 2020. So
far, the main sectors affected are tourism, automotive
and textiles (High Commission for Planning, 2020).
Since the transport and transit of goods is operating
normally, the impact of Covid19 on trade seems to
have been curbed for the moment. The Four major
sectors: industry, transport, services and households
represent 80% of the demand for electrical energy.
The energy demand of each of these sectors will be
impacted (
Delegation of the European Union to Morocco,
2020) and it’s determined by one or more
socioeconomic and technological parameters, the
values of which are given as part of the scenarios.
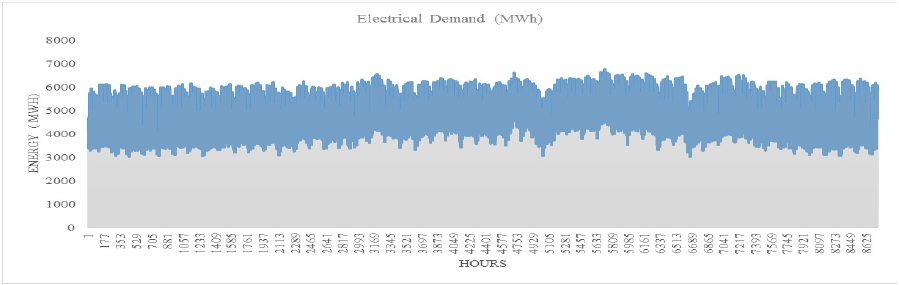
Take the example of a scenario where the forecast of
electricity demand in 2020 has a trend of 41.72 TWh
with a Peak of 6747 MW. The variation of electricity
demand is schematized by the following Figure 1
bellow.
Figure 1: Forcast Electrical Demand of 2020
The variation in demand is between 6747 MW as the
maximum value and 3032MW as the minimum value,
the average value is 4750MW, this forecast is
calculated on the basis of the achievements of the last
ten years using the method of evolution of GDP and
population. There are several methods for forecasting
demand among them is cited in (Ziani, 2018).
The projection model that will be used is based on the
evolution of GDP and POP according to the formula
(1)
GDPPOP
(1)
E: Energy
GDP: Gross Domestic Product
POP: Population
The steps followed are:
The evolution of GDP and POP
Distribution by sector (%)
Energy production of each sector (industrial
sector….)
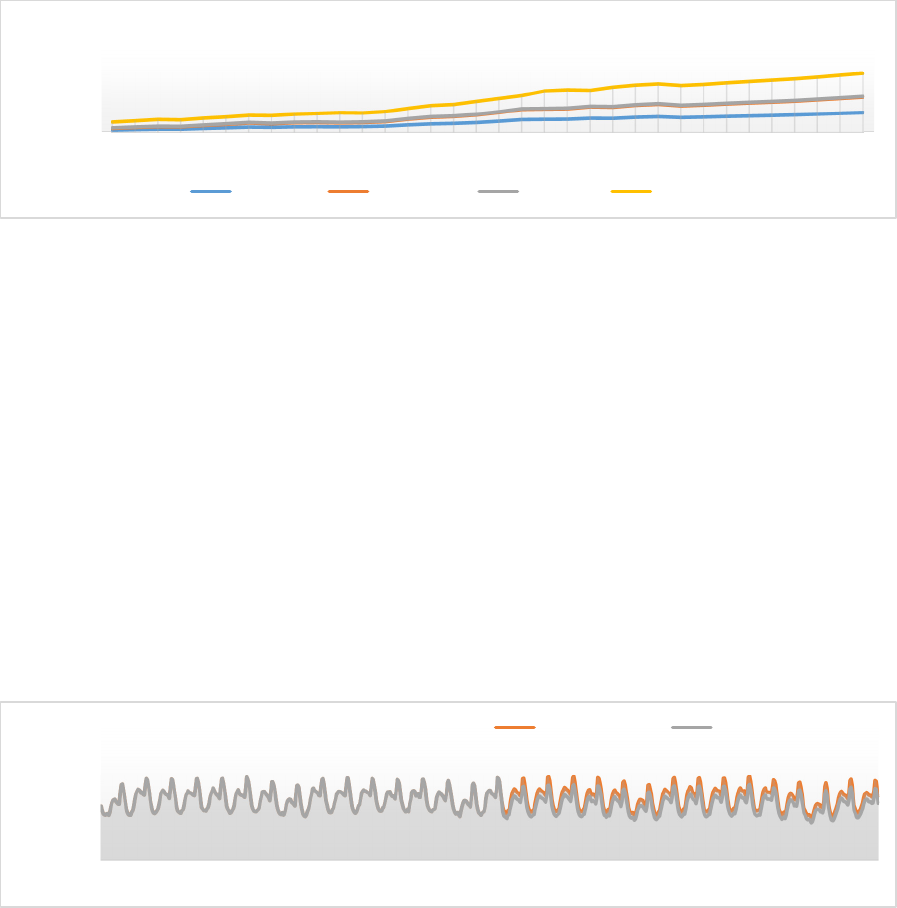
The basis for calculating changes in GDP by sector is
the history of consumption by sector. According to
(High Commission for Planning, 2020), energy
consumption is divided into four main sectors, and the
share of each sector evolves as follows Figure 2
Figure 2: Historic of energy consumption by sector
GDP (Gross Domestic Product) is expected to decline
by 1.8 % in the second quarter of 2020. This
contraction is mainly due to a drop of almost half the
growth rate of the added value of the tertiary sector,
following an almost total halt in the catering and
accommodation activities, of a reduction of 60%
activity in transport and 22% in trade, compared to
our reference scenario. The slowdown in services
would be combined with a 0.5% contraction in the
added value of the secondary sector. Manufacturing
industries would be the most affected by the decline
in foreign demand for Morocco, with the drop in
production in the automotive, textile and electrical
industries. At the same time, mining activities are
expected to experience reduced demand from the
chemical industries, in the wake of the sharp decline
in phosphoric acid exports. As for agricultural
activities, their decline would be limited to 2.9%, on
an annual basis, thanks in particular to the improved
growth prospects for spring crops, favored by the
almost general return of precipitation at the end of
March and the stabilization of prices. The effects of
this climatic impulse should however diminish, in the
face of an extension of the restrictions on the
movement of seasonal workers and the maintenance
of the strict control measures imposed by European
countries beyond April 2020, particularly for
production perishable like fruits and vegetables. The
effects of containment during the month of April
2020 should reduce GDP growth by 3.8 points in the
second quarter of 2020 compared to the first scenario,
equivalent to a loss of around 10.9 billion dirham,
instead of 4.1 billion dirham a quarter earlier.
Services should contribute the most (-2.49 points),
followed by manufacturing industries (-0.39 points).
Figure 3: Electrical Demand of March 2020 with the impact of the health crisis of coronavirus
0,00
20,00
40,00
60,00
1987
1988
1989
1990
1991
1992
1993
1994
1995
1996
1997
1998
1999
2000
2001
2002
2003
2004
2005
2006
2007
2008
2009
2010
2011
2012
2013
2014
2015
2016
2017
2018
2019
2020
ENERGY TWH
YEARS
Evolution of energy consumption by sector (TWh)
residentiel Commercial Transport Industry
0
5000
10000
1
16
31
46
61
76
91
106
121
136
151
166
181
196
211
226
241
256
271
286
301
316
331
346
361
376
391
406
421
436
451
466
481
496
511
526
541
556
571
586
601
616
631
646
661
676
691
706
721
736
Energy MWh
Hours
Electrical Demand (MWh)
Normal Evolution Evolution After coronavirus
It should be noted that these forecasts remain subject
to more or less significant revisions as new data are
published, in a context marked by great uncertainties
as to the duration of the health crisis, with harmful
effects on the economic activity of the various
containment and travel restriction measures, but also
with regard to the magnitude of the impact of
spending programs and plans to support the national
economy (High Commission for Planning, 2020). By
an application of this reduction the charge curve for
the month of March of the year 2020 will have the
form as follows, Figure 3. The load curve for 2020
will be of the following form, let’s assumes the
impact of the corona virus crisis on industrial activity
will end in June, Figure 4 bellow.
If we zoom on the three months March, April, May
and June we can clearly see the decrease in demand
Figure 5 bellow.
Figure 4: Forecast Electrical Demand of March-April-May-June after the impact of the health crisis of coronavirus
Figure 5: Forecast Electrical Demand of March-April-May-June after the impact of the health crisis of coronavirus
4 MEDIUM AND LONG TERM
IMPACTS
4.1 The Production Plan and the
Adequacy Supply-demand
With a trend in lower demand for electricity, the
problem of electricity generation capacity will not be
imposed. Balancing supply and demand in real time
is one of the most difficult equations for network
operators to solve; incidents occur when demand
exceeds supply. But the most dangerous incidents
have taken place during periods of low demand.
4.2 Electricity Supply Security,
Flexibility and Renewable Energies
In most of the countries that have taken strong
containment measures in response to the corona virus,
the demand for electricity has dropped significantly
(15%) and this is due to the decline in economic
activities. we can cite as examples Spain and Italy,
where its production consists primarily of wind and
solar. with the confinement conditions that we are
experiencing today or the demand for electricity
decreasing rapidly while the weather conditions
remain the same, the share of renewable energies is
increasing. the recent drop in demand for electricity
has given the opportunity to advance power systems
by boosting them to levels of wind and solar power
0
2000
4000
6000
8000
1
201
401
601
801
1001
1201
1401
1601
1801
2001
2201
2401
2601
2801
3001
3201
3401
3601
3801
4001
4201
4401
4601
4801
5001
5201
5401
5601
5801
6001
6201
6401
6601
6801
7001
7201
7401
7601
7801
8001
8201
8401
8601
ENERGY MWH
HOURS
Electrical Demand (MWh)
Electrical Demand (normal evolution) Electrical Demand after Corona virus
0
1000
2000
3000
4000
5000
6000
7000
1
52
103
154
205
256
307
358
409
460
511
562
613
664
715
766
817
868
919
970
1021
1072
1123
1174
1225
1276
1327
1378
1429
1480
1531
1582
1633
1684
1735
1786
1837
1888
1939
1990
2041
2092
2143
2194
2245
2296
2347
2398
2449
2500
2551
2602
2653
2704
2755
2806
2857
2908
ENERGY MWH
HOURS
Electrical Demand (MWh)
Electrical Demand (normal evolution) Electrical Demand After coronavirus
that they would not have had without another decade
of investment in renewables (Das ,2020). the health
crisis has enabled us to understand electricity
systems, including some of the operational challenges
that grid operators face in ensuring the security of
electricity.When wind and solar electricity meet most
of the demand, systems must maintain their flexibility
so that they can quickly increase other sources of
production when the supply model changes, such as
when the sun goes down. A very high share of wind
and solar energy at any given time also makes it more
difficult to maintain grid stability.This problem
doesn’t apply to the countries of North Africa like
Morocco since their production plan is not 100%
based on renewables energies at this stage and
since production based on conventional power plants
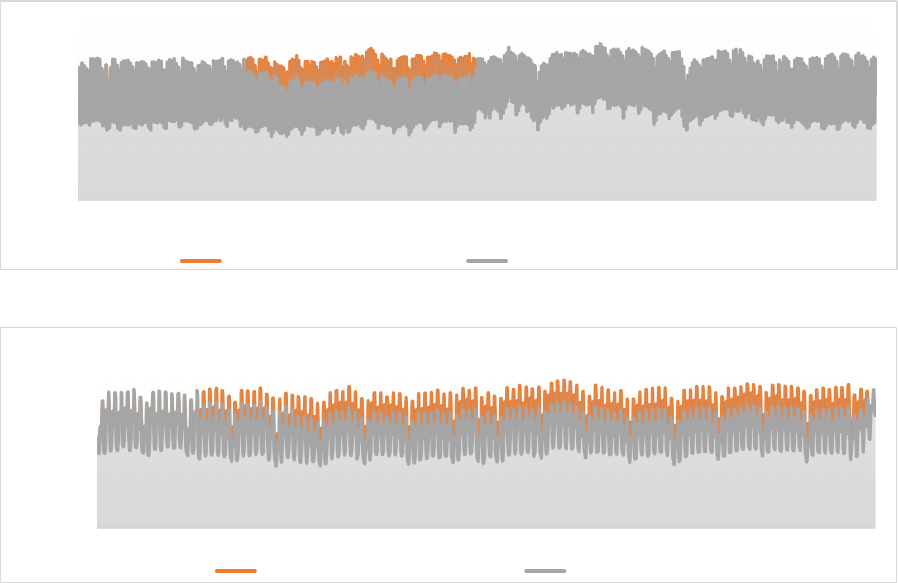
reaches 70% total need for country. Taking the
example of Morocco, with a forcast demand is 41.72
TWh and a production plan as follows, Figure 6. it is
clear that this production plan contains very flexible
means to meet the demand for electricity, the problem
of security and stability of the electrical system will
not be imposed, Figure 7.
Figure 6: Production Plan of 2020
Figure 7: Forecast distribution of demand and production normal year 2020
Wind and solar can keep the power grid
flexibility, and systems increasingly rely on them.
Demand decreases at night hence the reduction in
wind power, unlike solar power can be reduced at
midday when there is more energy demand.
Following technological development, the production
of electricity from renewable energies will not be
limited to climatic conditions but will have to be
intelligently managed according to more reliable
forecasting methods in order to reduce costs and
improve electrical safety.
The drop in electricity consumption leads to a
drop in the production of the most expensive sectors,
namely that of thermal power plants (gas and coal)
over some particularly slack periods. This
mechanically leads to an increase in the share of
renewable energies in the electricity mix. the rate of
integration of renewable energies increases
mechanically because the functioning of the
electricity markets leads to operating as a priority the
means of production at zero or very low variable cost
such as wind, solar or hydraulics. Consequently, the
instantaneous share of production cover by renewable
energies can reach higher levels depending on the
installed capacity, which is around 2528MW in 2020.
Morocco is accelerating its evolution towards energy
mixes with a strong component of renewable energies
(the target set is 52% by 2030, including 4560 MW
solar, 4200 MW wind, and 3100 MW hydroelectric),
which will not fail to encourage the energy
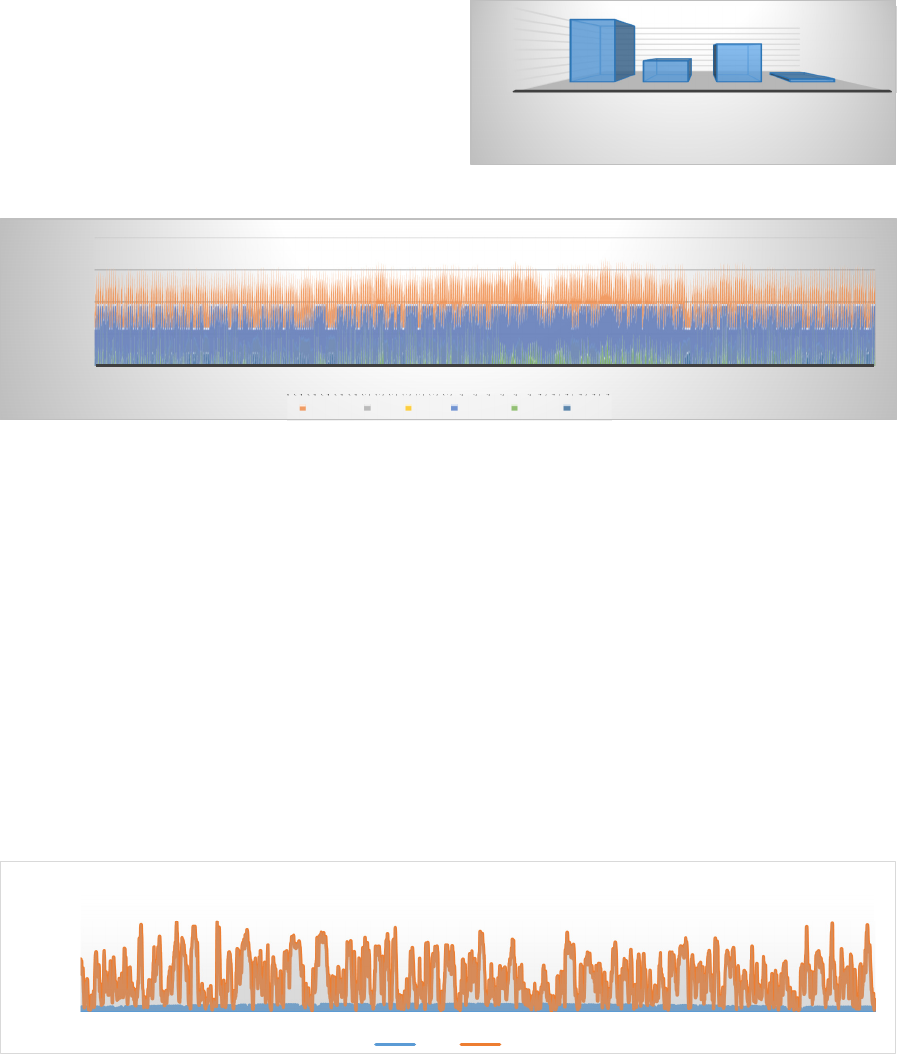
independence of the country (Azeroual, 2018). The
distribution of the solar and wind potential over the
year according to the climatic conditions is as follows
[1h; 8760h] Figure 8 bellows.
Figure 8: Distribution of Wind Potential in 2020
0
500
1000
1500
2000
2500
3000
3500
4000
THERMAL
(MAXIMUM
POWER
SUPPLIED)
HYDRAULIC WIND CSP
47%
16% 29%
2%
PowerMW
powerplant
0
2000
4000
6000
8000
1
153
305
457
609
761
913
1065
1217
1369
1521
1673
1825
1977
2129
2281
2433
2585
2737
2889
3041
3193
3345
3497
3649
3801
3953
4105
4257
4409
4561
4713
4865
5017
5169
5321
5473
5625
5777
5929
6081
6233
6385
6537
6689
6841
6993
7145
7297
7449
7601
7753
7905
8057
8209
8361
8513
8665
Energy MWh
Hours
Energy delivered and demand in MWh
Demand CSP Wind Thermal Import Export
0
1000
2000
3000
1
150
299
448
597
746
895
1044
1193
1342
1491
1640
1789
1938
2087
2236
2385
2534
2683
2832
2981
3130
3279
3428
3577
3726
3875
4024
4173
4322
4471
4620
4769
4918
5067
5216
5365
5514
5663
5812
5961
6110
6259
6408
6557
6706
6855
7004
7153
7302
7451
7600
7749
7898
8047
8196
8345
8494
8643
ENERGY PRODUCED
HOURS
Distribution of wind and solar potential in 2020
CSP Wind

5 CONCLUSION
The millions of people in Africa live without access
to electricity which makes their lives more difficult,
vulnerable to risks like disease. The health crisis
reminds us of the importance of electricity in our
lives. It also gives a insight into its evolution in the
future. Today, we live in a society that relies even
more on digital technology for everyday life, where
energy consumption takes up a large place and
depends on renewable sources such as wind and solar.
In such a society, electrical security is the foundation
of prosperity and stability, but this can only be
guaranteed with the great efforts of governments.
Despite the massive use of digital technologies in
electrical systems, the corona virus crisis has also
reminded us of the role of skills and qualified
personnel. Maintaining and repairing the network
requires a lot of manpower and experience.
Organizations must ensure that staff members stay
safe while they are performing their critical work. A
key lesson from the current crisis is to ensure that
electrical systems have sufficient resources not only
in physical assets but also in human capital.
The curves shown in this article are the results of
the analyzes of the evolution of the load during the
pandemic period, the methods used are well defined
in the article, such as linear regression using GDP and
POP.
The insufficiency of electricity can be solved by
using other techniques of electricity production such
as solar and wind sources, the production of energy in
Morocco doesn’t depend only on conventional
energies, however the mix energy is very rich by
renewable energies (solar and wind) and this is the
case for Brazil and other countries during the
pandemic period.
The impact of the reduction in mobility due to the
situation of confinement on the Moroccan energy bill
has been clearly noticed, we have seen a drop in
consumption for industrial and tertiary activity unlike
the consumption of houses which has been changed
from 'significantly. Taking the example of a feeder
supplying a household zone, the normal load is
4.5MVA, during confinement the load has been
changed to 5.8MVA. Unlike a feeder which supplies
an industrial zone, the normal load is 6.5MVA has
been lowered to 4.2MVA. Today Morocco invests in
energy storage means such as pumped storage power
plants, Thanks to their storage function, these
installations help to maintain the balance between
production and consumption on the electricity
network, while limiting production costs during
peaks in consumption. Today, the transfer of energy
by hydraulic pumping is the most mature technique
of stationary energy storage. Existing plant: Afourer
464MW; Future power plant: 1150MW.
REFERENCES
Baldwin, R., Tomiura, E., “Thinking abead about the trade
impact of Covid-19”, Economics in the Time of Covid-
19,2020 pp 59-71.
FEIL, A., "COVID-19 and the Brazilian electricity sector:
what is the impact of COVID-19 on the Brazilian
electricity sector and where do we go from here?."
(2020).
Graff, M., Carely, S., “Covid-19 aasistance needs to target
energy insecurity” Nature Energy (2020). HCP
Conjoncture in the first quarter of 2020 and outlook for
the second quarter. Delegation of the European Union
to Morocco – Commercial section; Note on the
economic impacts of Covid-19 in Morocco to
03/26/2020.
Karmich, S., Ziani, El., Assessment Of Renewable
Energies Potential In The Eastern Region Of Morocco
Using Forecasting Tools. The 6th International
Conference on Optimization and Applications .IEEE
2018.
Das, K., “impact of covid 19 pandemic into solar energy
generation sector”. SSRN 3580341, 2020 –
papers.ssrn.com.Azeroual.
M., El makrini, A., El Moussaoui, H., El markhi, H.,
Renewable Energy Potential and Available Capacity
for Wind and Solar Power in Morocco Towards 2030,
Journal of Engineering Science and Technology
Review 11 (1) (2018) 189 – 198 published on 20
February 2018.
