
Statistical Downscaling and Inflows Projections of an Arid Watershed
Study Case: Hassan Addakhil Dam the Way Forward
Ismail Elhassnaoui
1a
, Wafae El Harraki
1b
, Ahmed Bouziane
1c
, Driss Ouazar
1d
and Moulay Driss Hasnaoui
2 e
1
Mohammadia School of Engineers, Mohammed V University in Rabat, Morocco
2
Ministry of Equipment, Transport, Logistics and Water, Rabat, Morocco
Keywords: Climate change, HEC-HMS, RCP, Spatial Downscaling.
Abstract: This study aims to assess future inflows of Hassan Addakhil dam in front of hydroclimatic variation under
climate change. The Coupled Model Intercomparison Project Phase 5 (CMIP5) precipitation data was
downscaled for Foum Tilicht and Foum Zaabel rain gauge stations at a daily time-scale, using SDSM software
considering the baseline period 1983-2012. Future precipitation projections over the period 2013-2100, were
generated for three Representative Concentration Pathway, namely RCP 2.6, RCP4.5 and RCP8.5. Besides,
the future hydrologic projection was conducted through HEC-HMS. The results show that the sum of
precipitations would increase for Foum Zaabel compared to the reference period by 14% for RCP2.6, 11%
for 4.5%, and 14% for RCP8.5 in the 2050s. For the 2080s these changes would move to 11%, 14%, and 15%
for RCP2.6, RCP4.5, and RCP 8.5 respectively. Concerning Foum Tilicht, this increase is estimated at 22%,
19%, and 20% for RCP 2.6 and RCP4.5 and RCP8.5 in the 2050s, whereas in the 2080s it's around 21% for
and 22%. The Future projection of the Hassan Addakhil dam inflow, under RCP 2.6, RCP 4.5 and RCP 8.5,
shows that the maximum and the minimum inflow is likely to occur during October and July respectively.
1 INTRODUCTION
The anthropogenic factor increased significantly the
greenhouse emissions, which, unfortunately,
accentuated global warming (IPCC, 2014). Climate
change has led to the heterogeneity of the spatial and
temporal distribution of precipitation, shifting of
rainfall trend, snowmelt conditions change and
increasing of extreme event frequency (Trenberth,
2011). Indeed, the hydro-climatic condition tends to
change in the sense that some areas will experience
increasing precipitation while other areas will
experience an opposite trend (IPCC, 2014; Kaito et
al., 2000).
Therefore, Climate change is considered as the
principal trigger for precipitation heterogeneity in
terms of variation of its magnitude, frequency, and
intensity; which can lead to a socio-economic and
a
https://orcid.org/0000-0003-1979-566X
b
https://orcid.org/0000-0002-4047-3465
c
https://orcid.org/0000-0003-4311-7439
d
https://orcid.org/0000-0002-2472-3532
e
https://orcid.org/0000-0002-6585-6112
environmental crisis (Dong, 2020; Sillmann et al.,
2013; Sisco et al., 2017).
Along with climate change, water demands
(irrigation, public supply, industry…) are
continuously increasing, which would put more
pressure on water resources (Karmaoui et al., 2020).
Consequently, the increase in water demand and the
spatiotemporal heterogeneity in hydro-climatic
conditions will certainly affect dams performance
(Okkan & Kirdemir, 2018). Dam is a hydraulic
structure often used to meet multiple purposes
comprising: drinking water, irrigation, hydropower,
flood mitigation and environmental streamflow
requirements (L. Zhang, 2000). Indeed, more than
47000 dams are constructed worldwide (Shah &
Kumar, 2008). Due to the spatiotemporal variability
of precipitation, and the increasing demands and the
severity of the extreme events, dam policy becomes a
tool for guaranteeing water security as a concept

combining water availability, water accessibility,
water safety and quality, and water management
(Gain, 2016). Morocco is one of the countries highly
concerned by water security problems. To avoid
water shortages, Morocco has adopted a dam policy
since 1960’s and has implemented more than 140
dams to meet drinking water demand and enhance
agriculture investments. However, climate change
and extreme events affect directly sustainable
management of these reservoirs. Several studies over
the world have assessed the behaviour of dams under
climate change. Ehsani et al., 2017 used neural
network algorithm to assess the dam's behaviour
under climate change and to optimize releases to meet
downstream demands. Yang et al., 2019 investigated
the impact of dam’s construction under climate
change on hydroecological behaviour and natural
hazard risk. The results showed that the construction
of the dam helps to overcome drought conditions and
mitigate flood risks. Yang et al., 2019 assessed
streamflow variation due to climate change and dams
construction using the Global Environmental Flow
Calculator while the dam’s management was
conducted through HEC-ResSim. The results showed
that the multi-functional dams can enhance the
performance of streamflow regularization. Okkan &
Kirdemir, 2018 investigated the evolution of the
projected crop water demands, hydro-meteorological
changes, and dam performance under climate change.
Z. Zhang et al., 2015 assessed the streamflow
variability response to climate change in a coastal
Chinese watershed, using the ecohydrological
analysis and environmental flow factor. The results
showed that a cascade dam’s development can
mitigate the effect of climate change on hydrologic
behaviour. Raje & Mujumdar, 2010 evaluated the
performance of a significant reservoir in India under
climate scenarios by employing alternative operating
policy. Raje & Mujumdar, 2010 investigated the
response of multipurpose reservoirs to climate
change.
In terms of climate change assessment, Global
climate models (GCM) and the Regional climate
models (RCM) are the primary sources for studying
historical trends for precipitation and predict likely
future rainfall (Chokkavarapu & Ravibabu, 2019). A
set of available GCMs for climate change projection,
namely the Coupled Model Intercomparison Project
Phase 5 (CMIP5), basically used for the fifth IPCC
Assessment Report (Lutz et al., 2016), was presented
by (Chokkavarapu & Ravibabu, 2019). Furthermore,
to explore the future climate change variation and its
impact, four representative concentration pathways
have been set: RCP2.6 as a mitigation scenario
(Vuuren et al., 2011), RCP4.5/RCP6 as medium
stabilization scenarios and RCP8.5 as a pessimistic
scenario. These scenarios were performed for the
CMIP5 to predict future global change (Taylo et al.,
2012; Xin et al., 2013). However, the spatial
resolution of GCM and RCM are respectively
between [250Km, 600 km] and [30Km, 90Km]
(Chokkavarapu & Ravibabu, 2019). Hence, the GCM
and RCM are too coarse to assess local environmental
factors (Chokkavarapu & Ravibabu, 2019; Diallo et
al., 2012; Zeng et al., 2016). To overcome the GCM
and RCM data uncertainty, global and regional
precipitation data are downscaled at a finer scale
resolution (IPCC, 2014). Downscaling coarse
precipitation data aims to assess the likely future
rainfall data with less uncertainty. The most used
methods in this sense are: delta/ratio, stochastic
downscaling, statistical downscaling, and dynamic
downscaling (Chokkavarapu & Ravibabu, 2019).
Statistical downscaling has the advantage to be less
computationally demanding, cheaper and more
convenient for users. Among the developed tools in
this sense, the Statistical Downscaling Model SDSM,
which has been efficiently used by several researchers
to downscale GCM coarse data. Indeed, (Y. Zhang et
al., 2016) used SDSM to downscale GCM products,
based on CanESM2 predictors over the Xin River
Basin. S. Samadi et al (Samadi et al., 2011) used
SDSM for downscaling HadCM3 Global Circulation
Model data based on NCEP/NCAR reanalysis, over
Iran for a baseline period between 1964 and 2001. M.
M. Gulacha et al (Gulacha & Mulungu, 2017)
generated climate change scenarios for precipitation
and temperature using SDSM in Wami-Rivu river
basin Tanzania. The SDSM was used to downscale
HadCM3 under A1 and A2 scenarios. Tukimat et al.,
2019 analyzed the accuracy of projected precipitation
at ungauged rainfall stations using SDSM and
CanESM2 projected data under RCP4.5 and RCP 8.5.
In this study, we used the second-generation
Canadian Earth System Model (CanESM2)
developed in the fifth version of Coupled Model
Intercomparison Project (CMIP5) in the Statistical
Downscaling Model (SDSM) software to downscale
precipitations in Ziz watershed controlled by Hassan
Addakhil reservoir . These projections were used
afterwards in assessing future inflows of Hassan-
Addakhil dam in front of hydroclimatic variation
under climate change. The measured precipitation
recorded for Foum Zaabel, and Foum tilicht rain
gauge stations in this watershed were used in SDSM
for calibration and validation considering 1983-2012
as a baseline period and (2035-2064) ,(2065-2094) as
future periods to compare with. After successful
calibration and validation of historical data compared
to the modeled one, projected precipitations for the
two future horizons 2050 and 2080, were modeled in
HEC-HMS to generate future inflows of Hassan
Addakhil dam.
2 MATERIALS AND METHODS
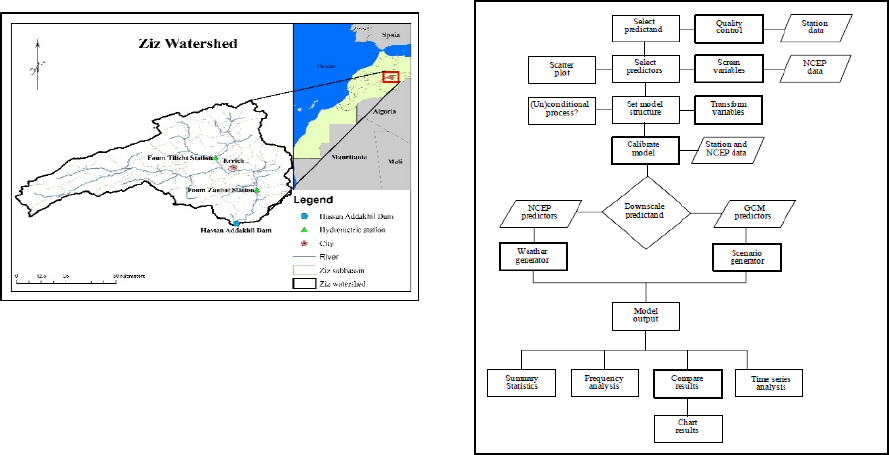
2.1 Study Area
The study is carried out for the watershed of Hassan
Addakhil dam (Figure 1), located in the southeastern
of Morocco.
The measured precipitation data for Foum tilicht
and Foum Zaabel rain gauge stations, located
upstream the dam, were provided by the Hydraulic
Basin Agency of Ziz-Guir-Rheriss. The daily
maximum rainfall data were provided over the period
1983-2012 (the most available data) of the rain
stations of Foum Zaabel and Foum Tillicht. Over the
period ranging from 1983-2012, the station of Foum
Zaabel registered a maximum and minimum daily
precipitation of 64 mm and 0 mm respectively, with a
mean and standard deviation respectively of 0.41mm
and 2.57. On other hand, the station of Foum Tilicht
is characterized by a maximum and minimum average
daily precipitation of 50.2 mm and 0 mm
respectively, with a mean and standard deviation
respectively of 0.33mm and 1.90.
Figure 1: Ziz watershed Location
2.2 Climatic Data and Downscaling
In this study, the second-generation Canadian Earth
System Model (CanESM2) integrated in the Coupled
Model Intercomparison Project Phase 5 (CMIP5) was
used to investigate future changes in Ziz watershed in
terms of precipitation under different representative
concentration pathway (RCPs). Indeed, CanESM2,
which was developed by the Canadian Centre for
Climate Modelling and Analysis (CCCma) of
Environment and Climate Change Canada is freely
available in the portal: http://climate-
scenarios.canada.ca/?page=pred-canesm2. 26
atmospheric variables (predictors) from the National
Centre for Environmental Prediction (NCEP)
reanalysis were used during calibration and validation
(1983-2005), while CanESM2 predictors data (of a
spatial resolution of 2.81°) were used for projections
under the intermediate and pessimistic scenarios
RCP4.5 and RCP8.5 (2013-2100).
The downscaling steps were conducted in SDSM
software developed by (Wilby et al., 2002). This
software enables reducing the uncertainty of GCMs
at a local region using statistical downscaling leading
to climate change scenarios at a daily time-scale.
SDSM model is based on multiple regression and
stochastic weather models. For the correlation
between independent variables and the dependent
variable, SDSM uses empirical statistical techniques.
Indeed, the predictor variables provide daily data at
the large-scale atmosphere and the predictand
describes the conditions of local climatic conditions.
A stochastic algorithm is used to calibrate the
predicted precipitations to fit the observed ones in the
best way. (Pervez & Henebry, 2014). Based on the
GCM independent variables, the stochastic weather
generator algorithm is also carried out for
precipitation prediction. (Figure 2)
Figure 2: Climate scenario generation using SDSM (Wilby
& Dawson, 2007)
2.3 Hydrological Modeling
The goal of the current phase is to estimate the future
inflows of Hassan Addakhil dam under climate
change scenarios. The projected future hydrologic
inflows resulted from modelling projected
precipitations using HEC-HMS software. Several
scenarios have been modelled. Indeed, two future
horizons were considered for each RCP, which has
led to six future inflows series. HEC-HMS
(Hydrologic Engineering Center - Hydrologic
Modeling System) is a hydrology software developed
by engineers from the United States Army (U.S.
Army Corps of Engineers). The hydrologic model is
based on the Soil Conservation Curve Number
method (SCS-CN) (USDA, 1986). Besides, the
Hydrological model has been calibrated and validated
for the study are of the present paper by (Elhassnaoui
et al., 2019).
3 RESULTS AND DISCUSSION
3.1 Screening of Predictors
Precipitation over the period 1983-2012 was taken as
a baseline period. Quality control was first
undertaken in SDSM to check the total number of
observed values as well as of missing values.
Following this, “Screen variables” is a primary step
that allows identifying more sensible predictors to the
available daily measured data. Correlation analysis
and scatter plots lead to finding the most suitable
parameters for building calibration relationships.
More correlated parameters correspond to low P-
value with higher Partial r. Three predictors were
found more sensible for Foum Zaabel and two for
Foum Tillicht (Table 1).
Table 1: Selected predictors for the two rain gauge stations
Station Screened predictors
Foum Zaabel
Ncepp850gl
Nceps850gl
N
cepp1z
g
hl
Foum Tillicht
Ncepp1zghl
N
cepp8
_
v
g
l
3.2 Calibration and Validation in
SDSM
Calibrating observed precipitation using the selected
predictors consist of developing relationships
between predictor variables and predictand variables.
This process, which has been conducted for the period
1983-2005, led to satisfactory results, where R-square
R
2
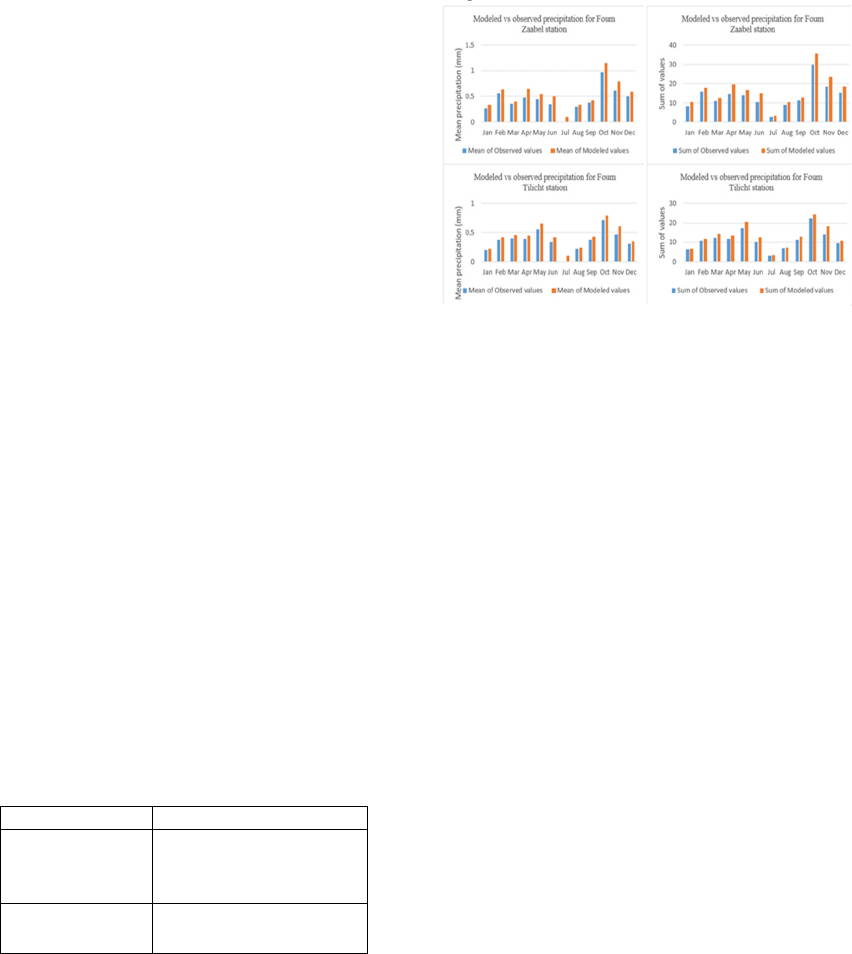
ranges from 0.73 to 0.82. Indeed, Comparison
between observed series and generated ones using
weather generator indicated approximate values.
(Figure 3)
Figure 3: Graphical comparison between observed and
modeled precipitation (1983-2005) (upper part for Foum
Zaabel and lower part for Foum Tillicht station)
3.3 Scenario Generator: Climate
Projections
Precipitation has been downscaled using outputs
from CanESM2 for the three RCPs: 2.6, 4.5, and 8.5.
Projections have been then compared to the chosen
baseline period 1983-2012. Two horizons of
projections are studied: 2050 (2035-2064) and 2080
(2065-2094).
Projections for the two stations showed different
changes. For Foum Zaabel, mean precipitation would
tend to decrease in the 2050s from November to
March with a percentage ranging from -5% to-39%
for RCP 2.6, -1% to -42% for RCP 4.5 and -7% to -
45% for RCP 8.5. This period would know the same
trend in the 2080s with decrease between -2% and -
34% for RCP 2.6, -6% and -41% for RCP 4.5, -11%
to -56% for RCP 8.5. In parallel with that, mean
precipitation projections for the period from April to
October tend to increase. This can be explained by
extreme events and summer storms that would be
intensified in the area due to climate change. Months
of June and October showed the highest increase, as
shown in the tables below. The sum of monthly
values for Foum Zaabel was in line with mean values
changes. (Table 2, Table 3 and Figure 4)
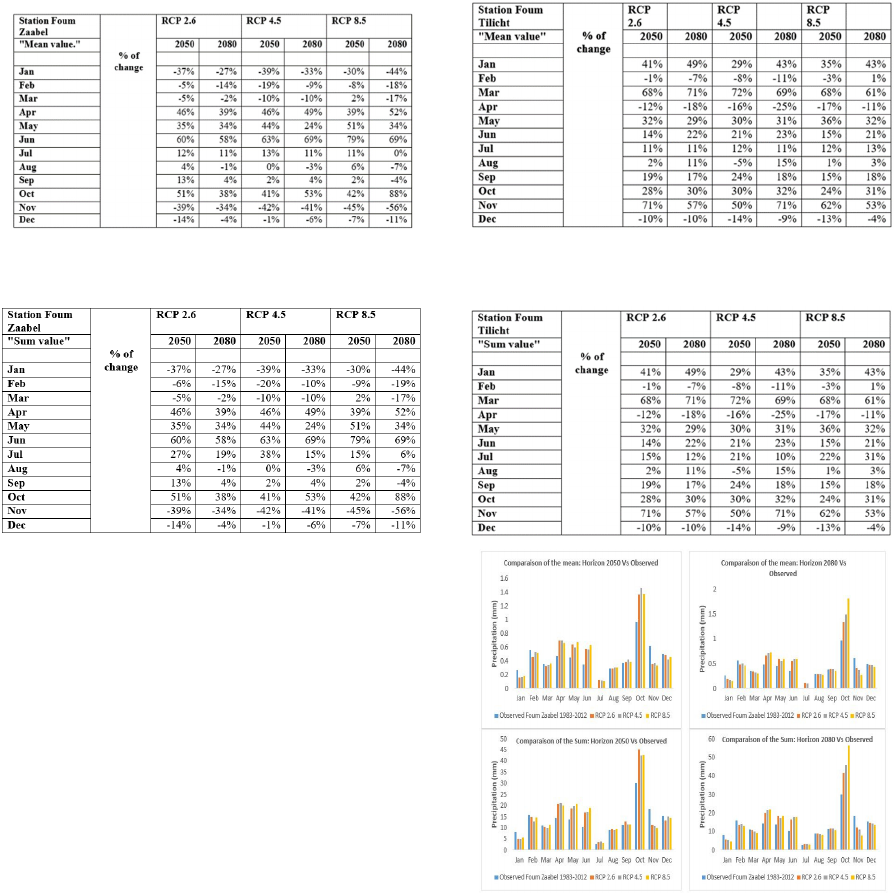
Table 2: Future variation of monthly mean precipitation at
Foum Zaabel station
Table 3: Future variation of monthly sum of precipitation at
Foum Zaabel station
On the contrary, Foum Tilicht station showed
fewer trends to decrease and more ones to increase.
Indeed, except February, April and December, other
months were characterized generally by rising mean
and sum precipitation values. The highest rises were
remarked in March and October.
Overall, projections indicated that the sum of
precipitations would increase for Foum Zaabel
compared to the reference period by 14% for RCP2.6,
11% for 4.5%, and 14% for RCP8.5 in the 2050s. For
the 2080s these changes would move to 11%, 14%,
and 15% for RCP2.6, RCP4.5, and RCP 8.5
respectively. Concerning Foum Tilicht, this increase
is estimated at 22%, 19%, and 20% for the 2050s,
whereas in the 2080s it's around 21% for RCP 2.6 and
RCP4.5 and 22% for RCP8.5. (Table 4, Table 5 and
Figure 5)
Table 4: Future variation of monthly mean precipitation at
Foum Tilicht station
Table 5: Future variation of monthly sum of precipitation at
Foum Tilicht station
Figure 4: Future variation of monthly mean and sum of
precipitation at Foum Zaabel station under RCP 2.6, RCP
4.5 and RCP 8.5
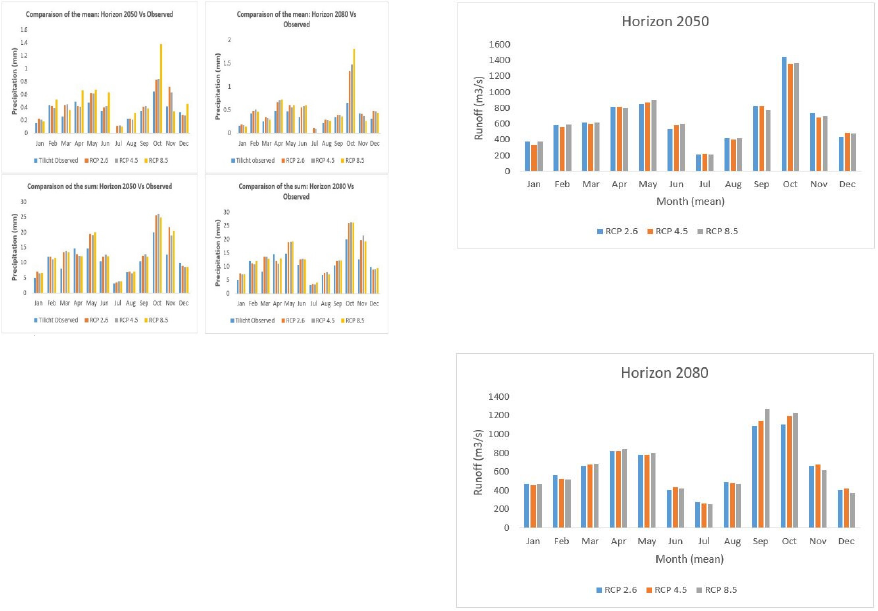
Figure 5: Future variation of monthly mean and sum
precipitation at Foum Tilicht station under RCP 2.6, RCP
4.5 and RCP 8.5
3.4 Hydrological Modeling: Climate
Projections
The Future projection of the Hassan Addakhil dam
inflow, under RCP 2.6, RCP 4.5 and RCP 8.5 for the
2050 horizon, shows that the maximum inflow is
likely to occur during October. The average monthly
dam inflow during October is 1442 m
3
/s for RCP 2.6,
1359 m
3
/s for RCP 4.5 and 1367 m
3
/s for RCP 8.5. In
the other hand the minimum monthly dam inflow, for
the 2050 horizon, is likely to occur during July. The
average dam inflow during July is 216 m
3
/s for RCP
2.6, 222 m
3
/s for RCP 4.5 and 211 m
3
/s for RCP 8.5.
For the 2080 horizon, the monthly maximum inflow
is likely to occur during October, for RCP 2.6 and
RCP 4.5, however the simulation under RCP 8.5
shows that the monthly maximum inflow will occur
during September. The average monthly dam inflow
during October is 1107 m
3
/s for RCP 2.6. In other
hand the average dam monthly inflow during
September is 1224 m
3
/s for RCP 8.5. Furthermore, the
minimum monthly dam inflow, for the 2050 horizon,
is likely to occur during July. The average monthly
dam inflow during July is 274 m
3
/s for RCP 2.6, 260
m
3
/s for RCP 4.5 and 256 m
3
/s for RCP 8.5.
Figure 6: The Future projection of the Hassan Addakhil
dam inflow, under RCP 2.6, RCP 4.5 and RCP 8.5 for the
2050 horizon
Figure 7: The Future projection of the Hassan Addakhil
dam inflow, under RCP 2.6, RCP 4.5 and RCP 8.5 for the
2080 horizon
4 CONCLUSIONS
Daily rainfall data for Foum Tilicht and Foum Zaabel
rain gauge stations were provided by the hydraulic
agency of Ziz-Guir-Rheriss for the period 1983-2012.
The Coupled Model Intercomparison Project Phase 5
(CMIP5) precipitation data was downscaled for these
stations at a daily time-scale, using CanESM2 data in
SDSM software. Future precipitation projections over
the period 2013-2100, were generated for three
Representative Concentration Pathway, namely
RCP2.6, RCP4.5 and RCP8.5 and compared with the
baseline period 1983-2012. HEC-HMS was then used
considering these projected precipitations to evaluate
future inflows of Hassan-Addakhil dam. Trends
towards increase were more remarked for the two
stations compared to months with decreasing
precipitations. As an overall assessment of the sum
precipitation, Foum Zaabel showed a trend to
increase around 14% for the three RCP while Foum
Tilicht precipitation would tend to increase up to
20%. This could be interpreted by the likely tendency
to floods because of climate change effects.
Afterwards, Future inflows of the Hassan Addakhil
dam were assessed in HEC-HMS, for the three
scenarios RCP 2.6, RCP 4.5 and RCP 8.5 which has
showed that the maximum and minimum inflow are
likely to occur during October and July respectively.
ACKNOWLEDGEMENTS
The authors would like to acknowledge the support
through IRIACC Initiative sponsored by IDRC under
the project Number 106372-013.
REFERENCES
Chokkavarapu, N., & Ravibabu, V. (2019). Comparative
study of GCMs , RCMs , downscaling and hydrological
models : a review toward future climate change impact
estimation. SN Applied Sciences, 1(12), 1–15.
https://doi.org/10.1007/s42452-019-1764-x
Diallo, I., Sylla, M. B., Giorgi, F., Gaye, A. T., & Camara,
M. (2012). Multimodel GCM-RCM Ensemble-Based
Projections of Temperature and Precipitation over West
Africa for the Early 21st Century. Hindawi, 2012.
https://doi.org/10.1155/2012/972896
Dong, F. (2020). Jo u rn Pr pr oo. In Atmospheric Research.
Elsevier B.V.
https://doi.org/10.1016/j.atmosres.2020.104942
Ehsani, N., Vörösmarty, C. J., Fekete, B. M., & Stakhiv, E.
Z. (2017). Reservoir Operations Under Climate
Change : Storage Capacity Options to Mitigate Risk.
Journal of Hydrology.
https://doi.org/10.1016/j.jhydrol.2017.09.008
Elhassnaoui, I., Moumen, Z., Serrari, I., Bouziane, A.,
Ouazar, D., & Hasnaoui, M. I. (2019). Generation of
synthetic design storm hyetograph and hydrologic
modeling under HEC HMS for Ziz watershed.
International Journal of Innovative Technology and
Exploring Engineering, 8(10), 3308–3319.
https://doi.org/10.35940/ijitee.J1214.0881019
Gain, A. G. W. (2016). millennia river basins Measuring
global water security towards sustainable development
goals. Environ. Res. Lett, 11.
https://doi.org/10.1088/1748-9326/11/12/124015
Gulacha, M. M., & Mulungu, D. M. M. (2017). Generation
of climate change scenarios for precipitation and
temperature at local scales using SDSM in Wami-Ruvu
River Basin Tanzania. Physics and Chemistry of the
Earth, 100, 62–72.
https://doi.org/10.1016/j.pce.2016.10.003
IPCC. (2014). Climate Change 2014 Impacts, Adaptation,
and Vulnerability Part A: Global and Sectoral Aspects
Working Group II Contribution to the Fifth Assessment
Report of the Intergovernmental Panel on Climate
Change.
Kaito, C., Ito, A., Kimura, S., Kimura, Y., Saito, Y., &
Nakada, T. (2000). Topotactical growth of indium
sulfide by evaporation of metal onto molybdenite. In
Journal of Crystal Growth (Vol. 218, Issue 2).
https://doi.org/10.1016/S0022-0248(00)00575-3
Karmaoui, A., Barrick, R. K., Reed, M. R., & Baig, M. B.
(2020). Impacts of climate change on agriculture,
aquaculture, and fisheries.
https://doi.org/10.4018/978-1-7998-3343-7
Lutz, A. F., Maat, W., Biemans, H., & Shrestha, A. B.
(2016). Selecting representative climate models for
climate change impact studies : an advanced envelope-
based selection approach. INTERNATIONAL
JOURNAL OF CLIMATOLOGY.
https://doi.org/10.1002/joc.4608
Okkan, U., & Kirdemir, U. (2018). Investigation of the
Behavior of an Agricultural-Operated Dam Reservoir
Under RCP Scenarios of AR5-IPCC. Water Resources
Management, 32(8), 2847–2866.
https://doi.org/10.1007/s11269-018-1962-0
Pervez, S., & Henebry, G. M. (2014). Projections of the
Ganges – Brahmaputra precipitation — Downscaled
from GCM predictors.
Journal of Hydrology, 517, 120–
134. https://doi.org/10.1016/j.jhydrol.2014.05.016
Raje, D., & Mujumdar, P. P. (2010). Advances in Water
Resources Reservoir performance under uncertainty in
hydrologic impacts of climate change. Advances in
Water Resources, 33(3), 312–326.
https://doi.org/10.1016/j.advwatres.2009.12.008
Samadi, S., Ehteramian, K., & Sari, B. (2011). SDSM
ability in simulate predictors for climate detecting over
Khorasan province. Procedia - Social and Behavioral
Sciences, 19, 741–749.
https://doi.org/10.1016/j.sbspro.2011.05.193
Shah, Z., & Kumar, M. D. (2008). In the midst of the large
dam controversy: Objectives, criteria for assessing
large water storages in the developing world. Water
Resources Management, 22(12), 1799–1824.
https://doi.org/10.1007/s11269-008-9254-8
Sillmann, J., Kharin, V. V, Zwiers, F. W., Zhang, X., &
Bronaugh, D. (2013). Climate extremes indices in the
CMIP5 multimodel ensemble : Part 2 . Future climate
projections. JOURNAL OF GEOPHYSICAL
RESEARCH: ATMOSPHERES, 118(November 2012),
2473–2493. https://doi.org/10.1002/jgrd.50188
Sisco, M. R., Bosetti, V., Weber, E. U., & Weber, E. U.
(2017). When do extreme weather events generate
attention to climate change ? Climatic Change, 227–
241. https://doi.org/10.1007/s10584-017-1984-2
Taylo, K. e., STouffer, R. J., & Meehl, G. a. (2012). AN
OvERvIEw OF CMIP5 AND ThE ExPERIMENT
DESIGN. American Meteorological Society, 3(april),
485–498. https://doi.org/10.1175/BAMS-D-11-
00094.1
Trenberth, K. E. (2011). Changes in precipitation with
climate change. CLIMATE RESEARCH, 47, 123–138.
https://doi.org/10.3354/cr00953
Tukimat, N. N. A., Syukri, N. A. A., & Malek, M. A.
(2019). Heliyon Projection the long-term ungauged
rainfall using integrated Statistical Downscaling Model
and Geographic Information System ( SDSM-GIS )
model. Heliyon, 5(September), e02456.
https://doi.org/10.1016/j.heliyon.2019.e02456
USDA. (1986). Urban hydrology for small watershed TR-
55. Technical release no. 55. USDA.
Vuuren, D. P. Van, Edmonds, J., Kainuma, M., Riahi, K.,
Nakicenovic, N., Smith, S. J., & Rose, S. K. (2011). The
representative concentration pathways : an overview.
Climatic Change, 5–31.
https://doi.org/10.1007/s10584-011-0148-z
Wilby, R. L., & Dawson, C. W. (2007). SDSM 4.2— A
decision support tool for th e assessment of regional
climate change impacts, User Manual. Department of
Geography, Lancaster University, UK, August, 1–94.
Wilby, R. L., Dawson, C. W., & Barrow, E. M. (2002).
SDSM - A decision support tool for the assessment of
regional climate change impacts. Environmental
Modelling and Software, 17(2), 145–157.
https://doi.org/10.1016/s1364-8152(01)00060-3
Xin, X., Zhang, L., Zhang, J., Wu, T., & Fang, Y. (2013).
Climate Change Projections over East Asia with BCC
_ CSM1 . 1 Climate Model under RCP Scenarios.
Journal of the Meteorological Society OfJapan, 91(4),
413–429. https://doi.org/10.2151/jmsj.2013-401
Yang, J., Yang, Y. C. E., Chang, J., Zhang, J., & Yao, J.
(2019). Impact of Dam Development and Climate
Change on Hydroecological Conditions and Natural
Hazard Risk in the. Journal of Hydrology, 124177.
https://doi.org/10.1016/j.jhydrol.2019.124177
Zeng, X., Wang, M., Zhang, Y., Wang, Y., & Zheng, Y.
(2016). Assessing the Effects of Spatial Resolution on
Regional Climate Model Simulated Summer
Temperature and Precipitation in China : A Case Study.
Hindawi, 2016.
Zhang, L. (2000). Social Impacts of Large Dams : Lubiao
Zhang. World Commission on Dams.
Zhang, Y., You, Q., Chen, C., & Ge, J. (2016). Impacts of
climate change on streamflows under RCP scenarios: A
case study in Xin River Basin, China. Atmospheric
Research.https://doi.org/10.1016/j.atmosres.2016.04.0
18
Zhang, Z., Huang, J., Huang, Y., & Hong, H. (2015).
Estuarine , Coastal and Shelf Science Stream flow
variability,doi.org/10.1016/j.ecss.2015.10.002
