
Assessment of Groundwater Resources based on IT Platform of
GIS-Mathematical Model to Account for Climate Change in the Sahel
Aquifer (Morocco)
Mohamed Jalal El Hamidi
1a
, Abdelkader Larabi
1
, Mohamed Faouzi
1
and Ismail Er-Rakady
1
1
Regional Water Centre of Maghreb, LAMERN, EMI, Mohammed V University in Rabat, Rabat, Morocco
Keywords: Sahel, climate change, intensive pumping, GIS, thematic maps, groundwater models, IT techniques.
Abstract: The Sahel is part of the coastal Sahel basin of Doukkala that borders the Atlantic Ocean on the northwest and
covers an area of approximately 4146 km
2
. It includes several urban centres and a large industrial complex.
In this area, the Sahel aquifer is vulnerable to Climate Change (CC) and intensive pumping mainly in the
coastal fringe, where the agricultural activities are significant. The main objectives of this study are to develop
IT (Information Technology) platform based on a Geographic Information System (GIS) and mathematical
modelling environment to produce thematic maps for analysing and treatment of spatial and temporal
characteristics with respect to groundwater flow and water resources management and CC of the Sahel aquifer.
Based on this GIS database, a conceptual model followed by groundwater models were designed and
simulated piezometric levels, drawdowns and water balance under steady state conditions. The obtained
results show the pertinence of different IT techniques used and evaluate their contribution and also their
possible constraints in a coastal environment, including the improvement of the Sahel aquifer knowledge on
water resources that assist managers in monitoring, planning and operating measures to satisfy water supply
and irrigation demand under CC constraints in the Sahel area.
1 INTRODUCTION
Climate change (CC) refers to significant changes and
measures of climate like temperature and
precipitation over long time periods and large
geographic area. It’s human activities from pollution
to overpopulation are driving up the temperature and
fundamentally changing the world around us. CC has
consequences for our oceans, our weather, our food
sources and our health, others forecast rising sea
levels which could flood coastal areas around the
world. Weather patterns could change making
weather more extreme (Stott et al., 2016). This means
not only more intense major storms floods and heavy
snowfall, but also longer and more frequent droughts,
less stream flow and less groundwater recharge and
indirectly through changes in groundwater
abstraction and use patterns.
Morocco currently faces major water challenges
related to the sustainable management of water
resources and the delivery of water services for
a
https://orcid.org/0000-0002-6401-6357
domestic, agricultural and industrial use. CC and
climate variability can increase the risks and the costs
of water resources management, impact the quantity
and quality of water resources, and generate
secondary effects that influence socio-economic
vulnerability and environmental sustainability (El-
Fadel and Bou-Zeid, 2005). This is the case of the
coastal zones which are heavily urbanized, a fact that
makes the need for freshwater even more acute.
Inappropriate management of coastal aquifers may
lead to the intrusion of saltwater into freshwater
wells, destroying them as sources of freshwater
supply. The degradation or the unavailability of
groundwater present a great risk for the future of
Drinking Water Supply/Industry (DWSI) and
irrigation agriculture, since some farms and pumping
wells for DWSI in the coast would be abandoned. So,
they would result in serious socio-economic
consequence to people living there. Hence, a clear
understanding of these risks and impacts is necessary
to inform policy formulation and decision-making in
support of efforts to achieve sustainable development
in Morocco.
The Regional Initiative for the Assessment of
Climate Change Impacts on Water Resources and
Socio-Economic Vulnerability in the Arab Region
(RICCAR) (ACSAD and ESCWA, 2017) has shown
that the Arab region will experience an increase of
temperature and a decrease of precipitation. More
specifically, the temperature increases one to two
degrees on average by mid-century and by end we
will get two to three degrees increasing in
temperature under Representative Concentration
Pathway (RCP) 4.5. At the higher emission scenario,
the RCP 8.5, by mid-century we will reach
temperatures of two to three degrees increase and by
the end we could even reach four to five degrees
Celsius increase temperatures on average (Graham
and Sjökvist, 2017 ; ACSAD and ESCWA, 2017).
Hence, it is projected that these groundwater
resources will be affected by CC due to a reduction in
natural recharge from reduced precipitation, the rise
in temperature and the decrease in evapotranspiration
caused in part by lower precipitations.
2 BACKGROUND
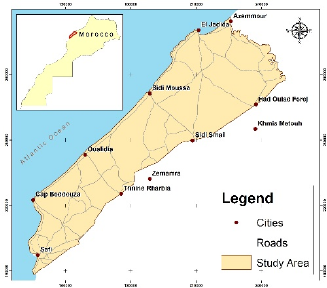
The Sahel aquifer is located in the Oum Er Ribia basin
and belongs to the Western Moroccan Meseta,
between latitudes, 32°15’and 33°15’ and between
longitudes, West 7°55’and 9°15’. It covers the coastal
front of the hydrogeological basin between Safi and
El Jadida (Fig. 1). This region borders the: (1)
Atlantic Ocean on the northwest; (2) Sahel of Safi on
the south; (3) Oum
-Er-Rbia and the El Jadida plateau
on the north; (4) Doukkala plain on the east.
In general, the Sahel is located between the
Doukkala region and the coast with an area of
approximately 4146 km
2
, it appears as a band 25 to
44 km wide and 140 km long covering the coastal
front of the hydrogeological basin between Safi and
El Jadida.
The Sahel is defined by the tabular regime of the
secondary and tertiary deposits on primary grounds
strongly pleated by the hercynian mountain chain and
described four main hydrogeological units closely
dependent, with age ranging from cretaceous to Plio-
Quaternary (Ferré and Ruhard, 1975). It is the main
supplier of water resources for drinking water of
several urban centers of the area (the cities of El
Jadida and Safi) and the industrial water supply of the
OCP installations and the processes of phosphate
washing (Jorf Lasfar). Furthermore, the Sahel aquifer
is suffering from intensive pumping mainly in the
coastal fringe, where the agricultural activities are
carried out significantly to produce vegetable crops
by irrigation from several pumping wells (ABHOER,
2012).
Figure 1: Location map of the study area.
For this purpose, all collected information
(relevant technical reports and RICCAR data relevant
to datasets and outputs of the study area) were
processed and led to: (i) Study the hydrogeology
characteristics and hydrodynamic functioning of the
SCA ; (ii) Analyse the CC impact on groundwater
resources in the SCA based on emission scenarios
(RCP 4.5 and 8.5) ; (iii) Elaborate a GIS database to
produce decisional thematic maps for the area ; (iv)
Design a conceptual three-dimensional groundwater
model of the Sahel Aquifer; and (v) Develop a Three-
dimensional model in steady state to assess the water
balance.
2.1 Hydrogeological Setting
The hydrogeologic formations are dominated by
limestone and formed mainly by four
hydrogeological units (Ferré and Ruhard, 1975):
Sandstone and limestone of the Plio-
quaternary;
Limestones of the Middle Cenomanian;
Dridrate limestones of the upper Hauterivian;
Marl-limestones of the Lower Cretaceous.
These aquifer units constitute water resources of
variable importance according to sectors.
In the Sahel, the piezometric evolution depends
on the natural conditions of aquifer system
recharge/discharge which were modified by the
projects of hydro-agricultural development, the
Under-Service irrigated perimeter in Doukkala and
pumping for irrigation purposes in coastal Sahel. The
extensive extraction of groundwater for the irrigation
caused in many places deteriorated water quality
linked to the salinity increase of groundwater due to
the saltwater intrusion (ABHOER, 2012).
2.2 Impacts of Climate Change
Datasets used in this assessment comprises a
combination of regional climate modelling
projections data generated from RICCAR, and a set
of local observation datasets for precipitation,
temperature for our study area. This section is based
on extracting time series of Pr (Precipitation) and Ta
(Temperature) variables for the entire time period
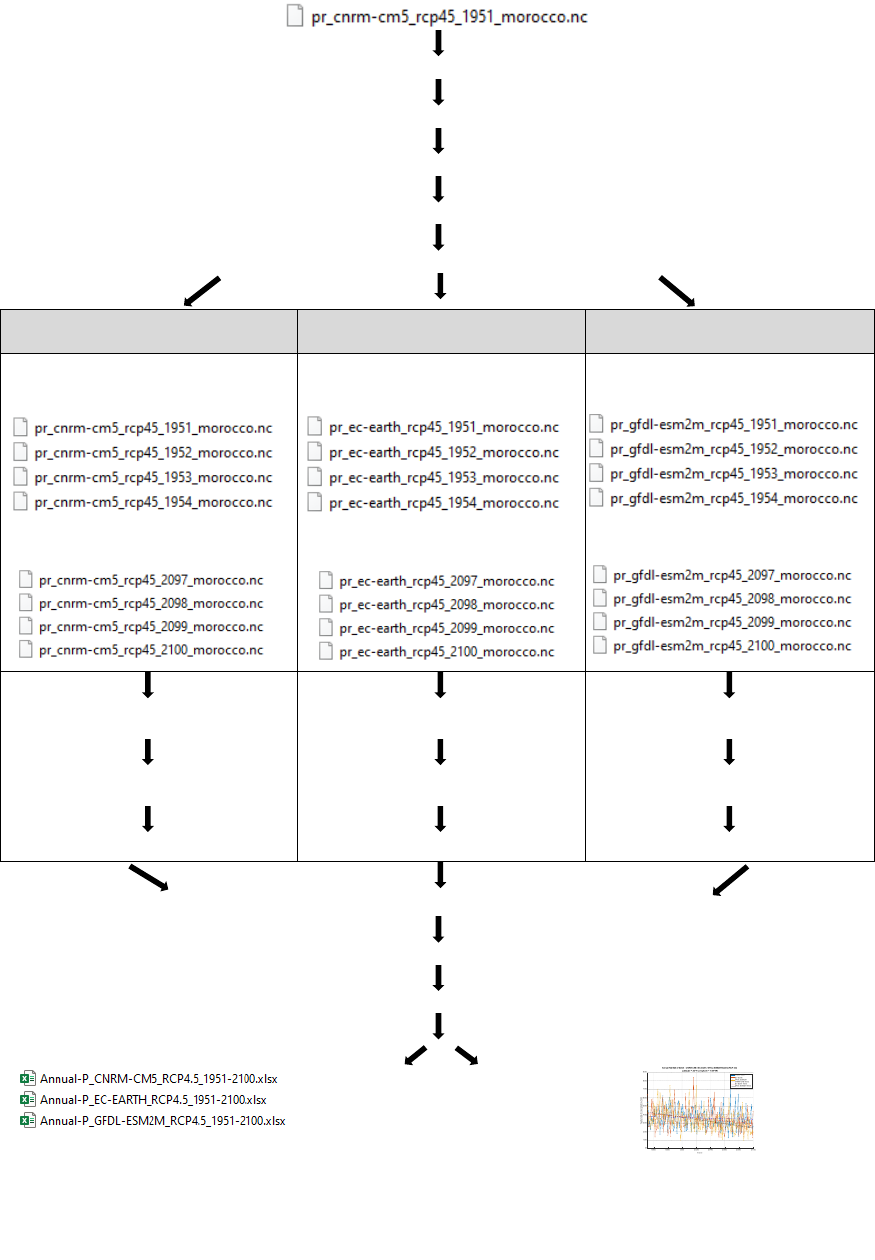
from 1951 to 2100. We read NetCDF files (.nc) using
MATLAB to extract time series of Pr (Precipitation)
and Ta (Temperature) variables for the entire time
period from 1951 to 2100. We extract data for a
specific latitude and longitude coordinates. The
location of our study area is at latitude = 33° North
and longitude = 8.36° West.
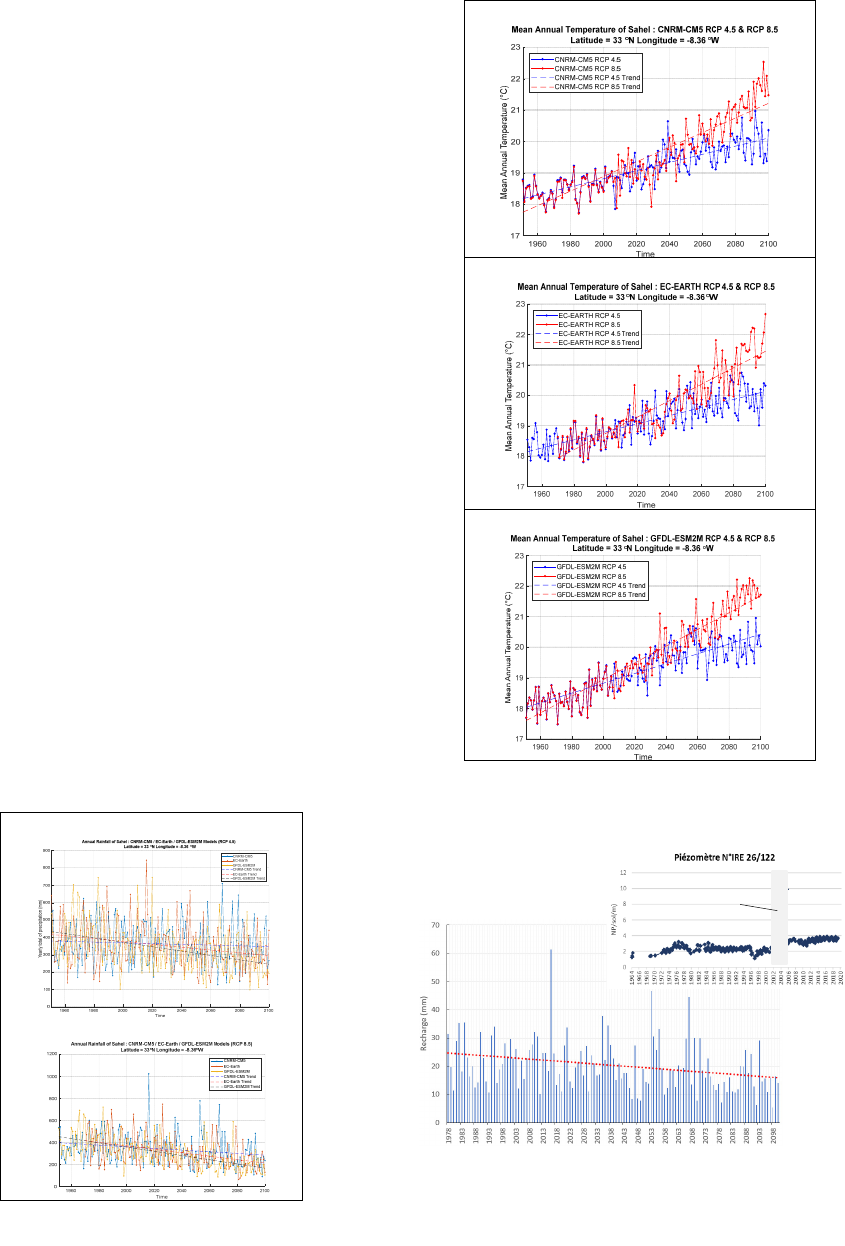
Based on the RICCAR data, we could present
some plots of time series that summarize and show
the updated knowledge on the climatology of our
study area. We have displayed and edited some in Fig.
2 and 3, which show the evolution of projected P, T
for various climate models and scenarios. The main
trends of the parameter variation are also provided to
analyse and measure the CC trends. The procedure to
extract Pr data is provided in Fig. 5.
These figures show clearly that temperatures are
mainly increasing, while precipitations are mainly
decreasing for both scenarios. Hence, the CC impacts
in the area cause recurrent droughts and decrease in
aquifer recharge (Fig. 4) that directly affects the
groundwater level (e.g. increase of water depth as
demonstrated in the well no. 26/122).
a.
b.
Figure 2: Precipitations over time (1951-2100) in the study
area for: a. RCP 4.5 and b. RCP 8.5.
a.
b.
c.
Figure 3: Mean temperature (°C) over time (1951-2100) in
the study area for climate models : a. CNRM- CM5, b. EC-
EARTH and c. GFDL- ESM2M (RCP 4.5 and RCP 8.5).
Figure 4: Annual variation of natural recharge from 1978
to 2100 (e.g. CNRM-CM5, RCP 8.5) and observed
piezometric records for observation well 26/122 from 1964
to 2020 located in the coast near sidi moussa city.
Ye a
r
ly total o
f
p
r
ecipitation (mm)
No available data
Import daily NetCDF file (e.g. *.nc in 1951)
Read the information (for each dimension: latitude, longitude, time)
Display contents of NetCDF data source in Command Window
Extract longitude, latitude and time values of all the grid points
Find and Extract our specific location (Longitude and Latitude)
Print output locations found in Command Window
For CNRM-CM5, RCP4.5 For EC-EARTH, RCP4.5 For GFDL-ESM2M, RCP4.5
Read multiple NetCDF files (daily
time series from 1951 to 2100)
.
.
.
Read multiple NetCDF files (daily
time series from 1951 to 2100)
.
.
.
Read multiple NetCDF files (daily
time series from 1951 to 2100)
.
.
.
Extract time series of precipitation
of our study area
Extract time series of precipitation
of our study area
Extract time series of precipitation
of our study area
Calculate annual rainfall from daily
data
Calculate annual rainfall from daily
data
Calculate annual rainfall from daily
data
Calculate trend of precipitation Calculate trend of precipitation Calculate trend of precipitation
Plot Precipitation versus Time of CNRM-CM5, EC-EARTH and GFDL-ESM2M Models
Plot fit linear trend of precipitation of CNRM-CM5, EC-EARTH and GFDL-ESM2M Models
Add legend with title and axis labels
Export rainfall
data to Excels
Export legend to
vector
Figure 5: Flow chart of the steps followed for extraction of precipitations versus time (1950-2100) for CNRM-CM5,
EC-EARTH and GFDL-ESM2M climate Models, RCP4.5 scenarios.
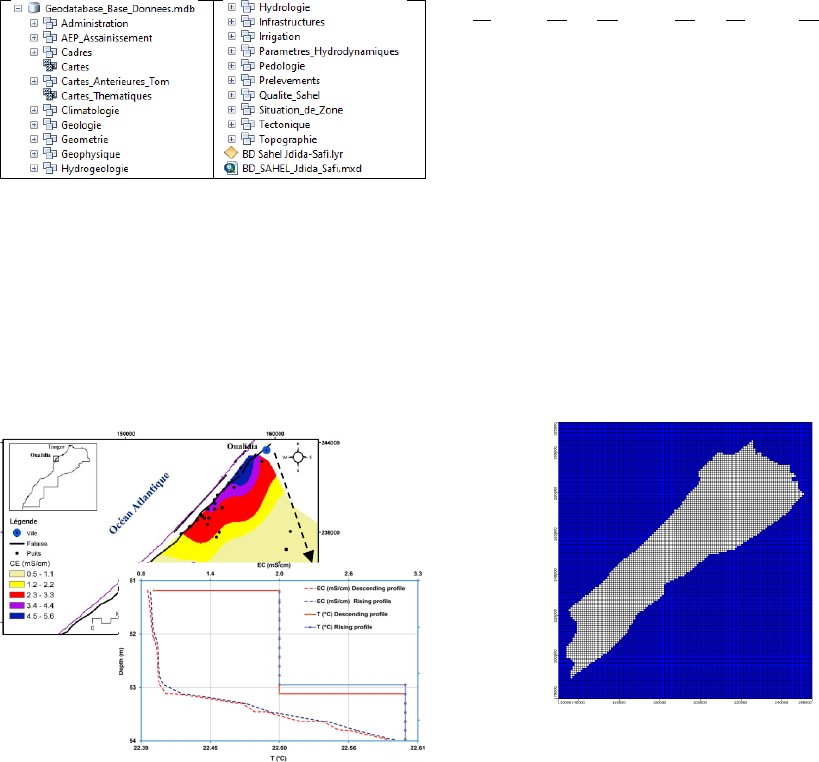
2.3 Hydrogeological
Database
This section is the results from the development of the
hydrogeological geodatabase (Fig. 6) to produce
decisional thematic maps and diagrams, providing
more information layers to managers in water
resources. The obtained thematic layers were
organized according to the needs of managers and
decision makers. This action facilitates consultation,
customization and duplication of information in
relation to the various aspects of water resources.
Figure 6: Geodatabase structure of the SCA with layers.
The lateral and vertical measurements carried out
in well O45 are integrated in our GIS. The results
show an increase of water Electrical Conductivity
(EC) horizontally and within the depth, due to
seawater intrusion as illustrated by figure 7 (Fadili et
al., 2018). This led to groundwater quality
degradation (by salinisation), especially in the
Oualidia sector.
Figure 7: Map and vertical profile of water EC in well O45
and Oualidia sector (in 2011), (Fadili et al., 2018).
2.4 Groundwater Management Model
Based on the GIS database, the conceptual model of
the SCA was established on the basis of the
hydrogeological characteristics, the hydrodynamic
parameters and the spatial variations of the aquifer
piezometry in 1976, which allowed understanding the
hydrogeological functioning of the SCA, its structure
and its geometrical extension based on the
hydrogeological database developed in this work.
Then, the formulation of this conceptual model
led to develop a three-dimensional numerical
groundwater flow model. It simulates this flow,
under steady state conditions, by solving Equation (1)
(McDonald and Harbaugh, 1988) by means of the
Visual Modflow (USGS, 2005).
Equation (1):
𝜕
𝜕𝑥
𝐾
∗
𝜕ℎ
𝜕𝑥
𝜕
𝜕𝑦
𝐾
∗
𝜕ℎ
𝜕𝑦
𝜕
𝜕𝑧
𝐾
∗
𝜕ℎ
𝜕𝑧
𝑊0
Where Kxx, Kyy, and Kzz are the hydraulic
conductivities along the x, y, and z coordinate axes
(L/T), h is hydraulic head (L), W is the volumetric flux
per unit volume and represents sources and (or) sinks
of water (T
-1
).
2.4.1 Discretization and Calibration
The 3D discretization method used is the finite
difference. The domain was cut into grid square cells
of 1000 m side oriented along the main Cartesian
axes. Thus, the idealized domain has 125 columns
along the X axis and 136 rows along the Y axis. The
number of active cells is 4114 (Fig. 8). Vertically, we
have considered one layer only. The blue cells
represent the inactive cells.
Figure 8: Discretization of the simulated domain by the
finite difference technique.
The calibration of the model is performed by
comparing the simulated piezometric heads obtained
by the model to the measured piezometric heads, and
the water balance dealt in the hydrogeological
characterization section. As for the measurement
network, 12 observation wells are available from
1976 and cover the whole area of SCA to carry out
the periodic piezometric measurements. The Kriging
method has been used to interpolate a data set to the
model grid.
2.4.2 Simulation and Results
The initial distribution of hydraulic conductivity
obtained mainly by the distribution of four
hydrogeological units allowed to shorten the
calibration. However, the initial calibration was
undertaken in ways, that not only minimizing the
difference between the measured and simulated
piezometric heads at 12 observation wells, but also,
to restore at best the general structure of the reference
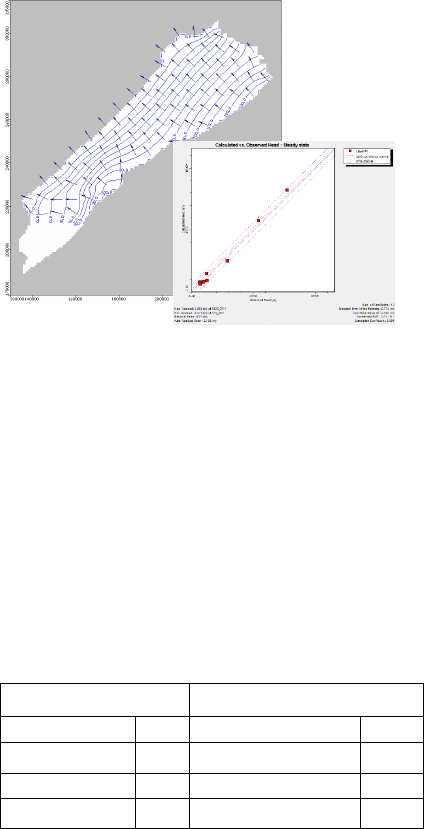
piezometric head map of 1976 (Fig. 9).
Figure 9: Simulated piezometry (m) and correlation
between measured and simulated heads for 1976.
At the end of this initial calibration, the model
provides the simulated water balance of the aquifer
system, where different terms of the water balance are
assessed. Calculated fluxes in each cell of the model
can locate the hydraulic exchange zones, especially at
the boundaries. The results in Table 1 shows that the
main inflow consists of the boundary inputs from
Doukkala aquifer and the main outflow is composed
of the natural drainage to the sea.
Table 1: Water balance of the aquifer system calculated
after calibration in steady state.
Inputs (in Mm
3
/year) Outputs (in Mm
3
/year)
Rain-infiltration 101.6 Agricultural pumping 36
Irrigation 4 DWSI pumping 10
Boundary inputs 574 Boundary outputs/sea 633.6
Total 679.6 Total 679.6
3 CONCLUSION
The IT platform composed of the established
hydrogeological database and the groundwater model
for the SCA has contributed to better understand the
hydrogeological characteristics and hydrodynamic
functioning of the aquifer, especially under CC.
Indeed, these results (1st step) are of great importance
to identify the impacts of CC (Pr and Ta for various
climate models extracted from 1951 to 2100) on
groundwater resources by coupling them to a
transient groundwater flow model (1976-2100, last
step going on). The final results will analyse the
implication these pose for socio-economic
vulnerability and sustainable development and
identify vulnerability hotspots that the managers have
to take into account for water resources management.
ACKNOWLEDGEMENTS
Data were collected from RICCAR, ABHOER,
ORMVA, and ONEE institutions. This research work
is also funded by the OCP Foundation (FOCP).
REFERENCES
ABHOER, 2012. Etude de la recharge de la nappe du
Sahel-Doukkala, MARCHE N°18/2012/ABHOER.
https://doi.org/10.4000/books.pub.896
ACSAD and ESCWA, 2017. Impact of Climate Change on
Extreme Events in Selected Basins in the Arab Region,
RICCAR Report,
https://arabsdgs.unescwa.org/en/read-digital-library.
El-Fadel, M., Bou-Zeid, E.R., 2005. Climate Change and
Water Resources in the Middle East: Vulnerability,
Socio-Economic Impacts, and Adaptation. SSRN
Electron. J. https://doi.org/10.2139/ssrn.278514
Fadili, A., Malaurent, P., Najib, S., Mehdi, K., Riss, J.,
Makan, A., 2018. Groundwater hydrodynamics and
salinity response to oceanic tide in coastal aquifers: case
study of Sahel Doukkala, Morocco. Hydrogeol. J. 26,
2459–2473. https://doi.org/10.1007/s10040-018-1812-
4
Ferré, M., Ruhard, J.-P., 1975. Les Bassins des Abda-
Doukkala et du Sahel de Azemmour à Safi. Ressources
en Eau du Maroc, Tome 2, Editions du Service
Géologique du Maroc.
Graham, P., Sjökvist, E., 2017. Regional Climate Modelling
and Regional Hydrological Modelling Applications in
the Arab Region, RICCAR,
https://arabsdgs.unescwa.org/en/read-digital-library.
McDonald, M.G., Harbaugh, A.W., 1988. A modular three-
dimensional finite-difference groundwater flow model,
Techniques of Water-Resources Investigations Report,
06-A1. Tech. Water-Resources Investig. United States
Geol. Surv. 588.
Stott, P.A., Christidis, N., Otto, F.E.L., Sun, Y.,
Vanderlinden, J.P., van Oldenborgh, G.J., Vautard, R.,
von Storch, H., Walton, P., Yiou, P., Zwiers, F.W.,
2016. Attribution of extreme weather and climate-
related events. Wiley Interdiscip. Rev. Clim. Chang. 7,
23–41. https://doi.org/10.1002/wcc.380
USGS, 2005. MODFLOW-2005 , The U . S . Geological
Survey Modular Ground-Water Model — the Ground-
Water Flow Process MODFLOW-2005 , The U . S .
Geological Survey Modular Ground-Water Model —
the Ground-Water Flow Process.
