
Classification of Hyperspectral Remote Sensing Images for Crop Type
Identification: State of the Art
Kawtar El Karfi
1
, Sanaa El Fkihi
2
, Loubna El Mansouri
3
and Othmane Naggar
4
1
National school For Computer Science (ENSIAS), Rabat, Morocco
2
National school For Computer Science (ENSIAS), Rabat, Morocco
3
The Agronomic and Veterinary Institute Hassan II (IAV), Rabat, Morocco
4
MAScIR - Moroccan Foundation for Advanced Science, Innovation and Research, Rabat, Morocco
Keywords:
Remote sensing data, Hyperspectral image HSI, Classification, Crop type mapping, Machine learning, Deep
learning
Abstract:
Hyperspectral imagery (HSI) is widely considered to be one of the most used technologies in different re-
mote sensing applications, such as crop mapping, which provides an essential baseline for understanding and
monitoring the Earth. Hyperspectral remote sensing, with its multiple narrow and continuous wavebands,
allow significant improvements in the understanding of physiological processes of crops and the changes in
their phenology, which are indistinct in multi-spectral remote sensing. A generous number of features can
be derived from the hyperspectral data, although the classification of crops using high-dimensional and high-
resolution data is a challenging task. The main objective of this paper is to list various techniques of machine
learning mostly applied for hyperspectral data classification, besides the different hyperspectral open datasets
mainly used in various researches.
1 INTRODUCTION
Remote sensing imagery classification gained huge
interest (Dou et al., 2018; Lu et al., 2011; Xia et al.,
2019) during the past five years,Considerable efforts
from different researches have been made to present a
variety of approaches for crop type identification us-
ing remote sensing images. The identification of cul-
tures as a research field has been widely investigated
in several studies (Sitokonstantinou et al., 2018; Lira
Melo de Oliveira Santos et al., 2019), most of these
studies rely mainly on remotely sensed imaging, as it
is an efficient and robust tool for collecting the infor-
mation needed to produce maps of crops. The gener-
ated maps are required in the process of making sus-
tainable decisions to assure the proper management
of agricultural areas, reduce costs, and create agrarian
policies(Orynbaikyzy et al., 2019).The current avail-
able sensors (e.g., multi/hyperspectral, synthetic aper-
ture radar, etc.)(Pandey et al., 2019) are increasingly
yielding different types of aerial or satellite images
with different resolutions (spatial resolution, spectral
resolution, and temporal resolution). For this purpose,
significant efforts have been made to develop vari-
ous datasets (Quinn et al., 2018; El Mansouri et al.,
2019). Despite this, accurate crop mapping still a
challenging assignment, due to the small size of the
plots, the large variety of crops species, and the mix-
ture of different crops and uncultivated areas in some
cases(Siachalou et al., 2017). A wide range of stud-
ies highly recommends the adoption of HSI as it can
provide high-resolution and high-dimensional data to
produce high-scale maps (El Mansouri et al., 2018;
Khan et al., 2018). HSI is a merging technique of dig-
ital imaging and spectroscopy. The concept is as fol-
lows: Hyperspectral sensors acquire reflected energy
for a wide range of spectral bands, from visible to re-
flected infrared range (Signoroni et al., 2019). They
allow the object in the image to be identified with high
precision (Sahoo et al., 2015), using various types of
variables, such as spectral signatures, vegetation in-
dices, and textural information. Due to the rich spec-
tral information, HSI can classify objects according
to their spectral features (Reshma and Veni, 2017).
Despite its ability and high classification accuracy,
HSI faces one major challenge that impacts the qual-
ity of the hyperspectral data classification, which is
handling the enormous amount of features. The main
objective of this paper is to highlight current classifi-
cation approaches applied in the field of remote sens-
ing. Mainly as the literature is very dense with differ-
ent approaches and methods, each with strengths and
weaknesses depending on the case studied, so we aim
to develop synthesis and see the impact of HSI with
deep learning as an axis of research. The rest of this
paper is organized as follows. Section 2 gives a brief
overview of HSI. Section 3 examines approaches in
the literature that are widely used for crop identifica-
tion. Our conclusion and summary are drawn in the
final section.
2 AN OVERVIEW OF
HYPERSPECTRAL IMAGES
2.1 Hyperspectral Imaging
The spectral imaging field can be divided into three
domains: multispectral imaging (MSI), hyperspectral
imaging (HSI), and ultra-spectral imaging (USI). MSI
is a system where the used image has few separated
wavelengths. In HSI, the image is obtained with an
abundance of continuous wavelengths. USI is a sys-
tem that uses only one image with a low spatial res-
olution of several pixels(Khan et al., 2018). Hyper-
spectral images are hypercube (a three-dimensional
shape) containing light intensity measurements where
the two first dimensions (X and Y) represent spatial
positions, and the third dimension represents spectral
variation. The images can be interpreted, typically, as
stacks of hundreds of two-dimensional spatial images
at different wavelengths, or tens of thousands of spec-
tra, aligned in rows and columns. Hyperspectral nar-
row bands, typically, contain 100–1500 wavebands
and collect data in the near-continuous spectrum from
several regions of the electromagnetic spectrum (ul-
traviolet, visible, near-, mid-, and far-infrared), which
offers many opportunities to study specific vegetation
variables (Elmasry et al., 2012).
2.2 Public Available Hyperspectral
Datasets
The use of different remotely sensed data is accord-
ing to user requirements and the need for high spa-
tial, spectral, temporal resolution, or a combination
of one or more of these and the area of coverage.in
this section; we illustrate some datasets that are free
and available for use (Table I).
• Indian Pines dataset:Indian Pines data set was
gathered by the AVIRIS sensor, over agricultural
areas in northwestern Indiana, with 145 pixel x
145 pixel images and 224 spectral bands... Six-
teen classes (Table I) are labeled (e.g., corn, grass,
soybean, woods, and so on).
• Pavia dataset:Pavia Centre and University are two
scenes acquired by the ROSIS sensor over the city
of Pavia, northern Italy. It is divided into two
parts: Pavia University (103 bands, 610 pixels x
340 pixels) and Pavia Center (102 bands, 1,096
pixels x 715 pixels). Nine labeled classes . They
contain various urban materials (such as bricks,
asphalt, and metals), water, and vegetation. This
dataset has been gained a popularity for a long
time and mostly used because it is one of the
largest sets of labeled HIS data.
• Botswana dataset: Botswana dataset is collected
by The NASA EO-1 satellite over the Okavango
Delta, Botswana in 2001-2004. The Hyperion
sensor on EO-1 obtain data at 30 m pixel resolu-
tion in 242 bands. Preprocessing of the data was
led by the UT Center for Space Research to fix the
anomalies.
• Salinas dataset: This dataset was collected by the
AVIRIS sensor with 224-band over Salinas Val-
ley, California, and is characterized by high spa-
tial resolution (3.7-meter pixels). It includes veg-
etables, bare soils, and vineyard fields.
• KSC dataset:Kennedy Space Center (KSC) was
collected by the NASA AVIRIS (Airborne Vis-
ible/Infrared Imaging Spectrometer) over the
Kennedy Space Center (KSC) on March 23, 1996,
in Florida, the KSC data was gathered with 224
bands, and spatial resolution of 18m.This dataset
represents 13 classes of the various land cover
types.
3 A CONCEPTUAL OVERVIEW
OF MACHINE LEARNING
CLASSIFIERS
Remote sensing classification results dependent on
many factors such as suitable classifier, selection of
training data, image preprocessing, feature extraction,
accuracy assessment, the user’s need, size of the study
area, and analyst’s skills. Our contribution is to stress
the impact of machine learning methods used to clas-
sify HSI. Many studies have been carried out to in-
vestigate the performance of classifiers for different
remotely sensed data sets and their results in terms of
accuracy.

Table 1: public available Hyperspectral Remote Sensing datasets
Dataset Classes Labels Bands Pixels Mode
Indian Pines 16 10249 224 21025 Aerial
Pavia 9 50232 103 991040 Aerial
Botswana 14 3248 145 377856 Satellite
Salinas 16 54129 227 111104 Aerial
KSC 13 5211 176 314368 Aerial
3.1 Supervised Algorithms
SVM classification: SVMs were initially designed to
identify a linear class boundary (i.e., a hyperplane).
The SVM classifier is binary, used to identify a sin-
gle boundary between two classes. However, this
problem is handled by applying the classifier to each
possible cluster combination, which means that pro-
cessing time is expected to increase exponentially as
the number of clusters rises (Usha and Vasuki, 2018;
Yang et al., 2019). Decision Tree classification: DTs
are one of the simplest classifiers. A DT is a recur-
sive division of input data (Salehi et al., 2017). In a
classification tree, leaf values constitute classes, leaf
values represent a continuous variable. One of DTs
advantages,is that the logic of the model can be eas-
ily visualized at the end of the classification process.
DTs can use categorical data, and once the model is
completed, classification is extremely fast because no
other complex mathematics is required (Salehi et al.,
2017; Maxwell et al., 2018). Random Forest classifi-
cation: RF is an ensemble classifier because it uses a
large number of DTs to overcome the weaknesses of a
single DT (Jeon and Kim, 2018). The majority ”vote”
of all trees is used to assign a final class to each un-
known. This directly overcomes the problem that a
single tree is not optimal, but by incorporating sev-
eral trees, an overall optimum should be obtained. A
particular advantage of RF is that due to the presence
of several trees, it is not necessary to prune individ-
ual trees. A disadvantage is that by having several
trees, the possibility of viewing the trees is effectively
reduced (Jeon and Kim, 2018). k-NN classification:
The k-NN classifier is different from other classifiers.
It is an instance-based classifier based on compar-
ing the similarity between each unknown sample with
the original training data(Tan et al., 2019). The un-
known sample is attributed to one of the k predeter-
mine classes of the training samples containing sim-
ilar features to the unknown sample. A low number
of classes (k) will, therefore, provide a very compli-
cated decision boundary, while a higher k values will
Table 2: Classification results using Indian pines dataset
(Maxwell et al., 2018).
Algorithm Overall Kappa
accuracy(%) accuracy(%)
SVM 89,1 0,844
DT 78,3 0,687
RF 87,1 0,814
ANN 85,1 0,787
K-NN 78,6 0,686
lead to greater generalization. Since no trained model
is produced, the k-NN classification is expected to re-
quire more resources as the number of training sam-
ples expands. ANNs classification: ANNs are gener-
ally conceptualized as a mathematical analog of the
axons of an animal brain and their many intercon-
nections through synapses (Chlingaryan et al., 2018).
The elements of an ANN are layered neurons (equiva-
lent to biological axons). An ANN has minimal input
and output layers, with one neuron for each input vari-
able and one neuron for each output class. In addition,
ANNs usually have hidden nodes arranged in one or
more additional layers. One of the main challenges of
applying ANN classifiers is the training process that
can be time and resources consuming and can pro-
duce non-optimal or overfitted models. In this sec-
tion, we have summarized the algorithms of machine
learning that are often used for the classification of
remote sensing images. (Table II) gives an overview
of the results obtained using the Indian pines dataset,
and it can be seen that the SVM has performed well.
3.2 Unsupervised Algorithms
In recent years, unsupervised feature learning algo-
rithms has become an interesting alternative to the tra-
ditional methods used for feature extraction and has
made significant progress in the classification of re-
mote sensing images (Ragettli et al., 2018). By learn-
ing features from images rather than relying on man-
ually engineered features, we can obtain more dis-
criminating features and better fitted to the problem
at hand.
The principal component analysis (PCA) (Kang
et al., 2019) and k-means clustering (Ratnakumar and
Nanda, 2019) are considered to be two of the most
popular unsupervised feature learning methods.
PCA could be considered as the first unsupervised
feature extraction algorithm that attempts to find an
optimal representative projection matrix (need refer-
ence), and it is widely used to reduce the size of
satellite images (multispec-tral/hyperspectral) (Zhang
et al., 2019). Some extensions of PCA have also been
introduced in the literature, such as PCANet (Zhang
et al., 2019) and sparse PCA.
K-Means Clustering: The k-means clustering is a
method of vector quantization that aims to divide a
collection of data items into k clusters (Ratnakumar
and Nanda, 2019).
3.3 Selection of a Machine-learning
Classifier
Selecting the appropriate classifier for Multispectral
or hyperspectral data is a challenging assignment be-
cause of the large variety of machine-learning tech-
niques. In addition, the existing literature seems to
be unstructured and inconsistent concerning the de-
gree of effectiveness of existing algorithms. For in-
stance, the work presented in (Kang et al., 2019) has
concluded that SVM and Random forest (RF) algo-
rithms have similar performance in terms of accuracy
using the RapidEye satellite imagery data set, while
the authors of (Chlingaryan et al., 2018) found that
(SVM) outstripped (RF) and (KNN) using the same
data set. This contradiction in classification results
could be explained by the different procedures used
in both studies, according to (Zhao and Du, 2016).
In (Elmasry et al., 2012), authors compared the per-
formance of a wide range of machine-learning clas-
sification algorithms, using standardized procedures
and 30 different datasets from Landsat, Ikonos, and
Probe-1 satellites on different dates. They found that
(RF) had the highest average classification accuracy
of 73.19% , which was significantly better than that
obtained by SVM (62.28%). Even though RF was
the most efficient classifier for 18 of the 30 datasets,
it was not always the most accurate classifier. In the
same context, the authors of (Usha and Vasuki, 2018)
compared (SVM) and (RF) with 1-D Convolutional
Neural Network (CNN) architecture using hyperspec-
tral imagery of the San Francisco Bay Area, Cali-
fornia, for the year 2015. The models were trained
to classify data under three different seasons of the
year (spring, summer, fall). All analyses were com-
pleted using simulated hyperspectral infrared imaging
(HyspIRI) for the aim of land cover mapping. The ob-
tained results showed that the overall classification ac-
curacy of the CNN architecture reached 89.9%, which
is similar to that obtained by SVM 89.5%. The re-
sults also showed that the SVM exceeded the RF by
an overall accuracy of more than 7%. In the previous
case studies, the authors showed the most appropri-
ate classification algorithms that were used with sev-
eral datasets and yielded different results depending
on user requirements.
3.4 Other Useful Applications of
Machine Learning Methods in
Remote-sensing
Machine learning methods are not limited to clas-
sification processes. Many algorithms are also em-
ployed for regression. For example, Tree canopy
density data were generated using a regression tree
method, based on the DT algorithm . The SVM
can also be used for regression, known as support
vector regression (SVR). For instance, (Wang et al.,
2011) used this method for predicting water qual-
ity, chemical variables from the SPOT-5 data set and
stated that SVR achieved a result better than multiple
linear regression. For the prediction of biophysical
parameters,(Camps-Valls et al., 2006) found that the
implementation of an SVR outperformed regression
using ANNs.(Mountrakis et al., 2011) also noted the
value of SVR for predicting chlorophyll content, leaf
area, and vegetation cover from hyperspectral data.
Machine learning has also been used for probabilistic
predictions in remote sensing. For example,(Maxwell
et al., 2016) used RF to forecast the topographic prob-
ability of wetlands based on terrain features (Moun-
trakis et al., 2011).
3.5 Deep Learning Methods
Most of the current state-of-the-art approaches gener-
ally rely on supervised learning to obtain good feature
representations. The past decade has witnessed an im-
portant growth in using and developing deep learning
algorithms. It has become a trend in big data analysis
and many computer vision tasks, e.g., image classi-
fication, object detection, and natural language pro-
cessing. It gave birth to a new perspective in the re-
mote sensing field when it has been introduced as a
promising method to classify HSI data that has been
used in various studies and provided accurate results.
Therefore, we can anticipate that the topic will
be further explored, and more and more research
works will be published in the next several years.
Since then, several attempts have been made to re-
place hand-engineered features with trainable multi-
layer networks, and some deep learning models have
shown impressive feature representation capability
for a wide range of applications, including remote
sensing images classification (Paoletti et al., 2019)
(Kussul et al., 2017) (Elnagar et al., 2020).
In comparison with traditional features extraction
methods that require a considerable amount of en-
gineering skill and domain expertise, Deep learn-
ing features are automatically learned from data us-
ing a general-purpose learning procedure via deep-
architecture neural networks, which represents the
key advantage of deep learning methods. On the other
hand, compared with aforementioned unsupervised
feature learning methods that are generally weakly
structured models (e.g., sparse coding), deep learning
models that are composed of multiple processing lay-
ers can learn more powerful feature representations of
data with multiple levels of abstraction (Kang et al.,
2019). In addition, deep feature learning methods can
automatically extract features from complex hyper-
spectral data and can effectively deal with the problem
of the large variability of spectral signature. However,
the types of features extracted from deep networks are
various, e.g., spectral, spatial, and spectral-spatial fea-
tures, which makes deep learning more suitable for
the varieties of situations.
In the existing literature, a number of deep learn-
ing models have been proposed, such as Recurrent
Neural Network (RNN), Stacked Autoencoder (SAE),
and Convolutional Neural Networks (CNNs), (Pao-
letti et al., 2019) (Kussul et al., 2017) (Liu et al.,
2019). Several authors have attempted to give a gen-
eral review of current advances deep learning tech-
niques for hyperspectral images. For instance, (Liu
et al., 2019) listed the most popular deep learning-
based algorithms used in the hyperspectral data clas-
sification and underlined their ability to deal with
a restricted number of training samples and high-
dimensional data. Among those approaches, we can
cite the widely used CNN-based classifiers. Here we
mainly focus on CNN since it is the most used al-
gorithm in HSI classification. CNNs are designed to
process data that come in the form of multiple ar-
rays, for example, a multispectral image composed
of multiple 2-D arrays containing pixel intensities in
the multiple band channels. The learning process of
CNNs is computationally efficient and insensitive to
data changes. In remote sensing studies, 2D CNNs
(Figure 1) have been widely used to extract spatial
features from the dimensions of width and height for
object detection and semantic segmentation of high-
resolution images (He and Chen, 2019). the Hyper-
spectral image classification is another application of
CNNs, in which CNN’s were used to extract spatial-
spectral features, through either 1D-convolution with
spectral features, 2D-convolution with spatial fea-
tures, or 3D-convolution with a combination of spec-
tral and spatial features (Bhosle and Musande, 2019).
(Zhu et al., 2019) found that 2D-convolution pro-
vides an accurate result in crop classification than
1D-convolution. (Goodfellow et al., 2016) combined
hyperspectral images from three seasons and applied
1D-convolution for land cover classification. In these
studies, convolutional layers in CNNs used mostly to
extract spatial or spectral features.
4 SUMMARY
The classification of remotely sensed data has made
significant progress over the past years. Many fac-
tors, such as the spatial resolution of the remotely
sensed data, different data sources, and the classifi-
cation system must be considered when choosing a
classification method to use. Various classification
methods have their own merits. It is not easy to an-
swer the question of which classification method is
suitable for a specific study. For a particular study, it
is often difficult to identify the most suitable classifier
due to the lack of guidelines in the literature for the se-
lection of appropriate classification algorithms. Also,
the combination of different classification approaches
has proven to be useful in improving the accuracy of
classification (Maxwell et al., 2018). Our objective
was to propose a short review of the academic litera-
ture to provide some practical considerations for the
implementation of machine learning classification in
remote sensing data. We suggest that the following
points should be highlighted .
• SVM, RF, and enhanced DTs have proven to be
very effective methods for classifying remotely
sensed data and, in general, these methods seem
to produce high overall accuracies compared to
other machine classifiers such as simple DTs and
k-NN. However, the best algorithm for a specific
task may be case-specific and may depend on the
classes mapped, the nature of the training data,
and the predictive variables provided.
• the quality of training data, generally, have a sig-
nificant impact on the accuracy of classification.
The training data may even have more impact than
the algorithm used. Therefore, it is better to obtain
a large number of high-quality training samples
that fully characterize the class signatures. How-
ever, there are practical limitations to collect large
training samples. If the training sample is small
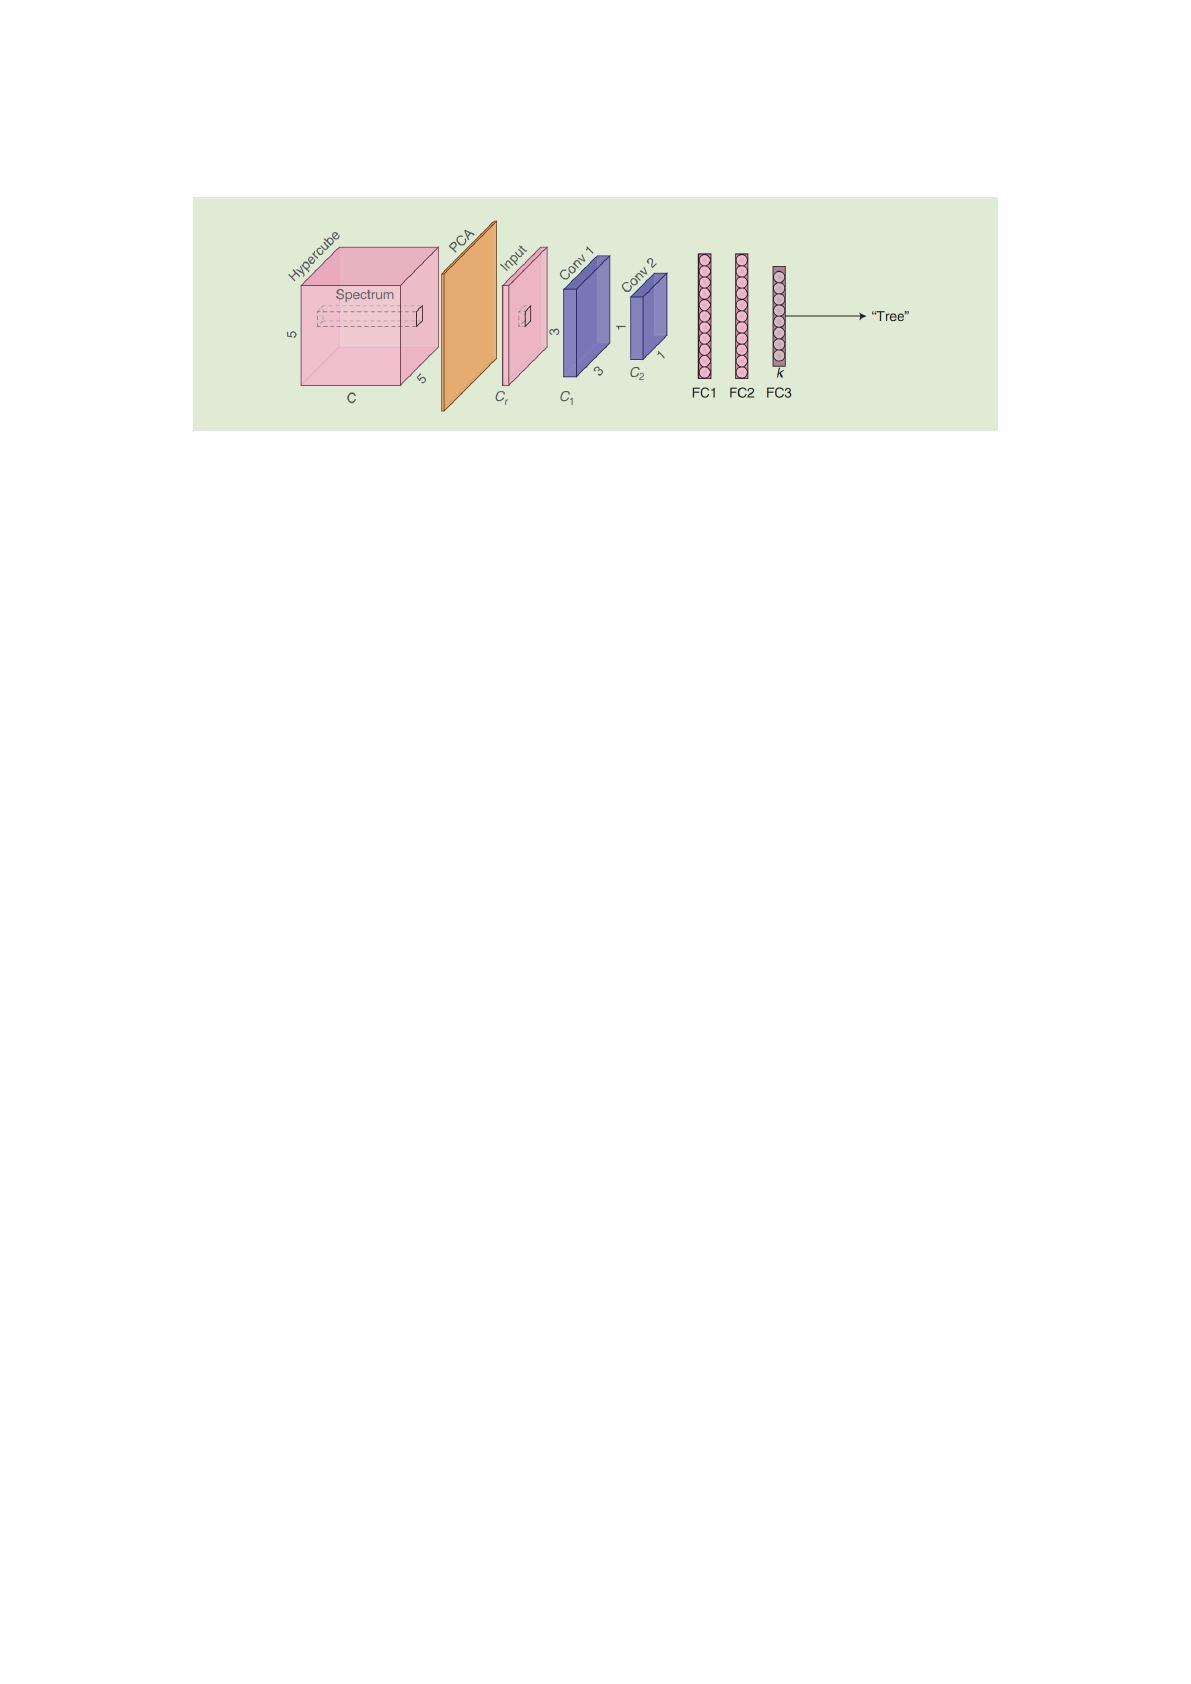
Figure 1: The general 2D CNN architechture for classification of hyperspectral data (Makantasis et al., 2015). Conv: convo-
lution; FC: fully connected.
in number, or if the data quality is ambiguous, an
algorithm that is robust to these problems must be
used, such as the DT methods.
• The accuracy of the classification may be affected
by the imbalance in training data. In general,
overall accuracy may not decrease significantly
due to imbalance.
• The three input dimensions (spatial, spectral, and
temporal) have an impact on the accuracy of crop
mapping, individually or in combination. An in-
crease in one of the dimensions increases the ac-
curacy of mapping. Each dimension plays an im-
portant role and contributes significantly to the
output. From the spatial dimension to the spec-
tral dimension, from the spectral dimension to the
temporal dimension.
• Deep learning techniques, including deep neural
networks, have already revealed a great promise in
the field of remote sensing, and the implementa-
tions have been made available in software pack-
ages such as MATLAB, R, and scikit-learn.
5 CONCLUSIONS
Earth Observation (EO) sensors are a source of infor-
mative data covering the whole globe in spatial and
spectral resolution for better and easier land cover
classification. They are becoming increasingly attrac-
tive as an effective alternative to traditional or conven-
tional methods, and the last years have witnessed a re-
markable increase in the use of these technologies in
the field of crop mapping or identification. Due to the
variable nature of the landscape and multiple sensors,
classification techniques also play an essential role in
the accuracy of crop mapping for multispectral to hy-
perspectral data. Indeed, in recent years, many clas-
sification machine learning algorithms (supervised or
unsupervised) have been used in crop mapping. To
implement appropriate methods for HSI classifica-
tion, several other factors need to be considered to
overcome the problems of pixel size and various char-
acteristics to outperform one technique over another.
Therefore, it is necessary to know the input data di-
mensions, types of remotely sensed data, and appro-
priate classifiers implemented.
ACKNOWLEDGEMENTS
This work is part of the Multispectral satellite
imagery, data mining and agricultural applications
project, funded by the academy Hassan II of Science
and Technology.
REFERENCES
Bhosle, K. and Musande, V. (2019). Evaluation of deep
learning cnn model for land use land cover classifi-
cation and crop identification using hyperspectral re-
mote sensing images. Journal of the Indian Society of
Remote Sensing, 47(11):1949–1958.
Camps-Valls, G., Bruzzone, L., Rojo-Alvarez, J. L., and
Melgani, F. (2006). Robust support vector regres-
sion for biophysical variable estimation from remotely
sensed images. IEEE Geoscience and remote sensing
letters, 3(3):339–343.
Chlingaryan, A., Sukkarieh, S., and Whelan, B. (2018). Ma-
chine learning approaches for crop yield prediction
and nitrogen status estimation in precision agriculture:
A review. Computers and electronics in agriculture,
151:61–69.
Dou, P., Chen, Y., and Yue, H. (2018). Remote-sensing
imagery classification using multiple classification
algorithm-based adaboost. International Journal of
Remote Sensing, 39(3):619–639.
El Mansouri, L., Hadria, R., Lahmer, I., Moutaib, O., Ou-
jemaa, A., and ElGorch, A. (2018). Technologies
géo-spatiales pour renforcer les dispositifs de gestion
des terres agricoles: Appui à la gestion des surfaces
agrumicoles par télédétection dans la plaine de triffa-
berkane (maroc). African Journal on Land Policy and
Geospatial Sciences, 1(3):164–177.
El Mansouri, L., Lahssini, S., Hadria, R., Eddaif, N., Ben-
abdelouahab, T., and Dakir, A. (2019). Time series
multispectral images processing for crops and forest
mapping: two moroccan cases. In Geospatial Tech-
nologies for Effective Land Governance, pages 83–
106. IGI Global.
Elmasry, G., Kamruzzaman, M., Sun, D.-W., and Allen, P.
(2012). Principles and applications of hyperspectral
imaging in quality evaluation of agro-food products: a
review. Critical reviews in food science and nutrition,
52(11):999–1023.
Elnagar, A., Al-Debsi, R., and Einea, O. (2020). Arabic text
classification using deep learning models. Information
Processing & Management, 57(1):102121.
Goodfellow, I., Bengio, Y., Courville, A., and Bengio, Y.
(2016). Deep learning, volume 1. MIT press Cam-
bridge.
He, X. and Chen, Y. (2019). Optimized input for cnn-based
hyperspectral image classification using spatial trans-
former network. IEEE Geoscience and Remote Sens-
ing Letters, 16(12):1884–1888.
Jeon, W. and Kim, Y. (2018). An assessment of a ran-
dom forest classifier for a crop classification using air-
borne hyperspectral imagery. 대원사지,
34(1):141–150.
Kang, X., Zhuo, B., and Duan, P. (2019). Semi-supervised
deep learning for hyperspectral image classification.
Remote Sensing Letters, 10(4):353–362.
Khan, M. J., Khan, H. S., Yousaf, A., Khurshid, K., and Ab-
bas, A. (2018). Modern trends in hyperspectral image
analysis: a review. IEEE Access, 6:14118–14129.
Kussul, N., Lavreniuk, M., Skakun, S., and Shelestov, A.
(2017). Deep learning classification of land cover and
crop types using remote sensing data. IEEE Geo-
science and Remote Sensing Letters, 14(5):778–782.
Lira Melo de Oliveira Santos, C., Augusto Camargo Lam-
parelli, R., Kelly Dantas Araújo Figueiredo, G.,
Dupuy, S., Boury, J., Luciano, A. C. d. S., Torres,
R. d. S., and Le Maire, G. (2019). Classification of
crops, pastures, and tree plantations along the season
with multi-sensor image time series in a subtropical
agricultural region. Remote Sensing, 11(3):334.
Liu, Y., Zhou, S., Han, W., Liu, W., Qiu, Z., and Li, C.
(2019). Convolutional neural network for hyperspec-
tral data analysis and effective wavelengths selection.
Analytica Chimica Acta, 1086:46–54.
Lu, D., Weng, Q., Moran, E., Li, G., and Hetrick, S.
(2011). Remote sensing image classification. CRC
Press/Taylor and Francis: Boca Raton, FL, USA.
Makantasis, K., Karantzalos, K., Doulamis, A., and
Doulamis, N. (2015). Deep supervised learning
for hyperspectral data classification through convo-
lutional neural networks. In 2015 IEEE Interna-
tional Geoscience and Remote Sensing Symposium
(IGARSS), pages 4959–4962. IEEE.
Maxwell, A. E., Warner, T. A., and Fang, F. (2018). Im-
plementation of machine-learning classification in re-
mote sensing: An applied review. International Jour-
nal of Remote Sensing, 39(9):2784–2817.
Maxwell, A. E., Warner, T. A., and Strager, M. P. (2016).
Predicting palustrine wetland probability using ran-
dom forest machine learning and digital elevation
data-derived terrain variables. Photogrammetric En-
gineering & Remote Sensing, 82(6):437–447.
Mountrakis, G., Im, J., and Ogole, C. (2011). Support
vector machines in remote sensing: A review. IS-
PRS Journal of Photogrammetry and Remote Sensing,
66(3):247–259.
Orynbaikyzy, A., Gessner, U., and Conrad, C. (2019). Crop
type classification using a combination of optical and
radar remote sensing data: a review. international
journal of remote sensing, 40(17):6553–6595.
Pandey, P. C., Koutsias, N., Petropoulos, G. P., Srivastava,
P. K., and Ben Dor, E. (2019). Land use/land cover in
view of earth observation: data sources, input dimen-
sions, and classifiers—a review of the state of the art.
Geocarto International, pages 1–32.
Paoletti, M., Haut, J., Plaza, J., and Plaza, A. (2019). Deep
learning classifiers for hyperspectral imaging: A re-
view. ISPRS Journal of Photogrammetry and Remote
Sensing, 158:279–317.
Quinn, J. A., Nyhan, M. M., Navarro, C., Coluccia, D.,
Bromley, L., and Luengo-Oroz, M. (2018). Human-
itarian applications of machine learning with remote-
sensing data: review and case study in refugee set-
tlement mapping. Philosophical Transactions of the
Royal Society A: Mathematical, Physical and Engi-
neering Sciences, 376(2128):20170363.
Ragettli, S., Herberz, T., and Siegfried, T. (2018). An un-
supervised classification algorithm for multi-temporal
irrigated area mapping in central asia. Remote Sens-
ing, 10(11):1823.
Ratnakumar, R. and Nanda, S. J. (2019). A low complexity
hardware architecture of k-means algorithm for real-
time satellite image segmentation. Multimedia Tools
and Applications, 78(9):11949–11981.
Reshma, S. and Veni, S. (2017). Comparative analysis
of classification techniques for crop classification us-
ing airborne hyperspectral data. In 2017 Interna-
tional Conference on Wireless Communications, Sig-
nal Processing and Networking (WiSPNET), pages
2272–2276. IEEE.
Sahoo, R. N., Ray, S., and Manjunath, K. (2015). Hyper-
spectral remote sensing of agriculture. Current Sci-
ence, pages 848–859.
Salehi, B., Daneshfar, B., and Davidson, A. M. (2017). Ac-
curate crop-type classification using multi-temporal
optical and multi-polarization sar data in an object-
based image analysis framework. International Jour-
nal of Remote Sensing, 38(14):4130–4155.
Siachalou, S., Mallinis, G., and Tsakiri-Strati, M. (2017).
Analysis of time-series spectral index data to enhance
crop identification over a mediterranean rural land-
scape. IEEE Geoscience and Remote Sensing Letters,
14(9):1508–1512.
Signoroni, A., Savardi, M., Baronio, A., and Benini, S.
(2019). Deep learning meets hyperspectral image
analysis: a multidisciplinary review. Journal of Imag-
ing, 5(5):52.
Sitokonstantinou, V., Papoutsis, I., Kontoes, C., Lafarga Ar-
nal, A., Armesto Andrés, A. P., and Garraza Zurbano,
J. A. (2018). Scalable parcel-based crop identifica-
tion scheme using sentinel-2 data time-series for the
monitoring of the common agricultural policy. Remote
Sensing, 10(6):911.
Tan, K., Zhang, Y., Wang, X., and Chen, Y. (2019). Object-
based change detection using multiple classifiers and
multi-scale uncertainty analysis. Remote Sensing,
11(3):359.
Usha, S. G. A. and Vasuki, S. (2018). Improved segmen-
tation and change detection of multi-spectral satel-
lite imagery using graph cut based clustering and
multiclass svm. Multimedia Tools and Applications,
77(12):15353–15383.
Wang, X., Fu, L., and He, C. (2011). Applying support vec-
tor regression to water quality modelling by remote
sensing data. International journal of remote sensing,
32(23):8615–8627.
Xia, W., Ma, C., Liu, J., Liu, S., Chen, F., Yang, Z., and
Duan, J. (2019). High-resolution remote sensing im-
agery classification of imbalanced data using multi-
stage sampling method and deep neural networks. Re-
mote Sensing, 11(21):2523.
Yang, L., Mansaray, L. R., Huang, J., and Wang, L. (2019).
Optimal segmentation scale parameter, feature sub-
set and classification algorithm for geographic object-
based crop recognition using multisource satellite im-
agery. Remote Sensing, 11(5):514.
Zhang, L., Su, H., and Shen, J. (2019). Hyperspectral di-
mensionality reduction based on multiscale superpix-
elwise kernel principal component analysis. Remote
Sensing, 11(10):1219.
Zhao, W. and Du, S. (2016). Spectral–spatial feature ex-
traction for hyperspectral image classification: A di-
mension reduction and deep learning approach. IEEE
Transactions on Geoscience and Remote Sensing,
54(8):4544–4554.
Zhu, K., Chen, Y., Ghamisi, P., Jia, X., and Benediktsson, J.
(2019). Deep Convolutional Capsule Network for Hy-
perspectral Image Spectral and Spectral-Spatial Clas-
sification. Remote Sensing, 11:223.
