
Real-time Drowsiness Detection and Emergency Parking using EEG
Asim Javed, Muhammad Umair Arshad, Ehtesham Saeed and Noman Naseer
Department of Mechatronics Engineering and BioMedical, Air University, Islamabad, Pakistan
Keywords: Electroencephalography, Emergency Parking, Principal Component Analysis, KNN, Drowsiness Detection.
Abstract: This paper presents a comprehensive method to prepare a highly accurate and efficient classification model
to detect drivers drowsiness and a parking system for parking the car along the emergency lane. Vehicle
accidents are rapidly increasing in many countries. *One of the most demanding technologies for the active
prevention of such fatal road accidents are drowsiness monitoring systems since drowsiness is the leading
cause of severe road accidents on motorways and highways. EEG is direct and effective, it directly measures
the change in the brain’s electrical activity compared to techniques of image processing, which are indirect in
approach. The EEG signals, recorded from ten healthy subjects under the state of drowsiness playing a car
simulator and were given the feel like they were driving a car. As a proof of concept, a scaled car based on
computer vision would shift to autonomous mode on detection of the drowsy state of the driver. The EEG
system detects drowsiness with an accuracy of 96.8%. The autonomous system is also able to process 50-60
frames per second and gives decision accordingly. The turning angle for the scaled autonomous car ranges
between 0 to 30 degrees.
1 INTRODUCTION
Brain-Computer Interface (BCI) is an emerging tech-
nique that has made possible the communication be-
tween a subject’s brain and an external device. The
main idea is capturing the neuro signals of a person,
which are the variations in voltages. The
electroencephalography (EEG) based BCI has two
techniques invasive and noninvasive. Invasive
methods involve the insertion of electrodes into the
subject’s cranium, also called intracranial electrodes.
The noninvasive techniques do not require such
intrusions such that the electrodes are placed over the
scalp. In the beginning, the researchers of BCI
worked mostly in critical applications such as
immediate control. Later on, they expanded their
research, focusing on paralyzed patients’ applications
such as chess playing through brain control. Within
the past decade, modern machine learning and signal
processing techniques have led to a rapid increase of
brain-related applications, including communication,
prosthetic control, robotics, and security. A crucial
and essential area considered by most researchers is
the safety of people, with a significant focus on
making their daily activities safer. Human error is one
of the fatal cases and has led to more significant
casualties. The BCI researchers believe human-safety
to be a potent area for work.
A traffic accident, also known as Motor Vehicle
Collison (MVC) due to a human error, may result in
severe injury, property damage and even death. Non-
human factors can also contribute to the risk of
accidents, such as vehicle design, road design, or
some natural cause, but human-caused factors such as
lack of concentration, decision-making skills, and
abilities, using drug drowsiness plays a significant
role in fatal collisions. A 1985 published study for
auto accidents believes that recklessness, drunken-
ness, and other human factors add up to almost 93 %
of road crashes. Some typical driver’s impairments
include alcohol, physical impairment, distraction,
drug use, drowsiness, and combinations. Falling
asleep suddenly due to some sleep disorder or fatigue
can lead to losing the car control ending up in an
accident. National Highway Traffic Safety
Administration (NHTSA) reports that 100,000 yearly
vehicle crashes recorded are the direct result of the
driver’s drowsiness, resulting in 1550 deaths, 71000
injured (Wei et al., 2018). These numbers show that
the drowsiness of a driver is a primary concern
leading to road accidents.
Many methods were employed to prevent acci-
dents caused by the drowsiness of a driver. However,
308
Javed, A., Arshad, M., Saeed, E. and Naseer, N.
Real-time Drowsiness Detection and Emergency Parking using EEG.
DOI: 10.5220/0010370703080316
In Proceedings of the International Conference on Health Informatics, Medical, Biological Engineering, and Pharmaceutical (HIMBEP 2020), pages 308-316
ISBN: 978-989-758-500-5
Copyright
c
2021 by SCITEPRESS – Science and Technology Publications, Lda. All rights reserved

electroencephalogram (EEG) led to a new research-
able area. The EEG can be used to process almost all
sorts of physical or behavioural activities. Also, EEG
can report a person’s central nervous system activity
through a driving task and evaluate the consciousness
and attention levels to prevent the possible risk. The
following technique is non-invasive and requires the
electrodes placing on the scalp.
An electroencephalography-based sleepiness
detection system (ESDS) evaluates a subject’s
drowsiness range through brain activity. The main
focus of ESDS research is to inhibit sleepiness-related
accidents. (Balandong et al., 2018). EEG is primarily
used to monitor the variations of brain neuro activity
linked with drowsiness because signal changes in
some EEG frequency bands depends on an
individuals concentration. Most existing systems rely
on multi-channel EEG devices, which are expensive
and they require gel for conductivity. A cost- efficient
method is proposed in this research. Single-
channelled NeuroSky dry EEG headset which has the
ability to obtain brain signals as 512Hz sampling rate.
It uses SVM to detect drowsiness for training (Song
et al., 2017). During the activity of drowsiness and
awake states, the relative power of different EEG
bands differ and thus provide important information,
they can be used as features. Frontal, temporal and
parietal regions of the brain show sensitivity to
drowsiness. The EEG headset electrodes Fp1 and O1
must be considered during the study of drowsiness.
(Majumder et al., 2019) The above mentioned papers
suggests how effective electroencephalography can
turn out to be for sleep detection.
Kulkarni, developed a method to detect vehicles
on road using low cost raspberry pi and camera. The
proposed method uses background subtraction
method (Kulkarni and Baligar, 2020) Choudhury,
pro- posed a method to detect cars on the road
efficiently using Haar Cascade, for that two types of
samples shall be required positive and negative; the
positive samples will have the images of cars, and the
negative will have environment samples photos that
car may see on the road. We have employed this
technique in our object detection algorithm.
(Choudhury et al., 2017). Stevan Stevic´, propose an
algorithm for detecting road lanes using Hough
transform and performs and share field testing results,
however Hough trans- form doesn’t work efficiently
on curved lanes (Stevic´ et al., 2020). For this Project,
drowsiness detection is further followed by
emergency parking of the car. Some researches show
a few methodologies related to the performance of
this task, including lane detection. Wu et al. have
proposed a emergency parking system. The system is
based on the spread of the lane markers close to the
vehicle, this helps in determination of the lane
markings (Wu et al., 2019).
Yang et al. have developed a method to detect
road lanes. The first method using SSID was applied
to detect vehicles after that a vehicle tracking method
was used to compute trajectory lines (Yang et al.,
2017). Kuo et al. conducted an image sensor
experiment on a 1/10 miniature car which
manoeuvred in a straight–curve–straight lane and
validated better processing performance before and
after the curves of lane. Within 5 per cent error, the
lane detection algorithm achieves lane detection and
cross track error in live situation, our system is
inspired by this paper for autonomous car parking
(Kuo et al., 2019). The above mentioned papers are
the proof that the introduction of camera in a car, can
lead to an efficient lane detection systems with
minimal cost.
Figure 1: General Block Diagram of Image Processing
SSH, also known as Secure Shell or Secure Socket
Shell, is a network protocol that gives users,
particularly system administrators, a secure way to
access a computer over an unsecured network. In
addition to providing secure network services, SSH
refers to the suite of utilities that implement the SSH
protocol. Secure Shell provides strong password
authentication and public key authentication, as well
as encrypted data communications between two
computers connecting over an open network, such as
the internet. In addition to providing strong
encryption, SSH is widely used by network
administrators for managing systems and applications
remotely, enabling them to log in to another computer
over a network, execute commands and move files
from one computer to an- other (Rouse, 2020).
Bablani et al. used KNN for EEG classification.
k-Nearest Neighbor classifier is a non-parametric ap-
proach, which classifies a given data point according
to then majority of its neighbors. The KNN algorithm
completes its execution in two steps, first finding the
number of nearest neighbors and second classifying
the data point into particular class using first step. It
chooses nearest k samples from the training set, then
takes majority vote of their class where k should be
an odd number to avoid ambiguity, KNN has been
employed in our system, because of it ability to deal
with non linear data effectively. (Bablani et al., 2018).
The past conducted experiments show that
drowsiness detection using an EEG headset is more
Real-time Drowsiness Detection and Emergency Parking using EEG
309
direct and effective than image processing. The data
is directly being taken from the brain, and there is a
low chance of error. The autonomous car uses state of
the art canny edge detection algorithm, which has
effective noise cancellation. The lane detection
algorithm proposed can also effectively follow the
straight and Curved lane. The algorithm is performing
better on curved lanes compared to algorithms based
on Hough transform. Owing to importance of the
issue a system has been proposed, this system should
detect drowsiness and fatigue accurately with near
perfection and then autonomously take over the car
and park it safely towards the emergency lane. The
parking system utilizes a computer vision-based lane
assistance sys- tem that detects road lane and then
changes lane to an emergency as soon as a car or an
obstacle comes ahead. The lane detection system can
detect curves. EEG data preprocessing involves
preprocessing, feature selection and classification.
Some previous re- searches were used to develop a
real-time system on drowsiness detection of a driver.
These researches are related to this Project either
directly or indirectly.
2 METHODOLOGY
The system has two phases and methodologies of
each are discussed below.
2.1 Drowsiness Detection
To study the effects of drowsiness, the EEG signals
are recorded, and several signals are preprocessed and
classified. Noise removal is done using a high pass
filter, less than 1 Hz as they can appear as offset; On
the basis of preprocessing the EEG signals are further
classified to primary waves using bandpass filters.
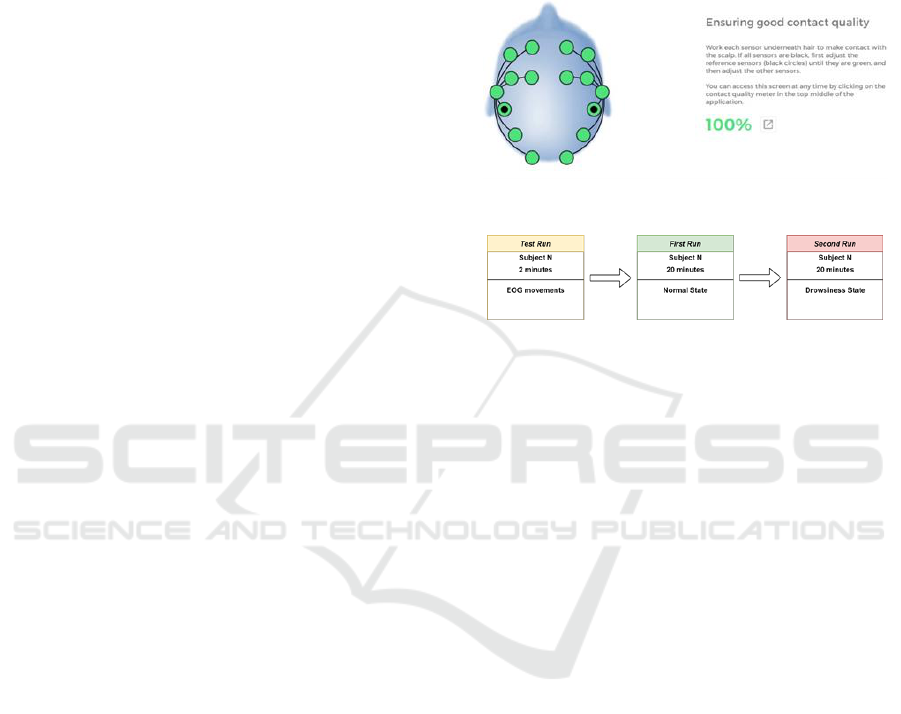
2.1.1 Data Recording
The EMOTIV EPOC+ headset when fixed on the
scalp of the subject, the EmotivBCI application dis-
plays feedback. The application is to assist the user in
fitting the headset correctly. The headset acquires
these signals, and this information is then transferred
to a computer via Bluetooth. For getting better results,
it is necessary to attain the best contact of sensors with
the scalp. When electrodes are placed red- orange and
green coloured circles are shown in the control panel
to show the engagement of electrodes with brain
surface. Once all the sensors on the control panel turn
green, a successful connection between the headset
and the subject has been established. Experiments
were performed, during which the Emotiv Epoc+ was
placed on the scalp to get the raw signals of a person’s
brain. The Emotiv Epoch has over 14 channels;
electrodes can get the data from these channels. The
electrodes consist of an assembly with felt pads
soaked into a saline solution that increases con-
ductivity. Thirteen healthy individuals participated in
Figure 2: Connection Status
Figure 3: Timing Scheme
An experiment; all the participants were students
of Air University. Before the experiment, all the
participants were asked to avoid any medicine or
coffee throughout the experiment. The participants
were healthy individuals and were asked to complete
their sleep before the experiment. The experiment had
two phases; the first phase, the subjects were sitting
comfortably on chairs; at the beginning of the trial,
for each subject, 2 minutes of test run was conducted
during which EOG movements were done as a test
trial. The first trial involved 20 minutes of active state
data from each subject. After recording the normal
state from each subject, the participants were asked to
join an overnight study program, such that they stayed
awake the whole night. The next day in the morning,
ten out of thirteen participants were declared drowsy
based on the Chalder fatigue scale. After the head-
sets’ placement, the ten participants were asked to
play an android car driving game. They were given
10 minutes duration to get themselves acquitted with
the controls. After that duration, subjects played the
game for 20 minutes each; the car control involved
steering the phone. Thus they were given the feel like
they were driving in real.
When people become fatigued and tired, they lose
focus and repeatedly regain the lost concentration;
such is a drowsy driver’s behaviour. Current studies
have revealed that when a person faces the loss of
concentration, there is an abrupt increase in alpha and
theta activity. A particular effect was also observed
HIMBEP 2020 - International Conference on Health Informatics, Medical, Biological Engineering, and Pharmaceutical
310
on the delta waves concentration. The waves
mentioned above predominately originated from the
occipital region during the normal and the wakeful
state. Thus, channel O1 was selected for drowsiness
detection. Thus this experiment involves getting data
from a single dominant channel.
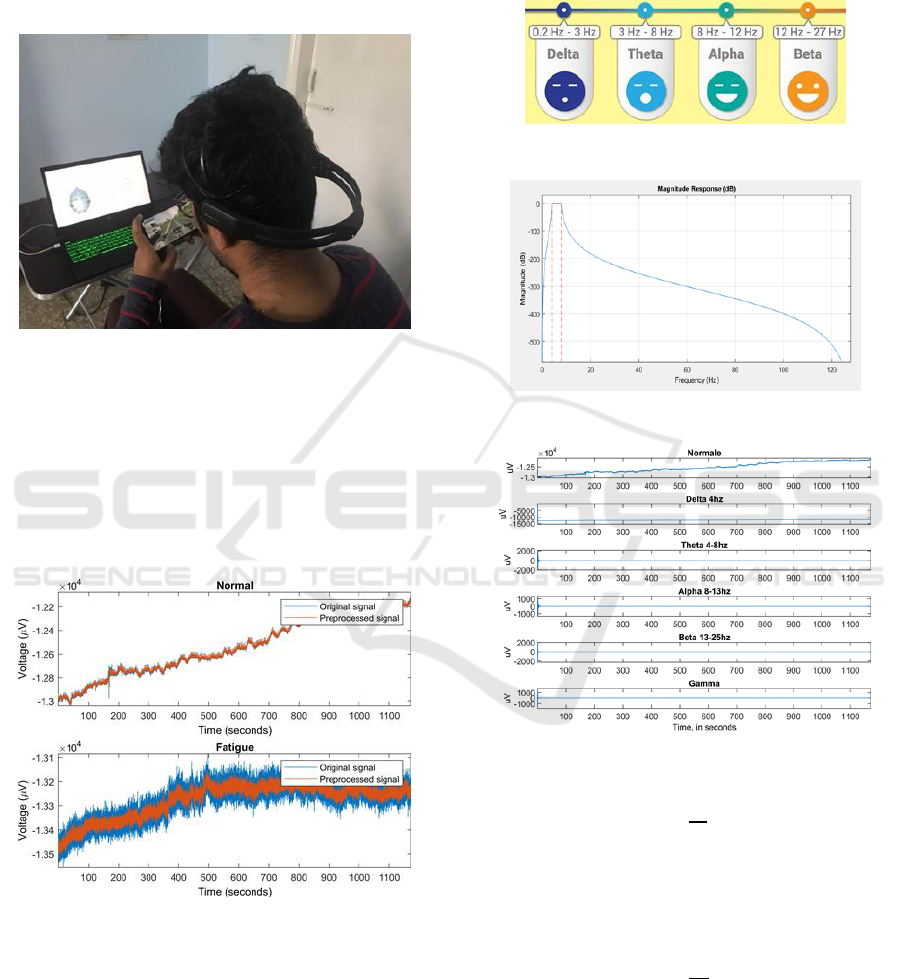
Figure 4: Data acquisition
2.1.2 Preprocessing and Feature Extraction
The raw data were first subjected to a median average
filter; it was observed that it is not affected by the
outlier values as much as the mean filter. The median
filter creates a series of average subsets of the whole
and thus smoothens the channel as shown in the figure
(5) below.
Figure 5: Median filter
Filter creation was necessary for obtaining the alpha,
beta, theta, gamma and delta waves. Figure (6) shows
the distinction between primary brain waves based on
frequency. A bandpassb filter of order eight was
designed with a passband ripple of 0.2. The passband
frequency was specified based on the respective
frequency. MATLAB’s function designfilt() was
used to generate the magnitude response of the filter,
as shown in figure (7), such that the following graphs,
as shown in figure (8) were obtained when the
bandpass filter was applied. Power of signal can be
expressed as
Figure 6: Brain primary waves
Figure 7: Magnitude Response
Figure 8: Filter Application on Normal data
(1)
Where V and R are voltage and resistance
respectively.
(2)
Where n is Time frame, N is Number of samples and
Fs is Sampling Frequency. To create features, power
obtained through (1) is integrated concerning time to
get energy, which further is converted into decibels
Real-time Drowsiness Detection and Emergency Parking using EEG
311
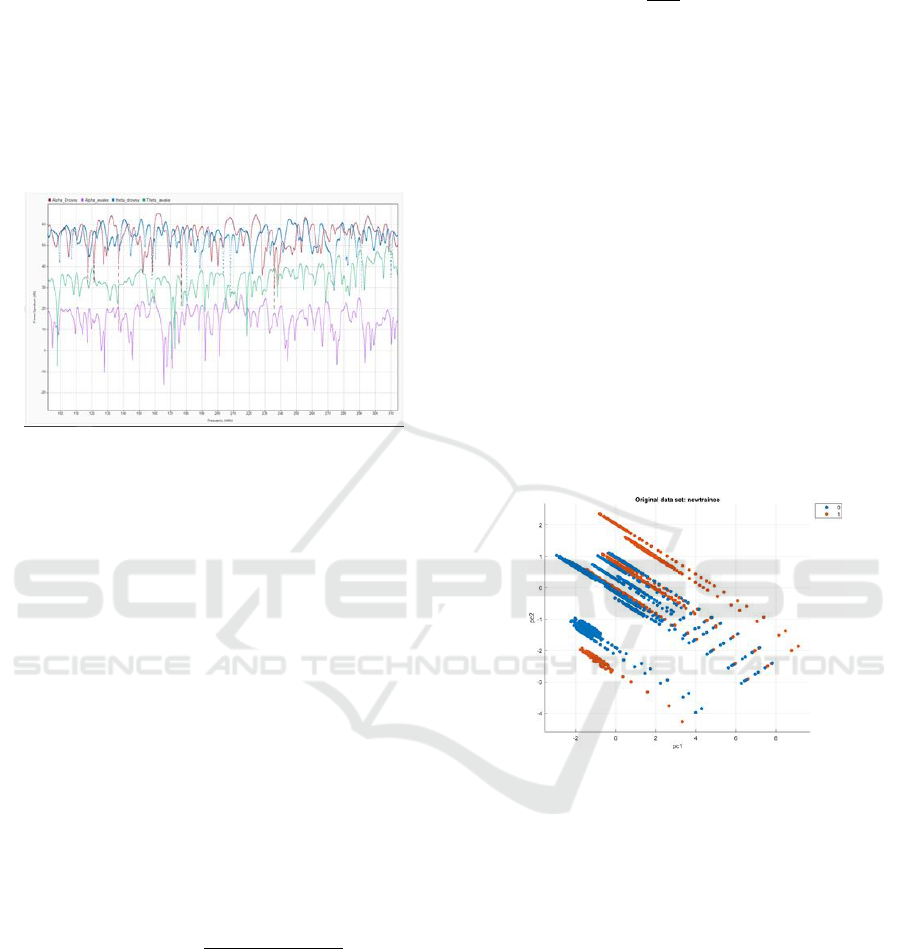
(dB) to get more distinct features. The graph shows
the spectral plot of alpha and theta waves both in the
state of drowsiness and awake. The graph concludes
that a sudden change occurs in alpha and theta power
bands when the subject goes from an awake state to
drowsy. This unprecedented change can be used as
features as it enough to tell about the subject’s state.
The data is then passed through principal component
analysis (PCA).
Figure 9: Spectral Analysis
Two components were taken; the first variance is 67
percent and the second coordinate is 17 percent. Thus
these two components are chosen, thus reducing the
chance of overfitting by providing a smaller model.
Hence, principal component analysis (PCA) aims to
determine new linearly independent components that
can efficiently represent data. It was performed as
follows. Data received through the above procedure
is subjected to feature scal- ing, standardization,
which is the Computation of transformed values by
computing the difference of each feature of value
from the mean of the feature’s values. Further
removal of outliers was performed as machine
learning algorithms are sensitive to distribution, and
the spread of any attribute value may result in
misleading the training process. The MATLAB
function isoutlier() checks for such data and marks
them as 0, are also negated from the data stream.
(3)
Features in a dataset often contain information
that is highly redundant such that they are highly
correlated. In order to identify such correlations, a
covariance matrix is computed. For two variables X
and Y, covariance matrix has the following formula.
(4)
The eigenvector is a characteristic non zero vector
that changes its value when multiplied by a scale
value, which is the eigenvalue. The eigenvalue is
represented by . Thus eigenvector of a matrix is for
which the following value holds.
Aυ = λυ
(5)
The eigenvectors are arranged according to their
eigenvalues, in decremental order. The new variables
formed due to the linear combination of the starting
features are not related but perpendicular to each
other in Cartesian space. The principal components
are arranged in order of rank of eigenvalues.
Figure (10) below is the scatter plot of the two
principal components that tell most about the data.
Figure 10: Scatter Plot of PCA Components
2.1.3 Classification
The classification algorithm used is K nearest mean
neighbour’s, also known as KNN. Cross-validation is
used, where k is known as the number of groups the
data will split up. A value of 5 was used for K such
that the model each time was trained on five random
sets, and 5 test sets from the aggregate data were
selected to test the model. Cross-validation makes sure
that the model is trained for every type of data. K fold
was preferred over holdout since its ability to make the
model more efficient and less sensitive to false negatives
and false positives. KNN has the following steps for
implementation; they are as follows.
•
Select the K neighbors
•
Using Euclidean distance using equation (6)
calculate the distance of a new point from the K
HIMBEP 2020 - International Conference on Health Informatics, Medical, Biological Engineering, and Pharmaceutical
312
neighbor
•
Calculate the data points in each category
among the neighbors that were computed in
step (ii)
•
The new data point is sent to the category where
the distance to neighbor is the least.
2.1.4 Euclidean Distance
(x
2
-x
1
)
2
-(y
2
-y
1
)
2
(6)
2.1.5 Pros of KNN
•
Easy Implementation
•
Flexible features
•
Easily handles multiple class labels
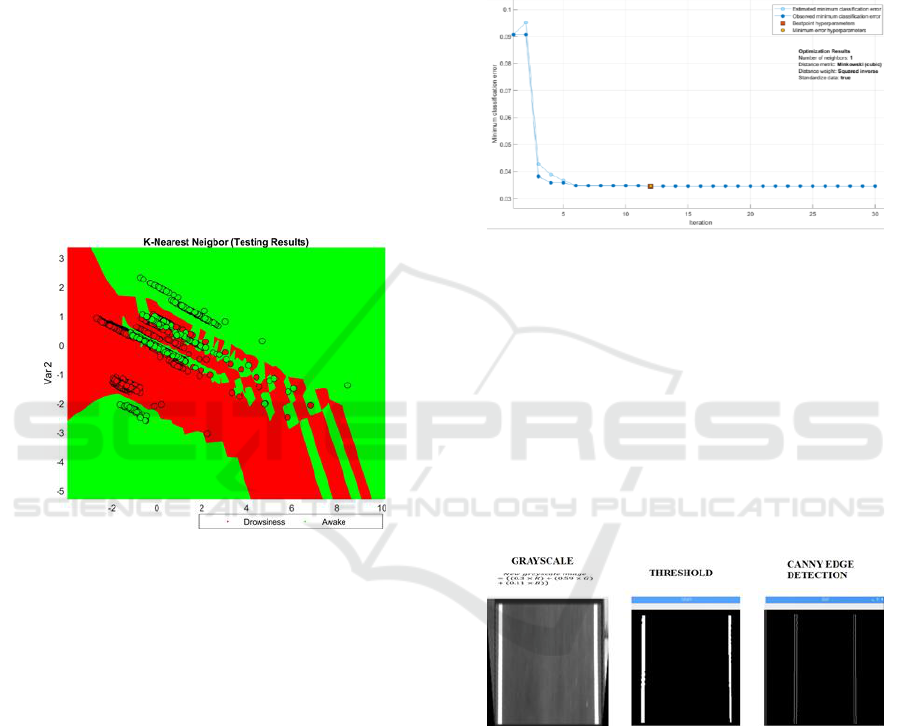
Figure 11: Classification of test set for first fold
The graph is shown above between two independent
variables, pc1 and pc2, the red area marks for
drowsiness and green marks for the awake state. The
bubbles in the graph represent the testing data. The
correct placement of these bubbles into the right area
shows that data is correctly classified with minimal
error.
2.1.6 Hyper Parameters Selection
To improve the model’s performance, a MATLAB
toolbox classification learner was used, which
resulted in optimized hyperparameters like the
number of neighbours, distant metric, and distant
weight.
2.2 Car Parking System
To have better results, Image Processing (Open CV)
was used for the lane following and car parking sys-
tem. After getting raw data that was in the form of
images, data was preprocessed. After the
preprocessing region of interest was selected
carefully. At turns, an error was used to steer the car
for lane following. Object detection was the primary
command to park the car immediately. The image
processing algorithm has three stages perception,
processing and output.
Figure 12: Hyperparameter Plot
2.2.1 Preprocessing
Raw Image is a matrix where each matrix member has
8-bit R, G and B values. In preprocessing smoothing
filter was applied such that the Image only contains
Black and white colour, so it reduces processing time.
After that, the Image was converted into a greyscale,
which improves accuracy. Region of interest ROI was
selected according to the car and track size. Thresh-
olding was applied to detect the lane, and canny edge
detection was used to detect the lane’s edges.
Figure 13: Pre Processing Stages
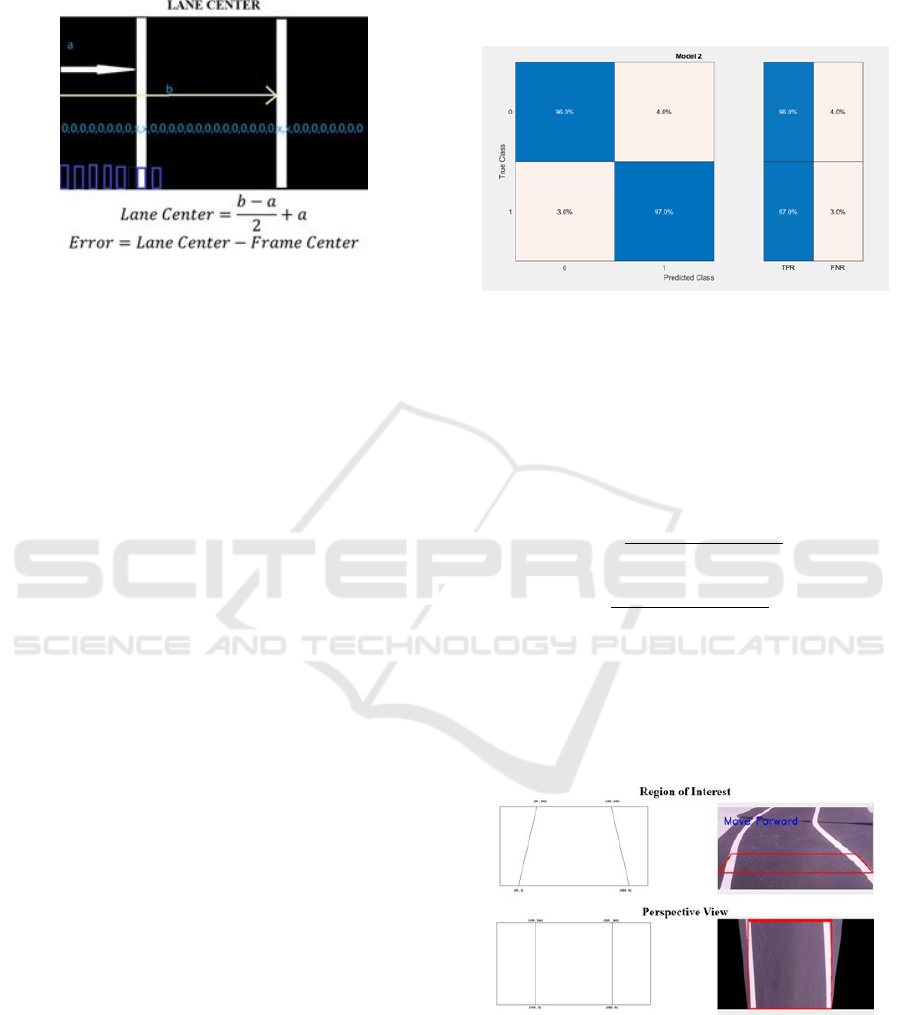
2.2.2 Error Calculation and Steer Control
The car’s frame center is fixed while the turning lane
center is changed with respect to the frame center. So
the difference of frame center to lane center gives us
an error, which is positive or negative for turning
right and left, respectively. This error was used as
steer input to follow the lane. For this error
calculation purpose, a dynamic array having a length
of a num- ber of pixels in the width of ROI (Region
of Interest) was used. Since the project is proof of
Real-time Drowsiness Detection and Emergency Parking using EEG
313
concept, thus for the manual control of the car was
smartphone app based on WIFI.
Figure 14: Error Calculation
2.2.3 Obstacle Detection and Car Parking
For obstacle detection, a machine learning-based ob-
ject detecting classifier named HAAR Cascade was
utilized. In order to get data trained, 300 positive and
50 negative samples were used. For data training, a
windows program Cascade Trainer GUI was used to
get the XML file. As soon as the object was detected
in front of the car, the parking function activates,
which turns on the indicator and detects whether the
car is in the fast lane or normal then parks accordingly
by gradually reducing speed. Open CV is also used to
detect lanes, i.e. in the fast lane. The left line would
be white, and the right would be Yellow and inversely
in the normal lane.
2.3 Mode of Communication
Raw EEG API carried out the data transmission be-
tween the EEG headset and the MATLAB. Thus al-
lows to program EmotivPRO, it was used to stream
the recorded raw EEG data from EmotivPRO to
MAT- LAB for real-time data processing. The
communica- tion between Raspberry PI and
MATLAB was suc- ceeded using Transmission
Control Protocol (TCP). MATLAB was set as master,
and Raspberry Pi was set as a slave. The next
communication requirement was required between
Raspberry Pi and ESP32, which as accomplished
using Bluetooth.
3 RESULTS
The drowsiness detection system has an accuracy of
96.8 percent, and it outperforms many systems in the
market. The system also can detect signals live. The
EEG headset sends the signal to MATLAB us- ing
Raw EEG API. In contrast, the MATLAB sends data
if drowsiness was detected or not using a Trans-
mission control protocol. Further, the RaspberryPi
sends steer commands to ESP32 using Bluetooth.
Figure 15: Confusion Matrix
The confusion matrix reports that, if a person was feeling
drowsiness than there is 3 percent chance algorithm
would report awake, and if a person is awake than there
is 4 percent chance algorithm will report the per- son is
feeling drowsy.
The accuracy and error is calculated as follows
(7)
(8)
The next part of the system is the parking of miniature
car which follows the track thus ensuring safe
parking. Below are the results of successful of lane
following covering each step.
Figure 16: ROI and Perspective view
The above results prove that the designed system is
fully capable and efficient is detect drowsiness and in
successful parking of a car.
HIMBEP 2020 - International Conference on Health Informatics, Medical, Biological Engineering, and Pharmaceutical
314
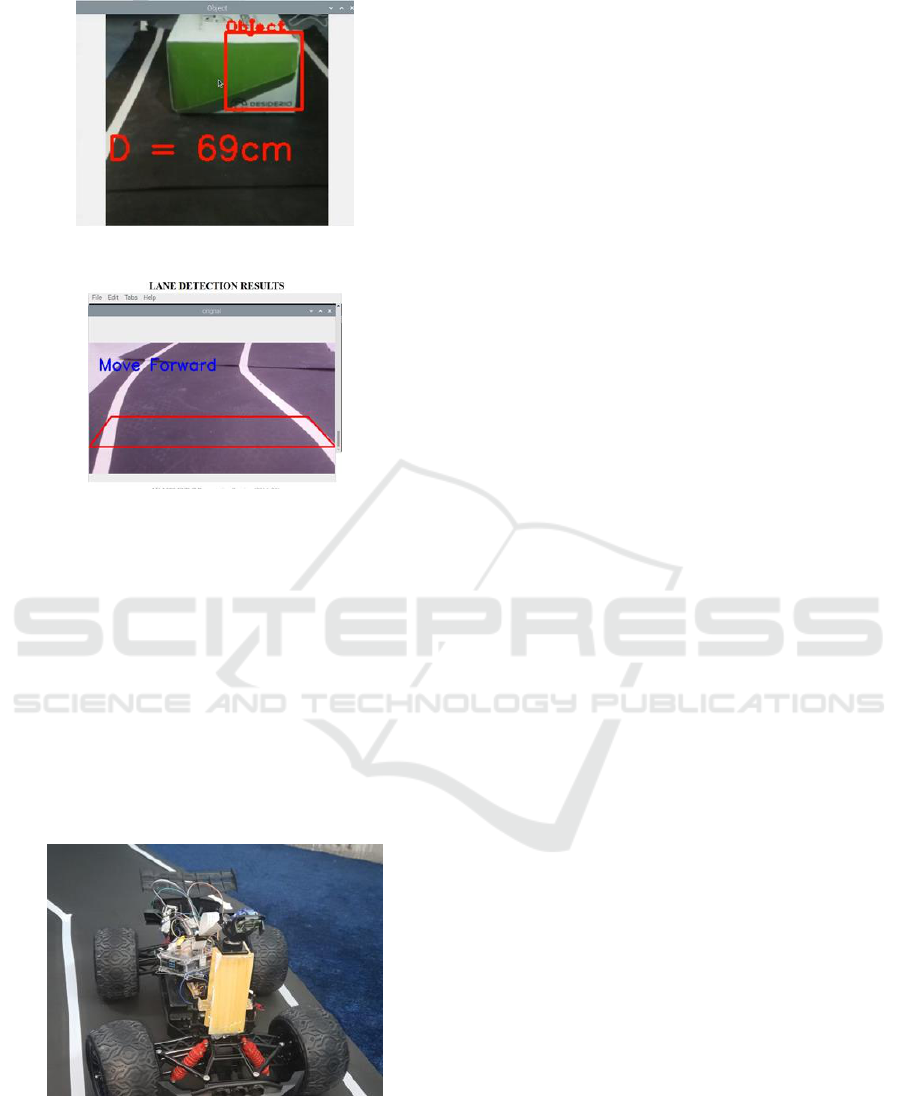
Figure 17: Object Detection
Figure 18: Final lane detection Result
4 DISCUSSIONS
The operational parameters and limitations and re-
striction’s are discussed below
4.1 Operational Parameter
Following are the operational Parameter of our com-
plete system:
•
Proper Setup of EEG Headset
•
Raspbian Buster and MATLAB Setup
Figure 19: Autonomous Car
Raspi Camera
Properly Configured OpenCV for GCC
compiler Environment
Raspi Cam library
Track Setup, i.e. Lane Width and colour
Ensure communication between EEG Headset
and Raspberry PI also between Raspberry PI
and ESP32
4.2 Limitations and Restrictions
User should not be on medication and must not
be under the influence of Alcohol
System is designed to work on Motorway
While changing lane, the system does not con-
sider any other vehicle
The curves of the road should be less than 60
De- gree.
Poor Lightning conditions were not considered
during Experiments
5 CONCLUSIONS
Microsleep is due to an inadequate amount of sleep,
and this type of sleep often occurs when driv- ing and
lasts from 1 to 10s, which is enough to cause road
accidents. Experiments showed that when a person
shifts from an awake state to a drowsy state, the
brain’s occipital region is the most affected area.
There is a sudden downward shift in alpha waves fol-
lowed by the oscillation in the theta band. This shift
works as a feature. After preprocessing, it goes to a
machine learning algorithm that resulted in a system
able to detect the driver’s drowsy state with an accu-
racy of 96.8 percent with an ability to classify 10,000
observations per second; hence it is fast and accurate.
Our study also suggests, instead of using many chan-
nels for drowsiness detection, only one channel O1 of
the occipital region can effectively detect drowsiness.
Many systems proposed in the past activated a buzzer
or an alarm to awaken a driver, but such systems ap-
peared meaningless when cars travel at a speed of 100
km/h. Hence an autonomous system is implemented
on a miniature car as proof of concept. It parks the car
itself after successful lane detection on to the parking
lane, thus minimizing the risk of accident at maxi-
mum. In future, the drowsiness and the autonomous
system can be implemented on a non-scaled vehicle.
REFERENCES
Bablani, A., Edla, D., and Dodia, S. (2018). Classification
of eeg data using k-nearest neighbor approach for con-
cealed information test. Procedia Computer Science,
143:242–249.
Real-time Drowsiness Detection and Emergency Parking using EEG
315

Balandong, R. P., Ahmad, R. F., Saad, M. N. M., and Ma-
lik, A. S. (2018). A review on eeg-based automatic
sleepiness detection systems for driver. IEEE Access,
6:22908–22919.
Choudhury, S., Chattopadhyay, S. P., and Hazra, T. K.
(2017). Vehicle detection and counting using haar
feature-based classifier. In 2017 8th Annual Indus- trial
Automation and Electromechanical Engineering
Conference (IEMECON), pages 106–109.
Kulkarni, A. P. and Baligar, V. P. (2020). Real time vehi-
cle detection, tracking and counting using raspberry- pi.
In 2020 2nd International Conference on Innova- tive
Mechanisms for Industry Applications (ICIMIA),
pages 603–607.
Kuo, C., Lu, Y., and Yang, S.-M. (2019). On the image sen-
sor processing for lane detection and control in vehicle
lane keeping systems. Sensors, 19(7):1665.
Majumder, S., Guragain, B., Wang, C., and Wilson, N.
(2019). On-board drowsiness detection using eeg:
Current status and future prospects. pages 483–490.
Rouse, M. (2020). Secure shell (ssh). https://
searchsecurity.techtarget.com/definition/ Secure-Shell.
This was last updated in April 2020.
Song, X., Yoon, S.-C., Rex, E., Nieves, J., and Moretz,
C. (2017). Driver drowsiness detection using single-
channel dry eeg. In 2017 IEEE Signal Processing in
Medicine and Biology Symposium (SPMB), pages 1–
3. IEEE.
Stevic´, S., Dragojevic´, M., Krunic´, M., and Cˇ etic´,
N. (2020). Vision-based extrapolation of road lane lines
in controlled conditions. In 2020 Zooming Innovation
in Consumer Technologies Conference (ZINC), pages
174–177.
Wei, C.-S., Wang, Y.-T., Lin, C.-T., and Jung, T.-P. (2018).
Toward drowsiness detection using non-hair-bearing
eeg-based brain-computer interfaces. IEEE transac-
tions on neural systems and rehabilitation engineer- ing,
26(2):400–406.
Wu, C.-B., Wang, L.-H., and Wang, K.-C. (2019). Ultra-
low complexity block-based lane detection and
departure warning system. IEEE Transactions on
Circuits and Systems for Video Technology,
29(2):582–593.
Yang, Z., Li, H., Ali, S., Ao, Y., and Guo, S. (2017). Lane
detection by combining trajectory clustering and curve
complexity computing in urban environments. In 2017
13th International Conference on Semantics,
Knowledge and Grids (SKG), pages 240–246. IEEE.
HIMBEP 2020 - International Conference on Health Informatics, Medical, Biological Engineering, and Pharmaceutical
316
