
Prediction of Drug Users Addiction Level with Methadone
Treatment based on Brainwave Maximum Amplitude using ANFIS
Method
Arjon Turnip
1*
, Erwin Sitompul
2
, George Michael T.
3
, Shelly Iskandar
4
, Dessy Novita
1
, Dwi Esti
Kusumandari
5
1
Department of Electrical Engineering, Universitas Padjadjaran, Indonesia
2
Study Program of Electrical Engineering, Faculty of Engineering, President University, Indonesia.
3
Electrical Engineering, Institut Teknologi Nasional, Indonesia
4
Faculty of Medical, Universitas Padjadjaran, Indonesia
5
Technial Unit for Instrumentation Development, Indonesian Institute of Science, Indonesia
Keywords: Methadone, EEG, drugs, and ANFIS.
Abstract: The use of drugs outside the doctor's instructions tends to damage nerve function in users. The ability to detect
drug users early is a major obstacle in overcoming drug abuse. If the brain system in humans is damaged, it
usually causes permanent disability and is difficult to repair. In this study, a classification method to identify
the level of brain damage in drug users was proposed. In the experiment, drug images were randomly
displayed to stimulate the subjects' memory of using certain drugs. Recorded brain signals from eight subjects
(addiction, methadone treatment (rehabilitation), and control) were performed. Brain waves in the form of
alpha, beta, theta, and delta are used as features for the classification process using the ANFIS method. The
classification results related to drug use with an accuracy rate of 96.97% were achieved.
1 INTRODUCTION
This study aims to determine the level of addiction of
a drug user after using methadone on the brain. The
brain is the central regulatory structure that regulates
most of the movement, behavior, and body functions
such as heart rate, blood pressure, body fluid balance,
and body temperature for every living thing,
especially humans. The large part of the brain can be
divided into four lobes, namely the front (frontal),
back (occipital), middle (parietal), and side
(temporal) brain.
The cerebral cortex is the outermost layer of the
brain, which extends in two hemispheres and is
connected by the corpus callosum. Overall, each
hemisphere is divided into four lobes namely frontal,
parietal, temporal and occipital. This division shows
that each lobe works based on their respective
functions. The frontal lobes are separate from the
parietal, and temporal lobes, where they are
connected by central and lateral sulci, respectively.
The frontal lobe generally functions to regulate
emotional regulation, planning, reasoning, and
problem solving. The parietal lobe functions to
connect all sensory information such as touch,
temperature, pressure, and pain. The temporal lobe
functions to process sensory information from the
parietal lobe such as hearing, recognizing language,
and forming memories. The occipital lobe is the main
center for processing information in the form of
visuals such as interpreting the depth, distance,
location, and identity of the object seen.
The information content in each brain activity
according to its function can be recorded and
processed for various needs such as disease detection,
robot applications in the form of wheelchairs (Turnip
et al, 2015), games, entertainment, and others
(Turnip, Hidayat & Kusumandari, 2017; Simbolon et
al, 2019). Of the many medical instrumentations,
electroensephalogram (EEG) is a tool that can be used
to study information from recorded electrical activity
in the brain, including recording and interpretation
techniques. EEG signals contain information on
electrical activity in the brain, including the state of
electrical and mental disturbances in nerves. EEG
signals have a complex shape, are easily buried by
Turnip, A., Sitompul, E., Michael T., G., Iskandar, S., Novita, D. and Kusumandari, D.
Prediction of Drug Users Addiction Level with Methadone Treatment based on Brainwave Maximum Amplitude using ANFIS Method.
DOI: 10.5220/0010370603010307
In Proceedings of the International Conference on Health Informatics, Medical, Biological Engineering, and Pharmaceutical (HIMBEP 2020), pages 301-307
ISBN: 978-989-758-500-5
Copyright
c
2021 by SCITEPRESS – Science and Technology Publications, Lda. All rights reserved
301

noise, small amplitudes and do not have a standard
pattern, so visual analysis is not easy.
There are many types of EEG signals, one of
which is the P300 signal type (Karamacoska & Barry,
2019). EEG signals can also be interpreted in the form
of delta (δ), theta (θ), alpha (α), beta 1 (β1), beta 2
(β2), and gamma (γ) waves. Delta waves (δ) are
conditions that arise when a person is sleeping well.
Theta wave (θ) is a condition that occurs when a
person is lightly sleeping, and in a happy state. Alpha
waves (α) are conditions that appear when a person is
relaxed and their eyes are closed. Beta waves (β) are
conditions that appear when a person is doing
activities in terms of remembering such as a state of
thinking. Gamma waves (γ) are conditions in which
brain activity integrates various stimuli (Neto &
Rosa, 2017).
Several previous studies related to the use of EEG
for interpretation of brain signal information have
been done (Simbolon et al, 2015; Turnip et al, 2019).
Research on methadone was conducted using the
fuzzy method as a classifier in the journal entitled
Drug Abuse Identification based on EEG-P300
Amplitude and Latency with Fuzzy Logic Calssifier
compiled by (Turnip, Kusumandari, & Pamungkas,
2018). This study aims to determine the level of a
person's addiction to drugs using fuzzy logic. EEG
Signal Classification Using AAR and SVM with
Eeggyroscope Sensor of Emotiv Epoc was conducted
to determine the results of the EEG signal
classification using the AAR and SVM methods. This
study also links ICA as one of its methods. The
accuracy of this study shows that the number is quite
high, namely 92%.
Furthermore, in the literature entitled An
Adaptive Method for Feature Selection and
Extraction for Classification of Epileptic EEG Signal
in Significant States, feature selection and extraction
to get good classification results are carried out
(Harpale & Bairagi, 2018). This study also uses the
ANFIS method as a classifier with approximate
accuracy 96,48%
EEG signal classification using the K - Means
algorithm and Fuzzy C Means Clustering in a study
entitled EEG Signal Classification using K-Means
and Fuzzy C Means Clustering Methods is proposed
(Hegde, Nagananda, & Harsha, 2015). Drug-related
research entitled The Effects of Methadone
Maintenance Treatment on Heroin Addicts with
Response Inhibition Function Impairments: Evidence
From Event-Related Potentials discusses the effects
of methadone on the brain response of heroin users
(Yang, et al., 2015). The results of this study indicate
that there are differences in brain response after using
methadone. A similar study using methadone, namely
Aging Opioid Users' Increased Risk of Methadone-
Specific Death in the UK explains the level of risk of
death caused by excessive methadone use (Pierce,
Millar, Robertson, & Bird, 2018). Subsequent
research studies (Characteristics of Adherence to
Methadone Maintenance Treatment Over A 15-Year
Period among Homeless Adults Experiencing Mental
Illness) proved that adherence to methadone
maintenance treatment over a 15 year period (among
homeless adults with mental illness) provided
significant improvement.
Risks of Methadone use as Substitute Therapy for
Opioid Addiction during Pregnancy and use of
Clonidine as a Plausible Alternative by (Munin, Iqbal,
& Stowe, 2016) discusses the risks of using
methadone in therapy during pregnancy. Another
study in the form of EEG Signal Classification Using
PSO Trained RBF Neural Network for Epilepsy
Identification discusses the classification of EEG
signals using the RBF Neural Network method with
an accuracy of 98% (Satapathy, Dehuri, & Jagadev,
2017). The application of the ANFIS method to detect
brain tumors was also successfully carried out in a
study entitled "Brain Tumory Detection Using
Artificial Neural Network Fuzzy Inference System
(ANFIS) (J.Deshmukh & Khule, 2014). However, the
accuracy of this study is still relatively low, namely
50-60%.
In this study, the use of the ANFIS method to
predict drug users addiction levels in rehabilitation
patients using methadone was proposed. The
predictors that are developed are expected to be able
to assist the medical team in providing methadone
doses to patients, so that the suspicion of over or
under-dosage can be overcome. Either over or under
dosage will slow down the process of eliminating
dependence on drug use. Even over dose is thought to
cause death or at least will increase dependence on
drugs.
2 METHOD
The process of this research is divided into 4 stages,
namely: Signal Recording, Filtering Process, Data
Extraction, and Data Classification. Recording of the
EEG signal was carried out at Hasan Sadikin Hospital
Bandung. The tools used are Electro-cap, Electro-gel,
electro-gel special syringe, Mitsar EEG-202,
computer, MatLab 2020 software.
Brain recording data of the subjects used were as
many as 8 subjects after fasting to consume
methadone for 8 hours before the experiment. Each
HIMBEP 2020 - International Conference on Health Informatics, Medical, Biological Engineering, and Pharmaceutical
302
subject was subjected to 2 tests, namely different pre
and post stimuli. The different pre and post were the
subjects' EEG recording data before and after using
the methadone, respectively. Stimulus different is a
collection of pictures, one of which contains pictures
of drugs. The image set consists of 4 images of non-
target stimuli (different images with drugs) and 1
target stimulus (drug-like) in 10 different sequences
(20 seconds total). Each subject was recorded with the
condition before and one hour after consuming
methadone. The recorded data is then extracted based
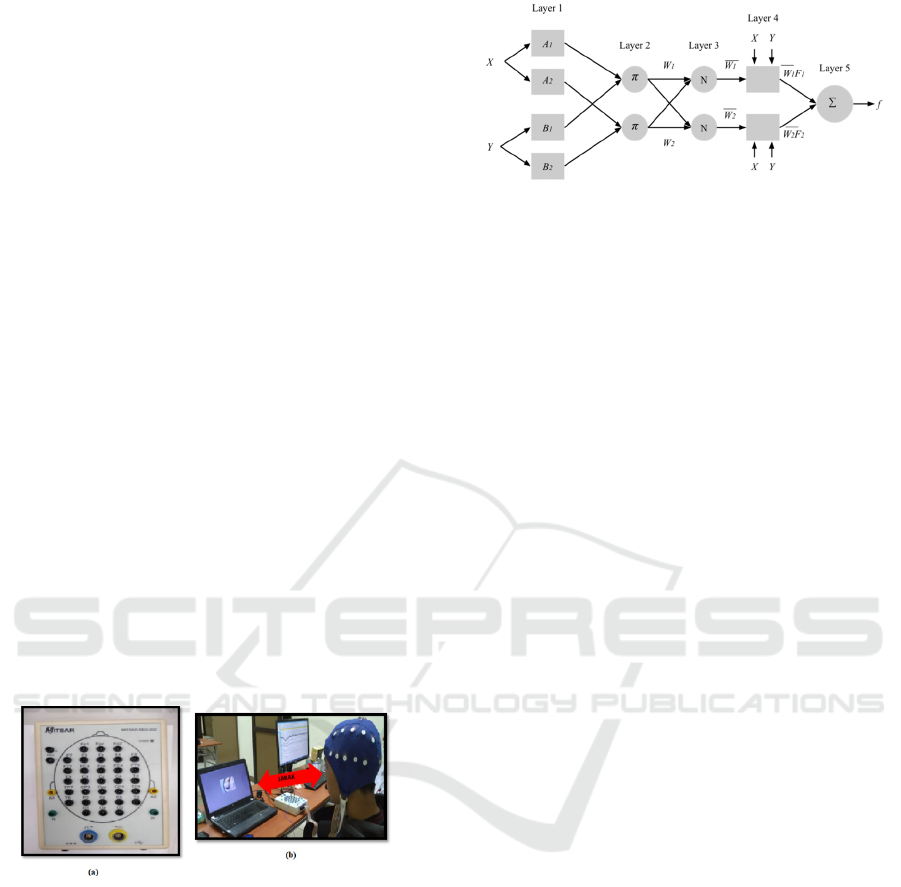
on the brain wave. Figure 1 is EEG Mitsar 201 and
experimental scenario.
Each subject will be assigned an Electro-cap that
has been given Electro-gel for each channel.
Recording is done using the Mitsar EEG-201 device
which is connected to a computer and has WinEEG
software. Prior to recording, the electrode impedance
calibration for each channel was performed with an
impedance less than 5k. Raw data that is recorded
is an EEG signal which is very sensitive to noise.
Therefore, the signal will be preprocessed to sort out
the data that will be considered noise.
The signal that has been extracted from the
filtered signal will study the pattern of changes from
before and after consuming methadone. The pattern
obtained is then used as input for the classifier to
produce a decision on the outcome of each subject.
The classification used is ANFIS logic as a method
for machine learning decision making.
Figure 1: Recording process using Mitsar - EEG 201
Artificial Neuro Fuzzy Inference System (ANFIS)
is an architecture that is functionally the same as the
fuzzy rule base Sugeno model. ANFIS architecture is
also the same as a neural network with radial
functions with certain limitations. It can be said that
ANFIS is a method in which setting rules use a
learning algorithm for a set of data. ANFIS also
allows the rules to adapt. The first order ANFIS
structure is shown in Figure 2. In the Figure there are
5 layers with different functions for each layer. The
box symbol represents an adaptive node, meaning
that its parameter values can change with learning.
Meanwhile, the circle symbol represents a non-
adaptive node whose value is fixed.
Figure 2: Structure of ANFIS prediction model
3 RESULTS AND DISCUSSIONS
3.1 EEG Signal Pre-processing
The signal is filtered using a Band Pass Filter in the
frequency range 0.5 Hz - 70 Hz (signal frequencies
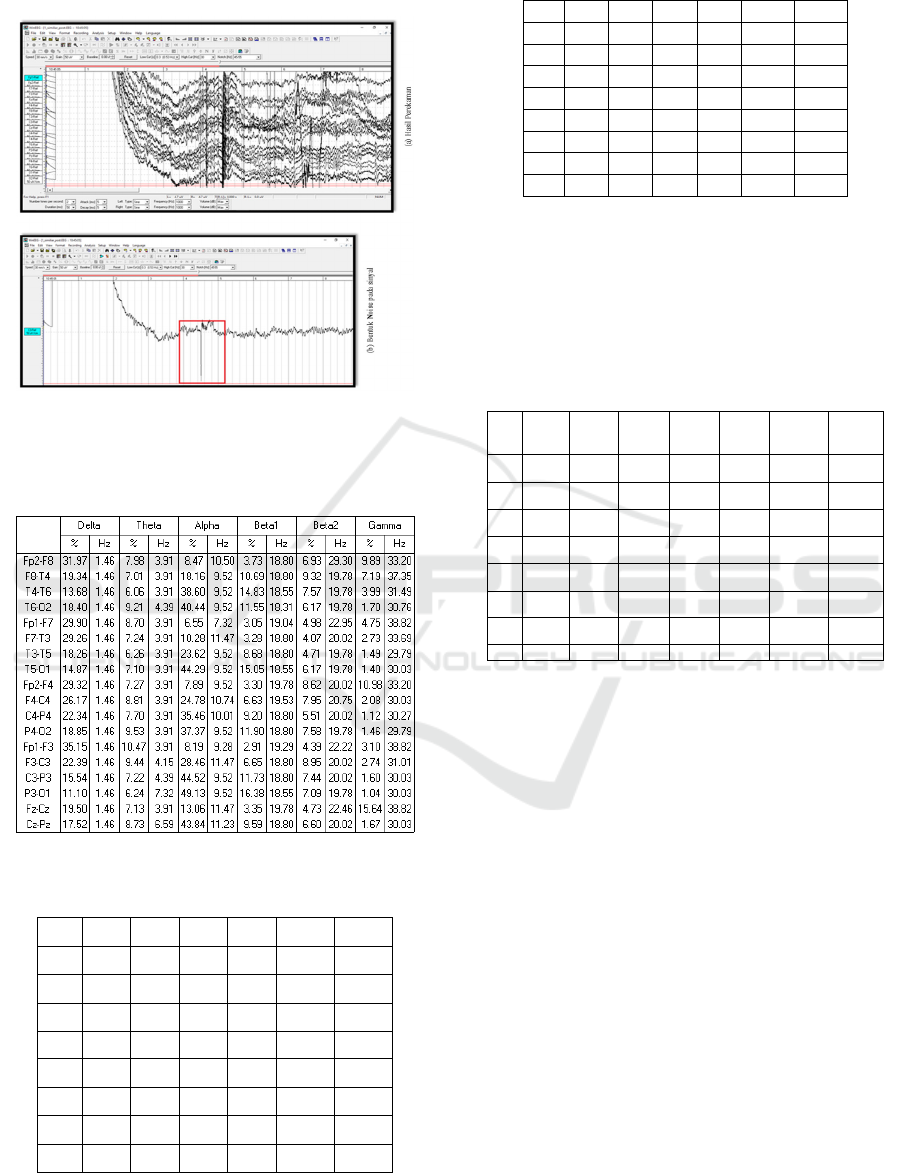
outside this range will be considered noise). Figure 3
is the EEG signal raw data with background noise
content. The portions that are marked with red colour
are known as artefacts.
The filtered EEG signal is then extracted.
Extraction is carried out to obtain brain waves in the
form of alpha, beta, theta, delta, beta, and gamma
waves. Signal extraction was carried out using EEG
Spectra method from WinEEG application. EEG
Spectra produces extraction data in the form of
amplitude, power spectrum, and percent of the EEG
signal. The extraction results are then known as
features to be used as input to the classifier. The
feature chosen in this study is the average percentage
of the maximum amplitude of each wave. Table 1 is
the percentage of the maximum amplitude of each
channel for one subject in one experiment, namely
before consuming methadone. The same was done for
each subject both before and one hour after taking
methadone. The results from each subject were then
averaged to obtain a single amplitude value for each
subject in each experiment.
3.2 Clasification Process
After going through the recording process using an
EEG signal recording device, data will be obtained in
the form of numbers from the translation of the
recorded brain signal. The selected feature is the
difference in the average percentage of the maximum
amplitude, namely in Tables 2 and 3 which consists
of six variables, namely Delta, Theta, Alpha, Beta1,
Beta2, and Gamma (S is the subject). The value of
each wave was obtained from the difference in the
average maximum amplitude before (Table 2) and
Prediction of Drug Users Addiction Level with Methadone Treatment based on Brainwave Maximum Amplitude using ANFIS Method
303
after one hour (Table 3) consuming Methadone for
each subject.
Figure 3: Shape of the brain signal
Table 1: Maksimum amplitudo of one subject for each
channels
Table 2: Average maximum amplitude before Methadone
consumption
S
δ θ α β1 β2 γ
S1
1,6 5,4 1,8 0,8 1 13,7
S2
1,7 4,3 0,5 0,8 6,7 7,1
S3
1,7 3,9 8,2 0,7 0,9 7,2
S4
2 4,6 5,7 0,7 1 21,8
S5
1,5 6,9 5,3 0,8 1 20,4
S6
1,8 4,2 5,5 0,6 11,2 21,4
S7
2,1 4,1 6,4 0,8 0,9 14,4
S8
1,6 5,3 9 0,7 6,3 1,5
Table 3: Average maximum amplitude after one hour
Methadone consumption
S δ θ α β1 β2 γ
S1 2,2 5,1 6,8 0,8 1 1,3
S2 1,6 5,1 0,5 0,7 1 15,6
S3 1,9 5 6,9 0,7 1,1 1,4
S4 1,7 6,5 2,3 0,7 0,9 1,4
S5 1,9 6,1 3,7 0,7 1 8,5
S6 1,9 4,9 1,9 0,7 11,4 15
S7 1,7 4,1 3,6 0,8 0,9 28,3
S8 1,7 5,2 4,1 0,7 1 8,5
The classification results are used to detect the
level of a person's addiction to drugs in relation to the
administration of methadone doses in rehabilitation
patients. The results from the difference in maximum
amplitude from Table 3 to Table 2 for each subject
are used as input in the ANFIS method as in Table 4.
Table 4. Difference of average maximum amplitude
S Delta
(δ)
Theta
(θ)
Alpha
(α)
Beta1
(β1)
Beta2
(β2)
Gamma
(γ)
Output
S1 1 0.5 9.9 0.1 5.7 8 25.20
S2 0.3 1.6 4.9 0 0 28.9 35.70
S3 0.6 1.9 3.6 0.1 5.9 14.6 26.70
S4 0.1 2.7 1.5 0.1 5.6 0 10
S5 0.8 0 3.3 0 5.7 8.5 18.30
S6 0.5 1.5 1.3 0.2 5.9 14 23.40
S7 0 0.8 2.1 0.1 5.7 34.3 43
S8 0.5 0.7 0 0.1 0.4 27.4 29.10
The column output data in Table 4 is used as a
reference for the classifier. The value ranges are
grouped into 4 categories, where for each category the
value are:
• HA (Heavily Addicted): >40
• MA (Moderate Addicted): <40 - ≥ 30
• SA (Slightly Addicted): <30 - ≥20
• NA (Not Addicted): <20 - ≥ 0
The grouping of values for each feature (Delta,
Theta, Alpha, Beta1, Beta2, and Gamma) is a
predictive output related to the addiction level of
rehabilitation patients. This data is the difference
from the signal before consuming methadone and
after consuming methadone. The six waves will later
become input in this classification process.
Classification process Based on the image above, the
following is an explanation for each description in
Figure 4: (a) how to input training data in the ANFIS
algorithm, (b) showing the ANFIS display, (c)
showing the input and output design on the
classification for each category predefined, (d)
HIMBEP 2020 - International Conference on Health Informatics, Medical, Biological Engineering, and Pharmaceutical
304
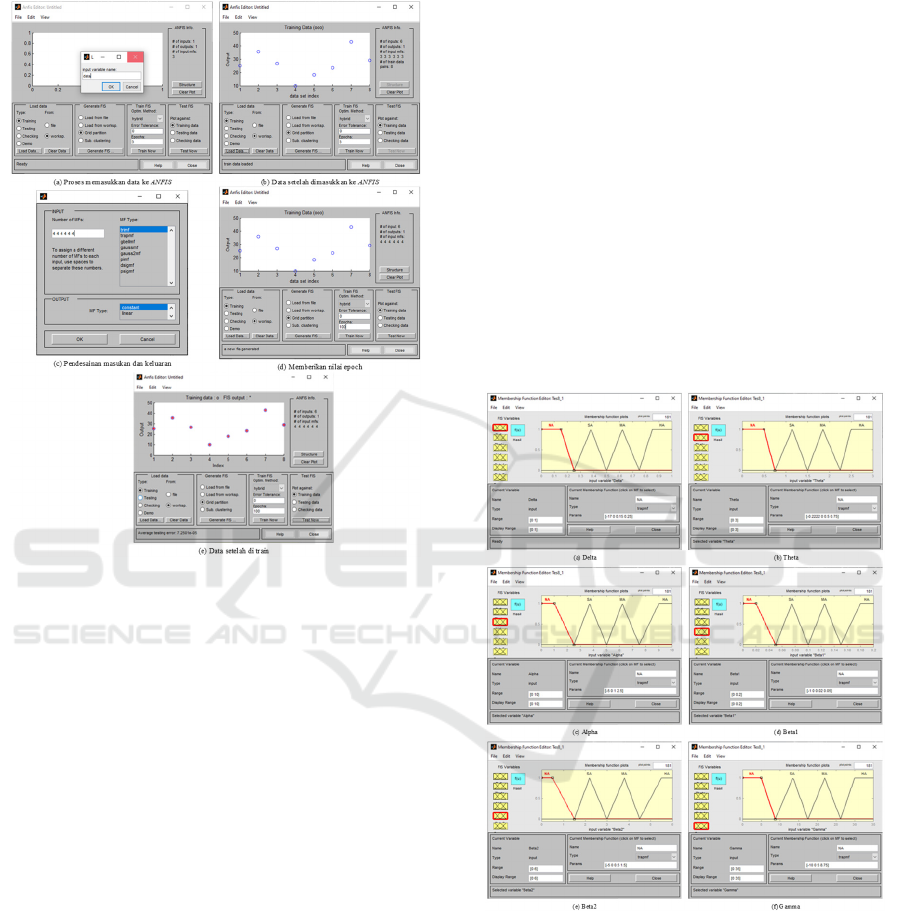
iterates 100 times on the data. (e) shows the
comparison of training data and tested data.
Figure 4: Clasification process using ANFIS method
Each input requires the maximum and minimum
value of the data for the smallest and largest input
variables. Based on Figure 5, the following is an
explanation for each description of the input settings:
(a) Delta variable, the value range starts from 0 to 1.
Each category gets a value of 0.25, (b) the Theta
variable, the range of values starts from 0 up to 3.
Each category gets a value of 0.75, (c) the Alpha
variable, the range of values starts from 0 to 10 with
the category of getting a value of 2, 5, (d) the Beta1
variable, the range of values starts from 0 to with 0.02
with each category getting a value of 0.05, (e) the
Beta2 variable, the value range starts from 0 to 6 with
each category getting a value of 1.5, (f) the Gamma
variable, the range of values starts from 0 to 35, with
each category getting a value of 8.75.
Figure 6 shows the Rule Viewer of the input and
output model design in the ANFIS classifier. A hybrid
training algorithm is used where a combination of the
gradient descent algorithm and a least squares
algorithm is used for an effective search for the
optimal parameters. The main benefit of ANFIS is
that it converges much faster, since it reduces the
search space dimensions of the backpropagation
method used in neural networks. 4096 If-then rules
and threemf type of membership function are used.
The developved predictor model designed by ANFIS
method is shown in Figure 7. This study started from
recording brain signals before and after 1 hour of
consuming methadone from 8 subjects who were drug
addicts. There will be a comparison of the results of
the two recordings starting from the increase and
decrease in the subject's brain signal. This
comparison becomes the data that we will process for
classification. To get a comparison of the two data,
the difference between the two experiments was
calculated. After getting the difference between the
two data, the classification process in the ANFIS
prediction model application that has been built is
carried out. The iteration process of 40 epochs was
carried out to increase the accuracy of the prediction
model. Furthermore, the input form is redesigned to
improve the accuracy results before testing the
prediction model.
Figure 5: Design input on ANFIS
The comparison of clasification results using
ANFIS method and calculation process is shown in
Figure 8. It can be seen that both result almost the
same except subjects 4 and 5. The slightly different
of the classification results on those subject was
suspected that both subjects consumed methadone
before the experiment. However, generally the
classification results of 96.97% is shows that this
prediction model can be used to predict the addiction
Prediction of Drug Users Addiction Level with Methadone Treatment based on Brainwave Maximum Amplitude using ANFIS Method
305
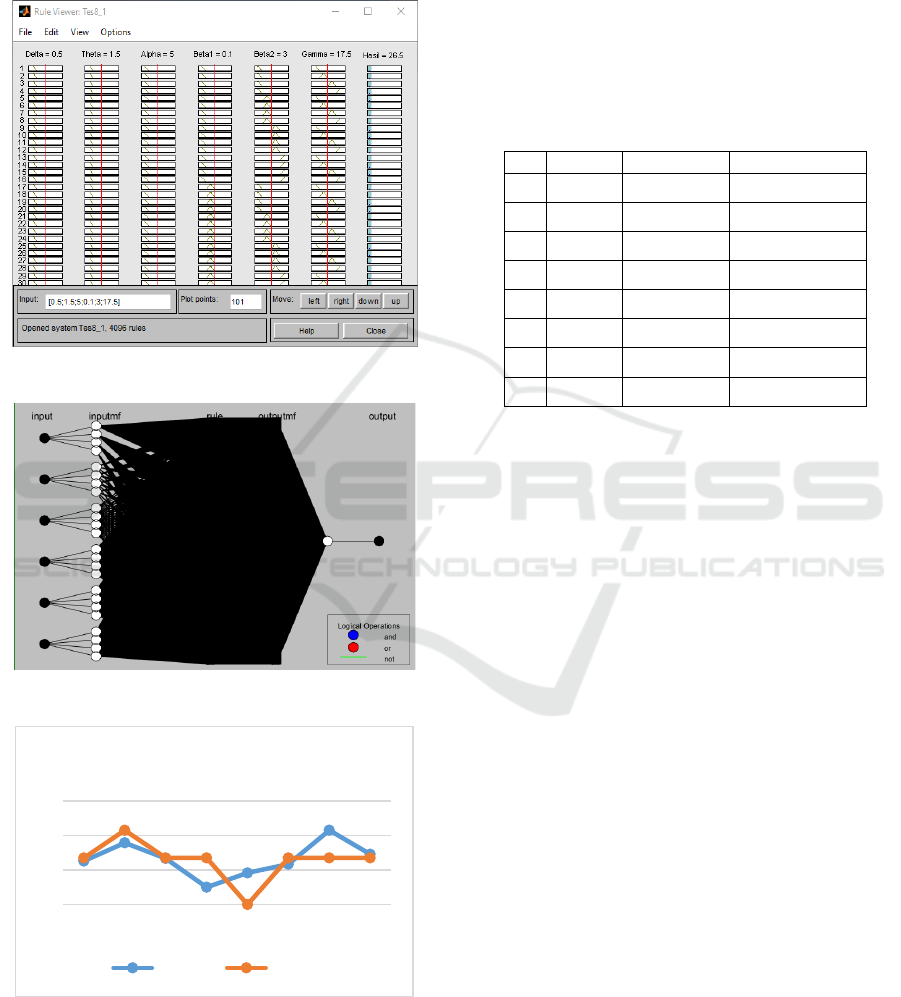
level of a drug user. Table 4 shows the predicted
addicted level for all subjects. It were obtained that
only one subject was highly addicted. Six subject
were moderate addicted and one subject was not
addicted.
Figure 6: Viewer IF-Then rules
Figure 7. Developved ANFIS Structure
Figure 8. Comparison of Addiction level of calculated data
with predicted by ANFIS method.
Methadone-induced increased brain signal
activity resulted in several different patterns of
enhancement for each subject. Each pattern was
evaluated in each subject to determine the level of
dependence of a patient on drugs in this study
represented by methadone. The increase in the
amplitude value of several brain waves before and
after consuming Methadone indicates an increase in
brain signal activity in certain parts. Some of the
unusual enhancements to the subject are indicated by
numbers soaring higher than other subjects. This is
thought to be due to interference in recording brain
signals.
Table 4: Classification results
S ANFIS Calculation Addiction level
S1 25,20 27,0 MA
S2 35,70 43,0 HA
S3 26,70 27,0 MA
S4 10,00 27,0 MA
S5 18,30 0,0 NA
S6 23,40 27,0 MA
S7 43,00 27,0 MA
S8 29,10 27,0 MA
4 CONCLUSIONS
The classification of brain signal activity before and
after 1 hour of consuming Methadone using the
ANFIS process resulted in a fairly good prediction.
Using 4 categories to determine the addiction level of
each input resulted in an accuracy rate of 96.97%.
This high degree of accuracy makes ANFIS modeling
feasible for medical needs. However, the drawback is
in the spike in brain signal values that fluctuate based
on disturbance or stimulation when the ANFIS
determines the category associated with the desired
value. ANFIS predictor represent a useful tools for
solving the non linearity problem of drug user
prediction level prediction. Training data for the
present study of ANFIS prediction was randomly
collected from several simulations in MATLAB. The
simulation results proved that ANFIS predictor can be
applied successfully to predict the drug user addiction
level because of its effectiveness and fast processting
time.
ACKNOWLEDGMENTS
This research was supported by Technical
Implementation Unit for Instrumentation
Development, Indonesian Institute of Sciences, and
0
20
40
60
12345678
96.97%
Output Matlab
HIMBEP 2020 - International Conference on Health Informatics, Medical, Biological Engineering, and Pharmaceutical
306

Department of Electrical Engineering, Universitas
Padjadjaran, and Toba Research Center, Indonesia.
REFERENCES
Athia, S. (2009). Logika Fuzzy. Bandung: Bandung.
Grace Y.WangaRobKydd, T. A. (2015). Changes in resting
EEG following methadone treatment in opiate addicts.
Volume 126, 943-950.
Harpale, V., & Bairagi, V. (2018). An adaptive method for
feature selection and extraction for classification.
Journal of King Saud University – Computer and
Information Sciences.
Hegde, N. N., Nagananda, P. M., & Harsha, M. (2015).
EEG Signal Classification using K-Means and Fuzzy C
Means Clustering Methods. International Journal of
Science Technology & Engineering.
J.Deshmukh, R., & Khule, R. (2014). Brain Tumor
Detection Using Artificial Neural Network Fuzzy
Inference System (ANFIS). International Journal of
Computer Applications Technology and Research.
Karamacoska, D., & Barry, R. (2019). EEG-ERP dynamics
in a visual Continuous Performance Test. International
Journal of Psychophysiology, 249-260.
Karamacoska, D., & Barry, R. (2019). EEG-ERP dynamics
in a visual Continuous Performance Test. Journal of
Psychophysiologi, 249-260.
Kusumadewi, S., & Hartati, S. (2010). NeuroFuzzy
Integrasi Sistem Fuzzy dan jaringan Syaraf Edisi 2.
Yogyakarta: Graha Ilmu.
Munin, M., Iqbal, Z., & Stowe, D. F. (2016). Risks of
Methadone use as Substitute Terapy for Opioid
Addiction during Pregnancy and use of Clonidine as a
Plausible Alternative. Journal of Addiction Medicine
and Therapeutic Science.
Musthafa, A. R., & Tjandrasa, H. (2018). EEG SIGNAL
CLASSIFICATION USING AAR AND SVM WITH
EEGGYROSCOPE. 1-2.
Neto, F. S., & Rosa, J. (2017). Depression biomarkers using
non-invasive EEG: A review. Journal Neuroscience and
Biobehavioral Reviews 105, 83 - 93.
Parpouchi, M., Moniruzzaman, A., Rezansoff, S. N.,
Russolillo, A., & Somers, J. M. (2017). Characteristics
Of Adherence To Methadone Maintenance Treatment
Over A 15-Year Period Among Homeless Adults
Experiencing Mental Illness. Addictive Behaviors
Reports 6.
Philippu, A. (2019). Neurotransmitters are released in brain
areas according to ultradian rhythms: Coincidence with
ultradian oscillations of EEG waves. Journal of
Chemical Neuroanatomy, 66-72.
Pierce, M., Millar, T., Robertson, J. R., & Bird, S. M.
(2018). Ageing Opioid Users’ Increased Risk Of
Methadone-Specific Death In The UK. International
Journal of Drug Policy 55.
Salusi, H. (2020). Aktivitas Gelombang Otak Dengan
Sinyal EEG P300 Pada Empat Daerah Berbeda.
Pekanbaru.
Satapathy, S. K., Dehuri, S., & Jagadev, A. K. (2017). EEG
signal classification using PSO trained RBF neural
network for epilepsy identification. Informatics in
Medicine Unlocked 6.
Shepshelovich, D., & Yahav, D. (2019). Assessment of
frequency and reporting of design changes among
clinical drug trials published in influential medical
journals. European Journal of Internal Medicine.
Shiffman, S., & Basak, S. (2018). An automated mapping
method for Nissl-stained mouse brain histologic
sections. Journal of Neuroscience Methods, 219-227.
Simbolon,A. I., Turnip, A., Hutahaean .J., Siagian, Y. and
Irawati, N., An experiment of lie detection based EEG-
P300 classified by SVM algorithm. International
Conference on Automation, Cognitive Science, Optics,
Micro Electro-Mechanical System, and Information
Technology (ICACOMIT), Bandung, 2015, pp. 68-71,
doi: 10.1109/ICACOMIT.2015.7440177.
Simbolon, A., Nadiya, U., Suhendra, M., et al., Alteration
in Resting EEG for Different Dosage of Methadone
Treatment, International Conference of Computer
Science and Information Technology (ICoSNIKO), 28-
29 Nov. 2019. DOI:
10.1109/ICoSNIKOM48755.2019.9111607.
Turnip, A., Kusumandari, D. E., & Pamungkas, D. S.
(2018). Drug Abuse Identification based EEG-P300
Amplitude and Latency with Fuzzy Logic Calssifier.
Conference: 2018 International Conference on Applied
Engineering (ICAE).
Turnip, A., M. A. Suhendra and Mada Sanjaya W. S. 2015.
Brain-controlled wheelchair based EEG-SSVEP
signals classified by nonlinear adaptive filter. 2015
IEEE International Conference on Rehabilitation
Robotics (ICORR), Singapore, 2015, pp. 905-908, doi:
10.1109/ICORR.2015.7281318.
Turnip A., Hidayat, T., Kusumandari, D. E., 2017.
Development of brain-controlled wheelchair supported
by raspicam image processing based Raspberry pi. 2nd
International Conference on Automation, Cognitive
Science, Optics, Micro Electro--Mechanical System,
and Information Technology (ICACOMIT), Jakarta,
2017, pp. 7-11, doi:
10.1109/ICACOMIT.2017.8253377.
Turnip, A., Kusumandari, D., Novita, D., et al., An Increase
of the Central Frequency of Alpha Brain Wave Effected
by Soy Peptide in Open Eyes Condition based EEG
Signals, IEEE International Conference of Computer
Science and Information Technology (ICoSNIKOM),
28-29 Nov. 2019.
Yang, L., Xu, Q., Li, S., Zhao, X., Ma, L., Zheng, Y. . . . Li,
Y. (2015). The effects of methadone maintenance
treatment on heroin addicts with response inhibition
function impairments: Evidence from event-related
potentials. Journal of food and drug analysis 23.
Prediction of Drug Users Addiction Level with Methadone Treatment based on Brainwave Maximum Amplitude using ANFIS Method
307
