
Electronic Service Quality and Perceived Value in Mobile based
Services
Doddy Ridwandono, Tri Lathif Mardi Suryanto and Gita Islamiwaty Suherlan
Department of Information Systems, Universitas Pembangunan Nasional “Veteran” Jawa Timur, Surabaya, Indonesia
Keywords: Service Value, Perceived Value, Mobile Services.
Abstract: Indonesia is one of the countries with the highest number of mobile user growth in the world. To support its
services, telecommunications companies provide mobile-based services. This paper aims to determine the
service quality attributes of mobile services, and reveal their relationship with another variable, Perceived
Value. The survey was conducted electronically on users of the mobile services application (My-Telkomsel)
in Surabaya, Indonesia. 523 and 115 respondents were collected for E-S-Qual and E-Recs-Qual scale,
respectively. The collected data was further tested using SmartPLS software. The result was: E-S-Qual
which consists of Efficiency, System Availability, Fulfilment, and Privacy has a significant effect on
Perceived Value. As for the E-RecS-Qual, only the Responsiveness variable has a significant effect on
Perceived Value. Two other variables, Compensation and Contact, have no significant effect. This research
could encourage service providers to put emphasize on certain quality attributes. In addition, this study
provides insight regarding the effect of service quality on Perceived Value.
1 INTRODUCTION
There is a need to assess service quality (Batagan
2013). The growth of various types of services
encourages the creation of new ways of delivering
services and increases the interest of researchers to
study the field (Furrer et al. 2020). One of them is a
study in the change in customer preferences (Patten
et al. 2020) due to device adoption in both the
desktop and mobile contexts (Kaatz 2020). This
paper focuses on one particular aspect, Service
Quality in the mobile services context.
The level of urgency to conduct research on
service quality in a mobile context is high.
According to statista.com and datareportal.com, it is
close to 60% of the world’s total population use the
internet. Around 91% of internet users use mobile
devices in which Indonesia is ranked 4
th
in the
number of the internet user (Pengguna and Indonesia
2020). The increase in internet users has encouraged
many companies to develop mobile-based services,
and therefore the quality of their services needs to be
measured (Tharanikaran et al. 2017), (Rita et al.
2019), (Furrer et al. 2020). These facts were the
motivation to identify the mobile-based services
quality dimension in Indonesia.
The object of this research is an Indonesian
telecommunications company mobile-based service,
MyTelkomsel (my.telkomsel.com). The application
is intended to provide convenience for customers in
managing accounts and accessing services using a
smartphone. Services that can be fulfilled include
purchasing data packages, as well as providing
information needed by a customer. This object was
chosen considering its large number of users and
transactions (Kusdinar and Ariyanti 2020). While
the model chosen to identify the variables of service
quality is ServQual (Parasuraman et al. 2005)
(Parasuraman et al. 2005) is one of the studies
that many referenced regarding Service Quality.
Many researchers use this research as the basis for
model development. As an example, (Tharanikaran
et al. 2017), (Mujinga 2020), examined the effect of
service quality on customer satisfaction in the
context of e-banking and online shoping (Rita et al.
2019). There are also researchers who adopt
question items from (Parasuraman et al. 2005) for
hotel services domain (Le et al. 2020). Moreover,
Service quality could not only predict customer
satisfaction, but also predict the impact on
relationship quality (Rahahleh et al. 2020) and
perceived value (Mendoza et al. 2020), (Li and
592
Ridwandono, D., Mardi Suryanto, T. and Suherlan, G.
Electronic Service Quality and Perceived Value in Mobile based Services.
DOI: 10.5220/0010369100003051
In Proceedings of the International Conference on Culture Heritage, Education, Sustainable Tourism, and Innovation Technologies (CESIT 2020), pages 592-598
ISBN: 978-989-758-501-2
Copyright
c
2022 by SCITEPRESS – Science and Technology Publications, Lda. All rights reserved
Shang 2020), (ÇETİNSÖZ 2015), (Akter et al.
2013).
(Parasuraman et al. 2005), suggested that the
model should be tested in the context of pure
service. (Akinci et al. 2010) argued that E-S-QUAL
and E-RecS-QUAL (Component of ServQual) are
scales that can be used to measure service quality in
the context of internet banking. Their research was
later adopted by (Tharanikaran et al. 2017), which
was also done on the pure service object. Based on
the background, the purpose of this paper is to
answer whether the ServQual dimension can be used
to measure the quality of mobile-based services
(MyTelkomsel). The second, is Perceived Value
influenced by electronic service quality.
2 PREVIOUS RE SEARCH
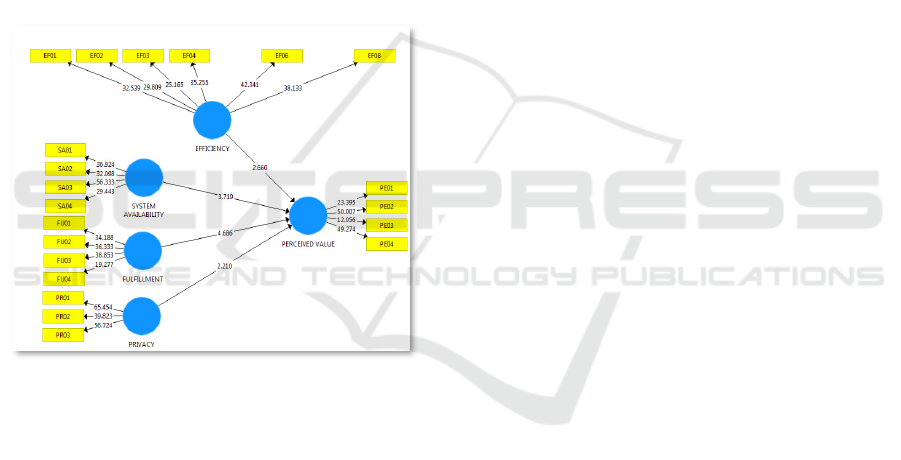
Figure 1: E-S-Qual Conceptual Model/Result
Service quality or SERVQUAL designed to
measure the gap between expectations and customer
perceptions (Parasuraman et al. 1988). (Parasuraman
et al. 2005) argued, that there are seven dimensions
of electronic service quality: efficiency system
availability, fulfilment, privacy (grouped into ES-
QUAL - all stages of customer interaction with
service); Responsiveness, Compensation, and
Contact (grouped into E-RecS-QUAL - to measure
the level of recovery in the event of a service
failure). (Akinci et al. 2010) and (Tharanikaran et
al. 2017) applied the scale in a non-retail context
while (Parasuraman et al. 2005) applied the model
on online retail companies (i.e., Amazon and
Walmart).
This paper adopts the scale for online financial
services, such as internet banking which has less
tangible elements which was developed by
(Tharanikaran et al. 2017). It was hoped that the
scale is appropriate for the characteristics of the
object chosen (myTelkomsel). To test the
nomological validity of ServQual, this paper also
adopts the variable which were used in
(Parasuraman et al. 2005), Perceived Value.
Perceived Value is defined as an evaluation of the
total benefits of a product/services by the customer
(ÇETİNSÖZ 2015). Details regarding the
measurement technique are presented in the
methodology section.
3 METHODOLOGY
The approach used to validate the E-Service Quality
variable on the My Telkomsel application service
refers to (Akinci et al. 2010). The ServQual
dimension was grouped into E-S-Qual and E-Recs-
Qual variables. E-S-Qual variables consist of:
Efficiency, System Availability, Fulfilment, and
Privacy. While E-Recs-Qual variables consist of:
Responsiveness, Compensation, Contact.
For the E-S-Qual scale, all collected respondents
were used. Meanwhile, for the E-Recs-Qual scale,
only uses a number of respondents who has a
specific condition (i.e. who have experienced
problems and were seeking for help from service
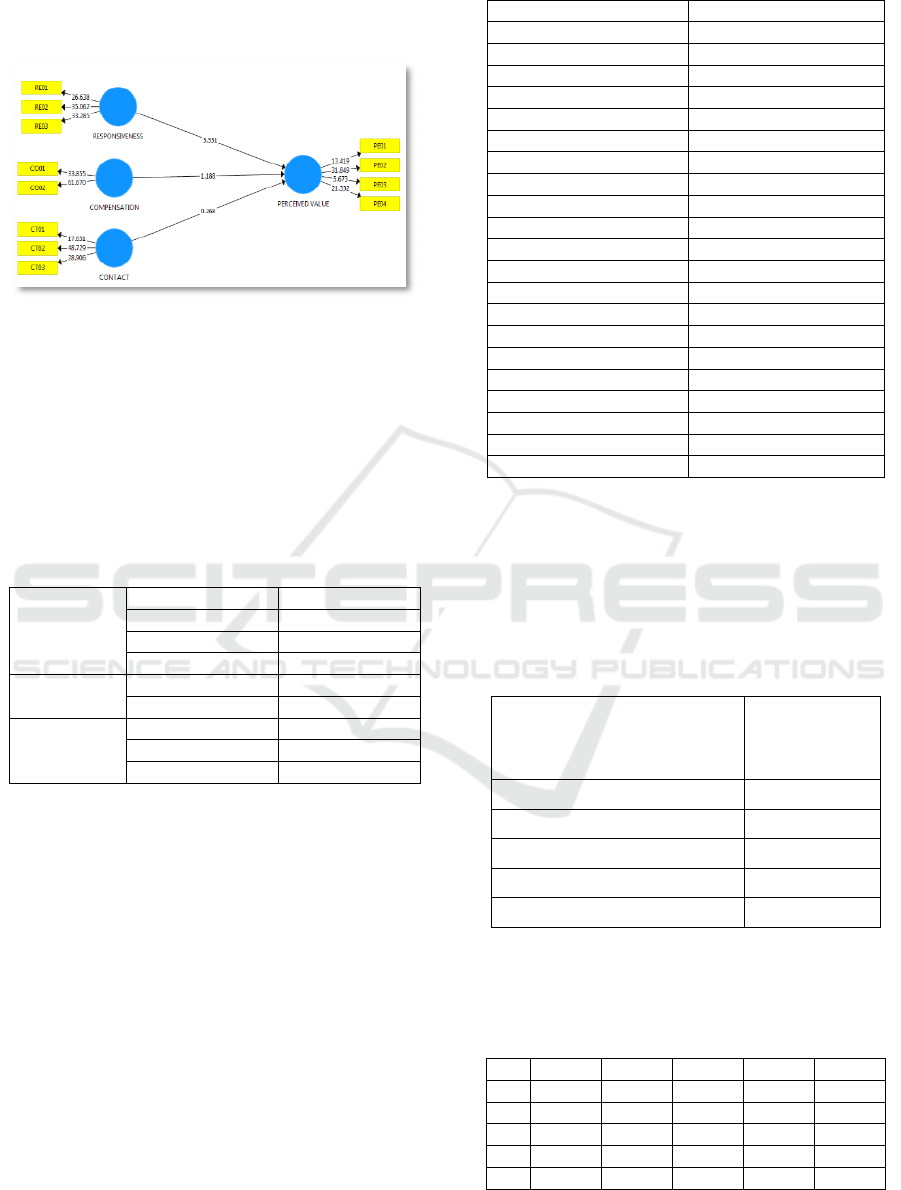
provider to solve these problems). The conceptual
model of this research can be seen in Figure 1 and
Figure 2. Figure 1 is the conceptual model of E-S-
Qual while Figure 2 is the conceptual model of E-
Recs-Qual. Due to limited space, the conceptual
model shown was also the output / test result of the
SmartPLS tools.
Based on (Akinci et al. 2010) and (Parasuraman
et al. 2005) the ServQual scale was grouped into 2
(i.e. E-S-Qual Scale and E-Recs-Qual). Since this
study also intends to conduct a Nomological test
using the Perceived Value variable, the hypothesis
of this study is:
E-S-Qual Scale
H1: Efficiency is considered to have an influence
on Perceived Value
H2: System Availability is considered to have an
influence on Perceived Value
H3: Fulfilment is considered to have an influence
on Perceived Value
H4: Privacy is considered to have an influence on
Perceived Value
E-Recs-Qual scale:
H5: Responsiveness is considered to have an
influence on Perceived Value
Electronic Service Quality and Perceived Value in Mobile based Services
593
H6: Compensation is considered to have an
influence on Perceived Value
H7: Contact is considered to have an influence on
perceived value.
Figure 2. E-Recs-Qual Conceptual Model/Result
4 RESULTS
4.1 Respondent
Total respondent in this study were 523 people, the
sample profile can be seen in table 1.
Table 1: Sample Profile
Age <25 429
25
–
40 32
41-55 10
>55 2
Sex Male 204
Female 319
Occupation Student 71%
Employee 16%
etc 13%
For the E-S-Qual Scale, all of the respondents,
523 people, were used. While for the E-Recs-Qual
scale, the respondents were 115 people (i.e. who
have experienced problems and were seeking for
help to solve these problems).
4.2 E-S-Qual Loading Factor, AVE,
Discriminant Validity.
Section 4.2 describes the results of the validity and
reliability tests of E-S-Qual variables (i.e.
Efficiency, Fulfilment, Privacy, System
Availability).
Table 2: E-S-Qual Loading Factor
Item Loadin
g
Facto
r
Efficienc
y
EF01 0.773
Efficienc
y
EF02 0.767
Efficiency EF03 0.732
Efficiency EF04 0.777
Efficiency EF06 0.812
Efficienc
y
EF08 0.805
Fulfilment FU01 0.805
Fulfilment FU02 0.816
Fulfilment FU03 0.806
Fulfilment FU04 0.728
PerceivedValue PE01 0.733
PerceivedValue PE02 0.834
PerceivedValue PE03 0.623
PerceivedValue PE04 0.847
Privacy PR01 0.884
Privacy PR02 0.874
Privac
y
PR03 0.869
S
y
stemAvailabilit
y
SA01 0.806
S
y
stemAvailabilit
y
SA02 0.762
SystemAvailabilitySA03 0.852
SystemAvailabilitySA04 0.757
All question items were adopted from
(Tharanikaran et al. 2017). Based on the validity
test, items EF05 and EF05 were dropped, then the
data was retested. As can be seen in Table 2, all
items from the Efficiency, Fulfilment, Privacy,
System Availability variables have a value above
0.707, therefore they were considered valid.
Table 3: E-S-Qual AVE
Average
Variance
Extracted
(
AVE
)
EFFICIENCY 0.606
FULFILLMENT 0.623
PERCEIVED VALUE 0.584
PRIVACY 0.767
SYSTEM AVAILABILITY 0.632
Table 3 shows the AVE value of each variable. It can
be seen that all AVE values are above 0.5, thus this result
supports the validity.
Table 4: E-S-Qual Discriminant Validity
EF FU PE PR SA
EF 0.778
FU 0.655 0.789
PE 0.544 0.561 0.764
PR 0.458 0.51 0.419 0.876
SA 0.762 0.644 0.56 0.508 0.795
CESIT 2020 - International Conference on Culture Heritage, Education, Sustainable Tourism, and Innovation Technologies
594

Table 4 shows the value of discriminant validity.
The value of the discriminant validity for each
variable must be above 0.70 and there is no
discriminant validity value from other variables
which were larger. Referring to table 4, all of the
data have met these criteria.
Table 5: E-S-Reliability Test Value
Cronbach’s
Alpha
Composite
Reliabilit
y
Efficienc
y
0.870 0.902
Fulfilment 0.798 0.868
Perceived Value 0.765 0.847
Privac
y
0.849 0.908
System
Availibilit
y
0.806 0.873
Table 5 shows the results of the reliability test.
Almost all values were above 0.8, except for
Fulfilment. This shows that the level of reliability is
considerably good.
4.3 E-Recs-Qual Loading Factor
Section 4.3 specifically addresses E-Req-Qual. The
variables tested were: Compensation, Contact and
Responsiveness. As is the case with E-S-Qual, what
will be tested is the validity and reliability of the
variables.
Table 6: E-Recs-Qual Loading Factor
Ite
m
Loadin
g
Facto
r
Com
p
ensation CO01 0.925
Compensation CO02 0.955
Contact CT01 0.819
Contact CT02 0.921
Contact CT03 0.886
Perceived Value PE01 0.79
Perceived Value PE02 0.859
Perceived Value PE03 0.65
Perceived Value PE04 0.841
Res
p
onsiveness RE01 0.87
Res
p
onsiveness RE02 0.875
Res
p
onsiveness RE03 0.901
Based on table 6, it can be seen that all values
were above 0.707, it can be concluded that all
question items were valid.
Table 7: E-Recs-Qual AVE
Average Variance
Extracted (AVE)
EFFICIENCY 0.884
FULFILLMENT 0.778
PERCEIVED VALUE 0.768
PRIVACY 0.623
SYSTEM AVAILABILITY 0.632
The results of calculating the AVE value are
shown in table 7. In which, all values were above 0.5
so that it can be concluded, that all variables are
valid.
Table 8: E-Recs-Qual Discriminant Validity
CO CT PE RE
CO 0.94
CT 0.334 0.877
PE 0.432 0.36 0.789
RE 0.569 0.602 0.631 0.882
(Note: Co: Compensation, CT: Contact, PE: Perceived
Value, RE: Responsiveness)
Table 8 shows the value of discriminant validity.
The value of the discriminant validity for each
variable must be above 0.70, and there is no
discriminant validity value from other variables that
were larger. Referring to table 8, all data have met
these criteria.
Table 9: E-Recs-Qual Reliability Test Value
Cronbach’s
Al
p
ha
Composite
Reliabilit
y
Com
p
ensation 0.87 0.938
Res
p
onsiveness 0.858 0.913
Contact 0.85 0.908
Perceived Value 0.795 0.867
Table 9 shows the results of the reliability test.
All values (Compensation, Responsiveness and
Contact) were above 0.8. This shows that the level
of reliability is good. After testing the validity and
reliability, the next step is to examine the inner
model.
4.4 Inner Model
The results of the calculation in the form of image /
conceptual models can be seen in Figure 1 and
Figure 2. In the inner model, there are at least two
important things that need to be considered, the R
2
value and hypothesis testing.
Electronic Service Quality and Perceived Value in Mobile based Services
595
Table 10: E-S-Qual R
2
R Square R Square
Adjuste
d
Perceived
Value
0.399 0.395
Based on table 10, E-S-Qual (Efficiency,
Fulfilment, Privacy, System Availability) can
account for about 40% of the Perceived Value. Thus
these results show moderate results, since there are
still 60% of other variables that can explain
Perceived Value.
Table 11: E-Recs-Qual R
2
R Square R Square
Ad
j
uste
d
Perceived
Value
0.407 0.391
Similar results were also given by E-Recs-Qual,
E-Recs-Qual can explain about 40% of Perceived
Value. The results can be referred to in table 11
Table 12: E-S-Qual Hypothesis Test
P Values
Efficienc
y
Perceived Value 0.008
Fulfilment Perceived Value 0.000
Privacy Perceived Value 0.0028
System Availability Perceived
Value
0.000
With regard to hypothesis testing, all variables E-
S-Qual (Efficiency, Fulfilment, Privacy, System
Availability) influencing the perceived value. See
table 12. Different results were shown in Table 13,
that there was only one variable, namely
Responsiveness which affects the perceived value.
Table 13. E-Recs-Qual Hypothesis Test
P Values
Compensation
Perceived Value
0.235
Contact Perceived
Value
0.789
Responsiveness
Perceived Value
0.000
5 DISCUSSIONS
This paper contributes to the research conducted by
(Parasuraman et al. 2005), especially with regard to
E-Recs-Qual. Although there was a challenge to get
respondents for the E-Recs-Qual variable. The
proportion of qualified users to qualify as E-Recs-
Qual respondents (Individual who have experienced
problems and were seeking for help to solve these
problems) is approximately 1 in 5. Therefore, to
obtain a sufficient number of respondents requires
distributing a lot of questionnaires.
All of Parasuraman's E-S-Qual constructs
(efficiency, system availability, fulfillment and
privacy) meet the psychometric levels / values.
However there were two question items that must be
dropped: EF5 and EF5. Regarding the E-Recs-Qual,
all existing constructs / variables are valid and
reliable. These findings can help managers to
allocate existing resources to improve aspects
related to Electronic Service Quality.
The test results also show that the dimensions of
the E-S-Qual (efficiency, system availability,
fulfillment and privacy correlates with Perceived
Value). Whereas, for E-Recs-Qual dimensions, only
the responsiveness dimension was correlated with
Perceived Value. The dimensions of contact and
compensation do not correlate with perceived value.
Discussion regarding the findings will be presented
in the following sub section.
5.1 Efficiency–Perceived Value
Correlation
Efficiency relates to interface design, which allows
customers to easily find what they need. Efficiency
is one of the four variables from the E-S-Qual scale
that has the strongest influence on Perceived Value.
(Parasuraman et al. 2005) argued that the companies
need to give emphasis to this variable. The same
result is also shown in (Akinci et al. 2010) that the
Efficiency and Fulfillment variables show a stronger
direct effect on Perceived Value.
5.2 System Availability–Perceived
Value Correlation
The finding that Availability has a positive effect on
should encourage organizations to pay more
attention to these factors. Since there is a close
relationship between service quality and customer
satisfaction (Ma 2012), (Chavosh et al. 2011), (Ma
and Zhao 2012).
5.3 Fulfilment–Perceived Value
Correlation
Apart from Efficiency, Fulfillment is the second of
the 4 variables from the E-S-Qual scale that has the
strongest influence on Perceived Value. The findings
on the correlation between Fulfilment and Perceived
CESIT 2020 - International Conference on Culture Heritage, Education, Sustainable Tourism, and Innovation Technologies
596

Value are the same as the research results in (Akinci
et al. 2010) and (Parasuraman et al. 2005).
5.4 Privacy–Perceived Value
Correlation
Referring to (Parasuraman et al. 2005), previous
research has argued that Web site privacy may not
be important for more frequent users (Wolfinbarger
and Gilly 2003). However, this study has the same
results as the research conducted by (Parasuraman et
al. 2005), that the perception of privacy does affect
Perceived Value. This result also confirms the need
for companies to increase customer data security and
assure customers that the company can guarantee the
confidentiality of their data.
5.5 E-Recs-Qual Dimensions-Perceived
Value Correlation
The discussion regarding the test results related to
the E-S-Qual dimensions (efficiency, system
availability, fulfilment, privacy) have already been
discussed in subsections 5.1 to 5.4. Section 5.5
describes the test results regarding the dimensions of
the E-Recs-Qual (i.e. responsiveness, contact,
compensation).
This study examined the E-Recs-Qual, by
following the dimensions described in the
(Parasuraman et al. 2005). In his research,
Parasuraman was unable to test these variables since
the number of respondents was inadequate.
In this study, the number of respondents for the E-
Recs-Qual scale was 115 people. In other word, only
115 people out of 523 total respondents had
experienced problems when using the application
and reported the incident.
The responsiveness dimension shows a positive
correlation on perceived value. Thus it shows that
the higher the responsiveness value, the positive
impact it will have on perceived value. However, for
two other dimensions, contact and compensation,
have no correlation with perceived value. (Akinci et
al. 2010) suggested, that mobile-based service users
do not prefer to use the telephone / face-to-face
assistance channel when they face a problem. With
regard to compensation, there is no evidence that it
is correlated with Perceived Value. Based on this,
with regard to customer complaints, mobile-based
service providers must prioritize one main thing,
Responsiveness.
6 CONCLUSIONS
1. The test results, based on questionnaire data
from 523 respondents for E-S-Qual, and 115
respondents for E-Req-Qual show:
Almost all question, except EF05 and EF07,
which were adopted from (Tharanikaran et al.
2017) are valid and reliable. These items of
questions can be used to measure the quality
of mobile-based services.
2. All variables from E-S-Qual (Efficiency,
Fulfilment, Privacy, System Availability) have
an effect on Perceived Value. This could have
the impact that, in order for a customer to
have a good perceived value, there is a need to
taking these variables into account.
3. With regard to E-Rec-Qual (level of recovery
in the event of a service failure), only the
Responsiveness variable affects the perceived
value.
REFERENCES
Akinci S, Atilgan-inan E, Aksoy S. Re-assessment of E-S-
Qual and E-RecS-Qual in a pure service setting. J Bus
Res [Internet]. 2010;63(3):232–40. Available from:
http://dx.doi.org/10.1016/j.jbusres.2009.02.018
Akter S, D’Ambra J, Ray P. Development and validation
of an instrument to measure user perceived service
quality of mHealth. Inf Manag [Internet].
2013;50(4):181–95. Available from:
http://dx.doi.org/10.1016/j.im.2013.03.001
Batagan L. Service Quality Management. Manag Serv
Oper Des Implement. 2013;143–70.
ÇETİNSÖZ BC. The Influence of E-Service Quality on
Customer Perceived Value : A Study on Domestics
Tourists in. Sci Res. 2015;4(1):1265–77.
Chavosh A, Bagherzad A, Hosseinikhah S. Comparative
Analysis of the Degree Holder and Non-Degree
Holder Malaysian Bank Customers ’ Satisfaction with
E-payment Services in Penang-Malaysia. Int J e-
Education, e-Business, e-Management e-Learning.
2011;1(2):103–9.
Furrer O, Yu Kerguignas J, Delcourt C, Gremler DD.
Twenty-seven years of service research: a literature
review and research agenda. J Serv Mark.
2020;34(3):299–316.
Kaatz C. Retail in my pocket– replicating and extending
the construct of service quality into the mobile
commerce context. J Retail Consum Serv [Internet].
2020;53(October 2019):101983. Available from:
https://doi.org/10.1016/j.jretconser.2019.101983
Kusdinar P, Ariyanti M. The influence of e-service quality
on the data package buying experience in Telkomsel.
In 2020. p. 27–30.
Le VH, Nguyen HTT, Nguyen N, Pervan S. Development
Electronic Service Quality and Perceived Value in Mobile based Services
597

and validation of a scale measuring hotel website
service quality (HWebSQ). Tour Manag Perspect
[Internet]. 2020;35(September 2019):100697.
Available from:
https://doi.org/10.1016/j.tmp.2020.100697
Li Y, Shang H. Service quality, perceived value, and
citizens’ continuous-use intention regarding e-
government: Empirical evidence from China. Inf
Manag [Internet]. 2020;57(3):103197. Available from:
https://doi.org/10.1016/j.im.2019.103197
Ma Z. Assessing serviceability and reliability to affect
customer satisfaction of internet banking. J Softw.
2012;7(7):1601–8.
Ma Z, Zhao J. Evidence on e-banking customer
satisfaction in the China commercial bank sector. J
Softw. 2012;7(4):927–33.
Mendoza MCO, Santos RRC, Magdaraog JEH.
Assessment of E-Service Quality Dimensions and Its
Influence on Customer Satisfaction: A Study on the
Online Banking Services in the Philippines. 2020
IEEE 7th Int Conf Ind Eng Appl ICIEA 2020.
2020;1076–81.
Mujinga M. Online Banking Service Quality: A South
African E-S-QUAL Analysis [Internet]. Ieee.
Springer, Cham; 2020. Available from:
https://doi.org/10.1007/978-3-030-44999-5_19
Parasuraman A, Berry LL, Zeithaml VA. SERVQUAL: A
multiple-item scale for measuring consumer
perceptions of service quality. J Retail.
1988;64(1):12–40.
Parasuraman A, Zeithaml VA, Malhotra A. E-S-QUAL a
multiple-item scale for assessing electronic service
quality. J Serv Res. 2005;7(3):213–33.
Patten E, Ozuem W, Howell K. Service quality in
multichannel fashion retailing: an exploratory study.
Inf Technol People. 2020;33(4):1327–56.
Pengguna P pd., Indonesia I. Laporan survei internet apjii
2019 – 2020. 2020;2020.
Rahahleh A, Al-Nsour S, Moflih M, Alabaddi Z, Al-
Nassar B, Al-Nsour N. The influence of electronic
service quality on relationship quality: Evidence from
tourism industry. Manag Sci Lett. 2020;10(12):2759–
68.
Rita P, Oliveira T, Farisa A. The impact of e-service
quality and customer satisfaction on customer
behavior in online shopping. Heliyon [Internet].
2019;5(10):e02690. Available from:
https://doi.org/10.1016/j.heliyon.2019.e02690
Tharanikaran V, Sritharan S, Thusyanthy V. Service
Quality and Customer Satisfaction in the Electronic
Banking. Int J Bus Manag. 2017;12(4):67.
Wolfinbarger M, Gilly MC. eTailQ: Dimensionalizing,
measuring and predicting etail quality. J Retail.
2003;79(3):183–98.
CESIT 2020 - International Conference on Culture Heritage, Education, Sustainable Tourism, and Innovation Technologies
598
