
Data Mining in Healthcare to Predict Cesarean Delivery Operations
using a Real Dataset
Mona M. Jamjoom
a
Department of Computer Sciences, College of Computer and Information Sciences,
Princess Nourah bint Abdulrahman University, Riyadh, Saudi Arabia
Keywords: Data Mining, Prediction, Healthcare, Cesarean Delivery, Classifier.
Abstract: In the digital era, the data revolution has become a significant part of every sector in society. The healthcare
sector is one of the most vital parts of this revolution, as a massive amount of data is available, making
medical case-related decisions critical. Hence, data-mining (DM) techniques are utilized to extract vital
information and knowledge for decision-making. This study analysed data from cesarean delivery cases. A
cesarean delivery operation generally takes place when there are challenges to normal delivery for several
reasons or where normal delivery could cause potential complications in the future. In this paper, we have
empirically examined several data-mining techniques for predicting the safest delivery type for both mother
and child, using real cases taken from a health center in Tabriz. In addition, we used a cross-validation (CV)
approach to evaluate the applied prediction models to ensure more realistic and reliable results. The naïve
Bayesian (NB) classifier outperformed the other selected classifiers, with an accuracy rate of 65%.
Available cesarean delivery operation data are rare, and increasing the cesarean case data is essential for
better prediction.
a
https://orcid.org/0000-0001-9149-2810
1 INTRODUCTION
Recently, the advantages of data mining (DM)
(Soleimanian et al., 2012) have been recognized in
all disciplines and sectors, making DM a fixation in
every field. DM helps extract useful information
from huge data, as time and complexity are no
longer an obstacle to achieve tasks. Health centers
are collecting a massive amount of information
about patients in order to raise health care quality by
offering better services and medications that ensure
patients’ survival (Soleimanian et al., 2012), (Malik
et al., 2018).
In the medical field, DM is an emerging research
area. It is used for diagnosing (Malik et al., 2018)
various diseases, such as breast cancer (Kumar et al.,
2020), heart disease (Shammari et al., 2020),
(Cherian & Bindu, 2017), lung cancer (Lynch et al.,
2017), Parkinson’s (Ramani & Sivagami, 2011),
Alzheimer’s (Tanveer et al., 2020)…etc, by feeding
symptoms into the prediction model, which then
predicts if the patient will test positive or negative.
DM is also used for prognosis, treatment
planning (Malik et al., 2018) and medical images
and statistical data, which are examined for medical
decisions.
In the late 19
th
century, a dramatic increase
occurred throughout the world in the rate of cesarean
delivery operations (Rokach & Maimon, 2005).
The World Health Organization (WHO) defined
trends in cesarean delivery operations through the
years (i.e., 1983–2017; see Figure 1) (World Health
Global Health Observatory Data Repository, 2010).
Figure 2 shows the density of the rate of cesarean
delivery operations per country (Ana Pilar Betrán,
Jianfeng Ye, Anne-Beth Moller, Jun Zhang, A.
Metin Gülmezoglu, 2016).
Meanwhile, medical committees and
governments have sought to reduce the rates of
cesarean delivery operations by introducing
policies that promote vaginal delivery, often with
little focus on the potential consequences of these
recommendations (Dietz HP, 2016).
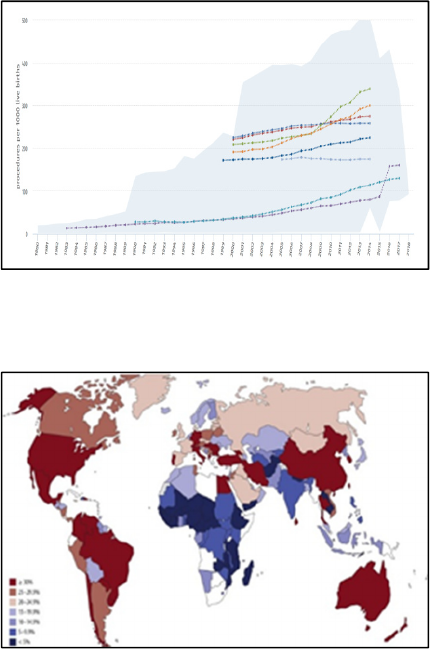
Figure 1: The rate of cesarean deliveries over the years
(World Health Organization global health observatory data
repository, 2010).
Figure 2: the rate of cesarean deliveries by country (Ana
Pilar Betrán, Jianfeng Ye, Anne-Beth Moller, Jun Zhang,
A. Metin Gülmezoglu, 2016).
Doctors usually desire a safe delivery for a
pregnant woman, unless an urgent condition forces
the need for a cesarean delivery. Many situations
call for cesarean delivery, some of which are
serious, including the occurrence of critical
situations or the avoidance of serious problems,
while others have no medical indications (Gee et
al., 2020), (Hernández-Martínez et al., 2016),
(Bailit et al., 2004). The ongoing improvement of
medical technology have made surgeries safer than
before, but the risk of such decisions remains a
hazard for both mother and baby (Gee et al., 2020)
and is not encouraged by doctors. In serious cases,
such decisions should be based on clear and
potentially life-threatening indications.
Furthermore, deciding in advance instead of
making a sudden decision will help prepare the
patient, clinic, and hospital.
In this paper, we recognize such a need and
believe in the importance of having a medical staff
that is aware of the mode of delivery in advance for
the safety of both mother and baby, especially
when serious indicators are present. Therefore, we
aim to predict the delivery type (i.e., cesarean or
not) based on significant factors that affect the
mother’s health, like blood pressure and heart
status. We use the cesarean dataset from the Tabriz
health center (Soleimanian et al., 2012) and employ
different prediction models to train the dataset,
such as naïve Bayesian (NB) (Parlina et al., 2019),
support vector machine (SVM) (Yao et al., 2013),
k-nearest neighbor (kNN) (Deng, Z., Zhu, X.,
Cheng, D., Zong, M., & Zhang, 2016), OneR
(Jamjoom, 2020), decision tree-J48 (DT-J48)
(Sharma et al., 2013) and decision tree-random
forest (DT-RF) (Ali et al., 2012). These classifiers
have used cross-validation (CV) with a 10-fold
approach (Geisser, 1975) to test and evaluate the
accuracy of the prediction and other selected
evaluation metrics for each of them.
The rest of the paper is organized as follows:
Section 2 introduces related work, Section 3
describes the methodology and its results, and
Section 4 concludes the study.
2 RELATED WORK
Many studies in the healthcare domain have used
DM techniques to predict cesarean delivery
operations. For example, (Soleimanian et al., 2012)
used a decision tree (DT) classifier as a prediction
model. In (Soleimanian et al., 2012), the authors
used the extension of Quinlan’s induction decision
tree (ID3) (Quinlan, 1986) which is a C4.5
algorithm, due to its ability to build different trees
with different strategies and high accuracy in
diagnosis. They developed a pregnancy dataset
collected from the Tabriz health center and
produced a model with an accuracy rate of
(86.25%). The complexity of the tree generated
was large; its depth was 31, and it had 21 leaves.
Large trees are costly and may yield poor
generalizations (Rokach & Maimon, 2005). The
authors recommended increasing the dataset and
adding more related attributes in order to improve
accuracy. Similarly, (Amin & Ali, 2018) used the
same dataset as (Soleimanian et al., 2012) but
different prediction models—namely, SVM, RF,
NB, kNN, and logistic regression (LR)—resulting
in accuracies of 76.3%, 95%, 76.3%, 95%, and
77.5%, respectively. The results showed that RF
and kNN were the best in performance. The main
concern with the study is the use of the whole
dataset for training and testing at the same time, as
the results are likely to be unrealistic because data
must be tested using unknown cases to the
classifier or the result will be extremely positive
(Frank et al., 2016).
In (Dulitzki et al., 1998) the researchers created a
prediction model using linear regression (LR) to
predict the cesarean delivery rate and its factors for
pregnant women aged 44 years and above. They
identified several attributes that were significant for
accurate prediction, including age, parity, and
pregnancy difficulties. The study emphasized the
high risk of cesarean delivery when the mother was
at least 44 years old.
The study of (Sims et al., 2000) applied half of the
samples on each DT rule-based and LR classifiers to
train a predictive model for cesarean delivery
prediction and kept the remaining samples as a
testing set. The two classifiers used similar
attributes. Six different DT were examined. The
authors concluded that both DT and LR had
comparable results, but DT was simpler and better at
handling missing values. Moreover, both algorithms
were consistent in terms of determining the
important risk factors.
A study to explore the various changes in the
causes of cesarean delivery was conducted by
(Bailit et al., 2004), using a dataset collected from
all birth transactions in North Carolina in 1995,
1997, 1999, and 2001 to create a model using an
LR algorithm for cesarean delivery prediction. The
study identified an increasing trend in the rate of
cesarean delivery due to changes in clinician and
hospital behavior as well as a new demand for
elective cesarean delivery. The model used various
risk factors as attributes, including age, race,
gestational age, multiple pregnancy, complications,
and severity of medical conditions. The model
found that complications, nulliparity, and multiple
gestations were the most significant attributes. The
authors recommended further investigation about
the causes of cesarean delivery to explain the
increase. In the same context, more investigations
regarding the risk factors of cesarean delivery were
discovered by (Hernández-Martínez et al., 2016).
The authors used a multivariate analysis with
binary LR and receiving operating characteristics
(ROC) metric to predict power determination. The
values of maternal, obstetrics, fetal, and
gynecologist attributes were collected from one of
Spain’s hospitals for three years, from 2009 to
2011, and were used to train the predictive models.
The models succeeded in discriminating the risk of
cesarean delivery; such results can be helpful in
decision making.
More studies on the risk factors of cesarean
delivery were done by (Schiff & Rogers, 1999)
particularly on American Indian women in New
Mexico, who have a smaller cesarean delivery rate
compared to other populations in the United States.
The authors believed that ethnicity had an effect on
this difference. They studied demographic, prenatal,
and intrapartum factors to detect risk factors for
cesarean delivery but found nothing specifically
different with American Indian women in New
Mexico, who have the same risk factors for cesarean
delivery as other populations.
The authors in study (Burke et al., 2017)
assessed five attributes affecting the risk of cesarean
delivery and built a predicting model (i.e., multiple
LR analysis and mathematical modelling) to detect a
pregnancy threatened by an unplanned cesarean
delivery. Such models help improve the service
quality of the hospital and reduce patient risk.
Finally, (Al Housseini et al., 2009) compared
two prediction models, LR and neural network
(NN), to predict the delivery mode for nulliparas.
They used some maternal and fetal clinical attributes
of obstetric patients from 2005 to 2007. They
determined that NN was slightly better in
performance as it achieved an accuracy of 53%,
which was higher than LR and what has been
achieved by prior studies. Generally, NNs are
successful when used for clinical problems that can
be solved by mathematical methods and can be
improved by practice; their only limitation is that
they do not address the size of the effect for
individual variables.
3 METHODOLOGY
The dataset for conducting this study was based on
the existing dataset collected by the healthcare
center located in Tabriz (Soleimanian et al., 2012).
The dataset contained information on 80 real cases;
each case had five values for the five most important
attributes for the binary classification problem and
the cesarean delivery problem. Table 1 summarizes
the dataset’s attributes. The analysis was performed
using Waikato Environment for Knowledge
Analysis (WEKA) software (Waikato, 2018),
(Garner, 1995) to train and test the dataset on
different prediction models—specifically, NB
(Parlina et al., 2019), SVM (Yao et al., 2013), kNN
(Deng, Z., Zhu, X., Cheng, D., Zong, M., & Zhang,
2016) where k=3, OneR (Jamjoom, 2020), DT-J48
(Sharma et al., 2013) and DT-RF (Ali et al., 2012).
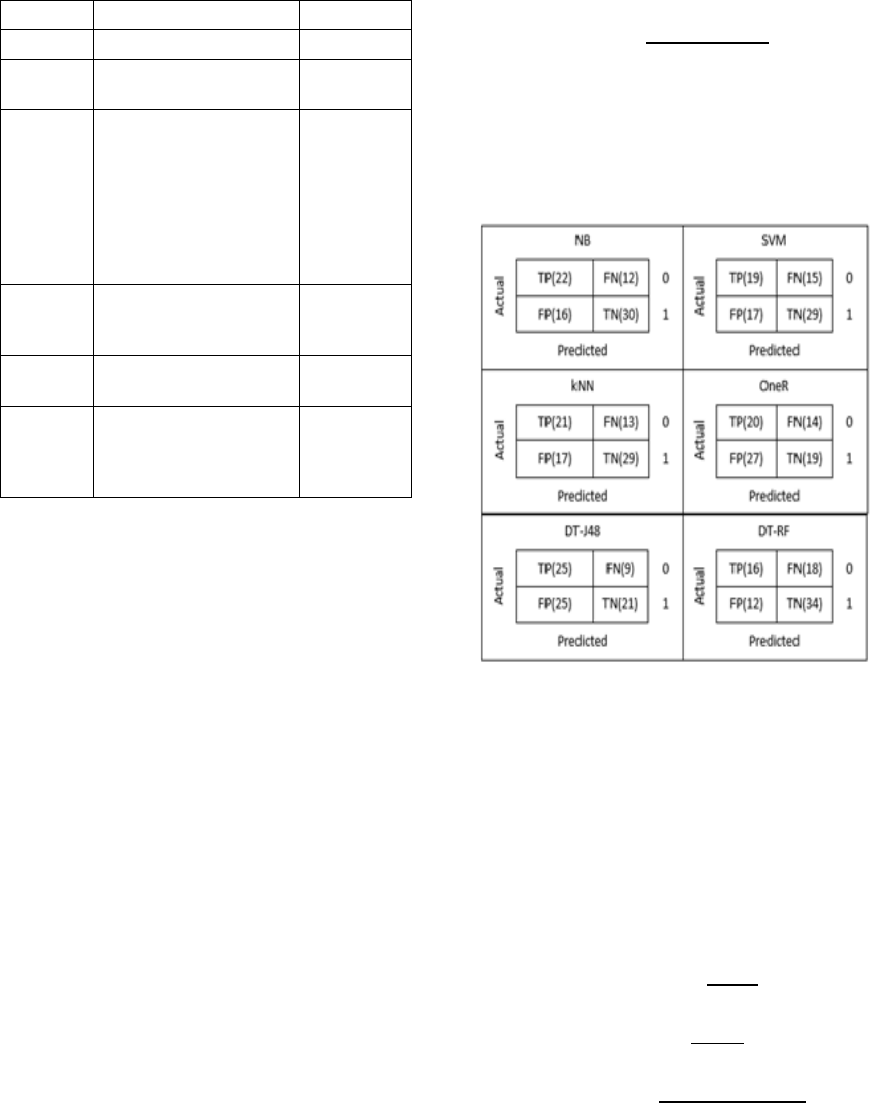
Table 1: Attributes description of cesarean dataset.
Attribute Description Val ue
Age
Maternal age numeric
Delivery
number
Number of births numeric
Delivery
time
The normal delivery time
for the pregnant woman
after completing 37
weeks (i.e., timely).
Delivered before that
considered premature,
after 40 weeks
considered latecomer
Premature,
Timely,
Latecomer
Blood of
Pressure
Measurement of Blood
pressure
Low,
Normal,
High
Heart
Problem
Heart status of the
pregnant woman
Apt, Inept
Cesarean
The classification of the
pregnant woman to
deliver with cesarean
operation or vaginal
yes, no
3.1 Experiment Results
To test and validate the trained models, we used
CV with a k-folds approach (Geisser, 1975), and
made k equal to 10. CV was one technique used to
evaluate the performance of the prediction model
on a certain dataset and estimate the error of the
classifier (Anguita et al., 2012), (Wong, 2017). It
divided the dataset into equalized number of k
subsets, then (k-1) subsets were repeatedly trained
and the remaining subset used to validate the
performance of the classifier (Geisser, 1975),
(Anguita et al., 2012). In other words, it resampled
the training and test subsets in each training
iteration, and the final accuracy achieved was the
average of the total k accuracies for all iterations.
The test subset contained instances not seen by the
model during the training phase, which can help
obtain a reliable estimation of the classifier
performance (Wong, 2017) as CV’s approach helps
reduce generalization errors and variance (Anguita
et al., 2012). CV gives a realistic estimation
because, in reality, the model predicts real cases
that the model may have never seen in the training
phase. Using the whole dataset for training and
testing at the same time may generate unrealistic
results that are extremely positive and prone to
overfitting (Mitchell, 1997).
Furthermore, we used the accuracy of each
classifier that shows the rate of cases predicted
correctly to compare between the models. Accuracy
was calculated using equation 1:
Accuracy =
(1)
where TP, TN, FP, and FN are the elements of the
confusion matrix (Basu & Murthy, 2012), (Fawcett,
2004) and the base for calculating many metrics for
classifier evaluation. Figure 3 shows the confusion
matrix for all applied classifiers in this study along
with actual values for TP, TN, FP, and FN.
Figure 3: The confusion matrix for the applied classifiers.
We also calculated other evaluation metrics for the
applied classifiers, such as precision, recall, f-
measure, correctly classified instances, misclassified
instances, total number of instances. and time
consumed to build the model. We used equations 2,
3, and 4 to calculate precision (i.e., percentage of
correctly observed positive cases), recall (i.e.,
percentage of correctly predicted real positive cases)
and f-measure, respectively. The results are
presented in Table 2.
Precision =
(2)
Recall =
(3)
F-measure =
∗( ∗ )
( )
(4)
Moreover, we evaluated the strength of the
relationship between the class and other attributes—
that is, the correlation (Trabelsi et al., 2017) between
the class and each attribute in the dataset. Attributes
with a high positive value indicated the influence of
the class value. Table 3 shows the correlation values
for each attribute. A strong relationship emerged
between the class and the “heart problem,” which
means that the pregnant woman’s heart status has a
strong influence when making decisions regarding
the need for a cesarean delivery or not.
Table 2: The performance evaluations of the applied
classifiers.
Metric NB SVM kNN OneR DT-J48 DT-RF
Accuracy
65 % 60 % 62.5 % 48.75 % 57.5 % 62.5 %
Precision
0.657 0.603 0.632 0.512 0.615 0.619
Recall
0.650 0.600 0.625 0.488 0.575 0.625
F-Measure
0.652 0.601 0.627 0486 0.571 0.618
Correctly
Classified
Instances
52 48 50 39 46 50
Misclassified
Instances
28 32 30 41 34 30
Total
Number of
Instances
80 80 80 80 80 80
Time to build
the model
(secs.)
0.03 0.33 0 0 0.08 0.46
Table 3: Attributes analysis.
Attribute Correlation
Age
0.1001
Delivery number
0.0657
Delivery time
0.151
Blood of Pressure
0.2393
Heart Problem 0.3526
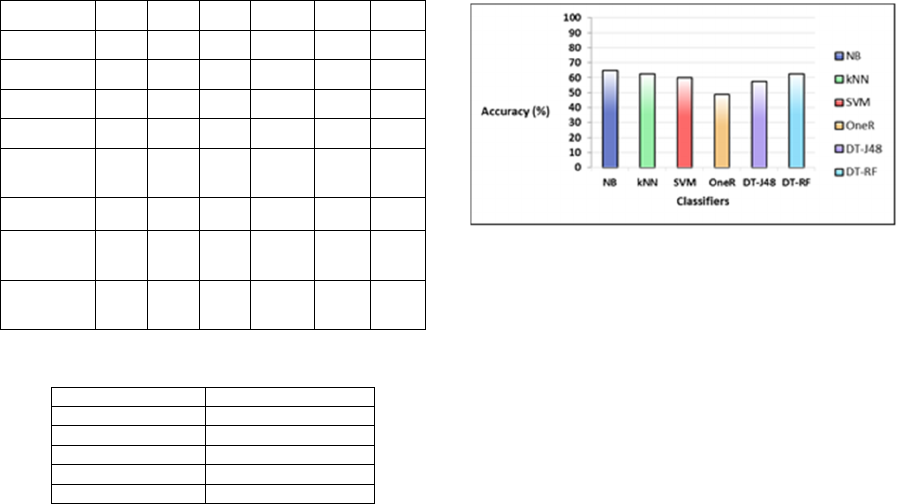
3.2 Results and Discussion
This section discusses the experimental results and
how each classifier was accurately applied to predict
the cesarean delivery. Table 2 shows that NB
outperformed all the applied classifiers, as it was
able to correctly classify the unseen cases with an
average accuracy rate of 65%; this was followed by
kNN and DT-RF, with an average accuracy of
62.5%, and SVM, DT-J48, and OneR, with 60%,
57.5%, and 48.75%, respectively (see Figure 4).
Regardless, NB was the best classifier among the
applied classifiers, although the difference between
the applied classifiers was not large. If we do not
consider the OneR classifier, the difference is only
about (7.5%).
Comparing these results with those of
(Soleimanian et al., 2012) and (Amin & Ali, 2018),
the current study achieved less accuracy than the
other studies, but using the CV approach and
evaluating the performance of the classifiers based
on unseen cases yields realistic and reliable results,
unlike in the other studies, which based their
evaluations only on training sets. However, the low
accuracy can be due to the limited number of cases
for training and testing. Enriching the dataset with
more real cases will improve the generalization and,
thus, the performance of the classifiers. The values
of the recall in all applied classifiers also reflects the
insufficiency in the datasets available for accurate
prediction. Therefore, enriching it is necessary.
Figure 4: The average accuracy of the applied classifiers.
Moreover, the values of precision among the
applied classifiers were very close to each (except
OneR). Precision usually explains how much the
predictive power of the classifier is.
The attribute analysis presented in Table 3
indicates that the “heart problem” attribute is the
strongest attribute correlated with the class attribute,
with a correlation value equal to 0.35. Yet the value
is far from the optimal correlation’s value of 1. This
opens a new research area to investigate to
determine the most significant factor (i.e., attribute)
that highly affects cesarean delivery prediction.
Using the CV approach to evaluate the classifiers
by testing each of them with unseen cases gives
strength and reliability to the study, as this is often
the case in reality. CV decreases the variance in the
prediction model over the k subsets.
4 CONCLUSIONS
DM is useful in healthcare organizations, especially
when critical decisions are needed for the safety of
the mother and child, such as when a doctor decided
to conduct a cesarean delivery instead of a vaginal
delivery. Predicting the delivery mode within an
appropriate amount of time is important so both
medical staff and the mother will be appropriately
prepared. In this study, we used the medical
information of 80 pregnant women from the health
center in Tabriz to predict the delivery mode using
several classifiers: NB, SVM, kNN, OneR, DT-J48,
and DT-RF. The results showed that NB achieved
the best accuracy, with an average accuracy rate of
65%. The results are reliable and close to realistic
due to using the CV approach when evaluating the
classifier performance. The CV approach uses
unseen cases to test the classifier, which is more
realistic. Future research should improve the
accuracy of the existing dataset by enriching the
dataset with more real cases. Moreover, more
attributes that are significant in such prediction
should be investigated.
ACKNOWLEDGEMENTS
This research was funded by the Deanship of
Scientific Research at PNU through the Fast-Track
Research Funding Program. The authors are very
grateful for all the support they have received in
conducting this research and making it successful.
REFERENCES
Al Housseini, A., Newman, T., Cox, A., & Devoe, L. D.
(2009). Prediction of risk for cesarean delivery in term
nulliparas: a comparison of neural network and
multiple logistic regression models. American Journal
of Obstetrics and Gynecology, 201(1), 113.e1-113.e6.
https://doi.org/10.1016/j.ajog.2009.05.001
Ali, J., Khan, R., Ahmad, N., & Maqsood, I. (2012).
Random Forests and Decision Trees. International
Journal of Computer Science Issues, 9(5), 272–278.
Amin, M. Z., & Ali, A. (2018). Performance Evaluation of
Supervised Machine Learning Classifiers for
Predicting Healthcare Operational Decisions. In Wavy
AI Research Foundation.
Ana Pilar Betrán, Jianfeng Ye, Anne-Beth Moller, Jun
Zhang, A. Metin Gülmezoglu, M. R. T. (2016). The
Increasing Trend in Caesarean Section Rates: Global,
Regional and National Estimates: 1990-2014. PLoS
One.
Anguita, D., Ghelardoni, L., Ghio, A., Oneto, L., &
Ridella, S. (2012). The ‘K’ in K-fold cross validation.
ESANN 2012 Proceedings, 20th European
Symposium on Artificial Neural Networks,
Computational Intelligence and Machine Learning,
April, 441–446.
Bailit, J. L., Love, T. E., & Mercer, B. (2004). Rising
cesarean rates: Are patients sicker? American Journal
of Obstetrics and Gynecology, 191(3), 800–803.
Basu, T., & Murthy, C. (2012). A Feature Selection
Method for Improved Document Classification. In
International Conference on Advanced Data Mining
and Applications, 296–305.
Burke, N., Burke, G., Breathnach, F., McAuliffe, F.,
Morrison, J. J., Turner, M., Dornan, S., Higgins, J. R.,
Cotter, A., Geary, M., McParland, P., Daly, S., Cody,
F., Dicker, P., Tully, E., & Malone, F. D. (2017).
Prediction of cesarean delivery in the term nulliparous
woman: results from the prospective, multicenter
Genesis study. American Journal of Obstetrics and
Gynecology, 216(6), 598.e11.
Cherian, V., & Bindu, M. S. (2017). Heart Disease
Prediction Using Naïve Bayes Algorithm and Laplace
Smoothing Technique. International Journal of
Computer Science Trends and Technology, 5(2), 68–
73.
Deng, Z., Zhu, X., Cheng, D., Zong, M., & Zhang, S.
(2016). Efficient kNN classification algorithm for big
data. Neurocomputing, 195, 143–148.
Dietz HP, C. S. (2016). Toward normal birth-but at what
cost? American Journal of Obstetrics and Gynecology,
215(4), 439–444.
Dulitzki, M., Soriano, D., Schiff, E., Chetrit, A.,
Mashiach, S., & Seidman, D. S. (1998). Effect of very
advanced maternal age on pregnancy outcome and rate
of cesarean delivery. Obstetrics and Gynecology,
92(6), 935–939.
Fawcett, T. (2004). ROC graphs: Notes and practical
considerations for researchers. Machine Learning,
31(1), 1–38.
Frank, E., Hall, M. A., & Witten, I. H. (2016). The WEKA
Workbench. Online Appendix. Data Mining: Practical
Machine Learning Tools and Techniques, 128.
Garner, S. R. (1995). WEKA: The Waikato Environment
for Knowledge Analysis. Proc New Zealand Computer
Science Research Students Conference, 57–64.
https://www.cs.waikato.ac.nz/ml/weka/
Gee, M. E., Dempsey, A., & Myers, J. E. (2020).
Caesarean section: techniques and complications.
Obstetrics, Gynaecology and Reproductive Medicine,
30(4), 97–103.
Geisser, S. (1975). The predictive sample reuse method
with application. Journal of the American Statistical
Association, 70(350), 320–328.
Hernández-Martínez, A., Pascual-Pedreño, A. I., Baño-
Garnés, A. B., Melero-Jiménez, M. R., Tenías-Burillo,
J. M., & Molina-Alarcón, M. (2016). Predictive model
for risk of cesarean section in pregnant women after
induction of labor. Archives of Gynecology and
Obstetrics, 29(3), 529–538.
Jamjoom, M. (2020). The pertinent single-attribute-based
classifier for small datasets classification. International
Journal of Electrical and Computer Engineering
(IJECE), 10(3), 3227–3234. https://doi.org/10.11591/
ijece.v10i3.pp3227-3234
Kumar, V., Mishra, B. K., Mazzara, M., Thanh, D. N. H.,
& Verma, A. (2020). Prediction of Malignant &
Benign Breast Cancer: A Data Mining Approach in
Healthcare Applications. Advances in Data Science
and Management, 435–442. http://arxiv.org/abs/
1902.03825
Lynch, C. M., Abdollahi, B., Fuqua, J. D., de Carlo, A. R.,
Bartholomai, J. A., Balgemann, R. N., van Berkel, V.
H., & Frieboes, H. B. (2017). Prediction of lung
cancer patient survival via supervised machine
learning classification techniques. International
Journal of Medical Informatics, 108(April 2016), 1–8.
https://doi.org/10.1016/j.ijmedinf.2017.09.013
Malik, M. M., Abdallah, S., & Ala’raj, M. (2018). Data
mining and predictive analytics applications for the
delivery of healthcare services : a systematic literature.
Annals of Operations Research, 270(1–2), 287–312.
Mitchell, T. (1997). Machine Learning. McGraw Hill.
Parlina, I., Yusuf Arnol, M., Febriati, N. A., Dewi, R.,
Wanto, A., Lubis, M. R., & Susiani. (2019). Naive
Bayes Algorithm Analysis to Determine the
Percentage Level of visitors the Most Dominant Zoo
Visit by Age Category. Journal of Physics: Conference
Series, 1255(1). https://doi.org/10.1088/1742-6596/
1255/1/012031
Quinlan, J. (1986). Induction of decision trees. Machine
Learning, 81–106.
Ramani, R. G., & Sivagami, G. (2011). Parkinson Disease
classification using data mining algorithms.
International Journal of Computer Applications, 32(9),
17–22.
Rokach, L., & Maimon, O. (2005). Top-down induction of
decision trees classifiers - A survey. IEEE
Transactions on Systems, Man and Cybernetics Part
C: Applications and Reviews, 35(4), 476–487.
https://doi.org/10.1109/TSMCC.2004.843247
Schiff, M., & Rogers, C. (1999). Factors predicting
cesarean delivery for American Indian women in New
Mexico. Birth, 26(4), 226–231.
Shammari, A. Al, Hadeaf, H. Al, & Zardi, H. (2020).
Prediction of heart diseases (PHDs) based on multi-
classifiers. International Journal of Advanced
Computer Science and Applications, 11(5), 230–236.
https://doi.org/10.14569/IJACSA.2020.0110531
Sharma, G., Bhargava, R., & Mathuria, M. (2013).
Decision Tree Analysis on J48 Algorithm.
International Journal of Advanced Research
InComputer Science and Software Engineering, 3(6),
1114–1119. https://www.academia.edu/4375403/
Decision_Tree_Analysis_on_J48_Algorithm_for_Data
_Mining
Sims, C. J., Meyn, L., Caruana, R., Rao, R. B., Mitchell,
T., & Krohn, M. (2000). Predicting cesarean delivery
with decision tree models. American Journal of
Obstetrics and Gynecology, 183(5), 1198–1206.
Soleimanian, F., Mohammadi, P., & Hakimi, P. (2012).
Application of Decision Tree Algorithm for Data
Mining in Healthcare Operations : A Case Study. Int J
Comput Appl, 52(6), 21–26.
Tanveer, M., Richhariya, B., Khan, R. U., Rashid, A. H.,
Khanna, P., Prasad, M., & Lin, C. T. (2020). Machine
learning techniques for the diagnosis of alzheimer’s
disease: A review. ACM Transactions on Multimedia
Computing, Communications and Applications, 16(1),
1–35. https://doi.org/10.1145/3344998
Trabelsi, M., Meddouri, N., & Maddouri, M. (2017). A
New Feature Selection Method for Nominal Classifier
based on Formal Concept Analysis. Procedia
Computer Science, 112, 186–194. https://doi.org/
10.1016/j.procs.2017.08.227
Waikato, U. of. (2018). WEKA: The Waikato
Environment for Knowledge Acquisition.
Wong, T. T. (2017). Parametric methods for comparing
the performance of two classification algorithms
evaluated by k-fold cross validation on multiple data
sets. Pattern Recognition, 65, 97–107.
http://dx.doi.org/ 10.1016/j.patcog.2016.12.018
World Health Organization global health observatory data
repository. (2010). World Health Organization.
Yao, Y., Liu, Y., Yu, Y., Xu, H., Lv, W., Li, Z., & Chen,
X. (2013). K-SVM: An effective SVM algorithm
based on K-means clustering. Journal of Computers
(Finland), 8(10), 2632–2639. https://doi.org/10.4304/
jcp.8.10.2632-2639
