
Effect of Service Failure on Ferry Passenger Switching Behavior: The
Role of Dissatisfaction
Shania Melinda, Sri Zuliarni
Applied Business Administration, Politeknik Negeri Batam, Jl. Ahmad Yani, Batam, Indonesia
Keywords: Service Failures, Brand Switching Behavior, Customer Dissatisfaction.
Abstract: This study examines the effect of Service Failures on Brand Switching Behavior through Customer
Dissatisfaction (Studies in PT. XYZ Ferry Passengers). Respondents from this study are passengers departing
from Batam to Johor who have used the PT. XYZ Ferry at least 2 times and have an age of 17 years and
above. The population in this study was PT. XYZ Ferry passengers with a sample of 186 respondents.
The sampling technique here uses the Purposive Sampling method with the Slovin formula. In this study,
data were collected manually through a questionnaire given directly to respondents. The data analysis method
used is Path Analysis with a significance level of 0.05. The results of this study are that service failures affect
brand switching behavior, service failures affect customer dissatisfaction, customer dissatisfaction affects
brand switching behavior, and service failures affect brand switching behavior through customer
dissatisfaction.
1 INTRODUCTION
1.1 Research Background
Nowadays the competition in the passenger ship
business in Batam is getting tougher. Whether it's a
ship that crosses from one island to another or ships
that cross between countries. This happens because
Batam has a strategic location that is close to various
islands and also with neighbouring countries such as
Singapore and Malaysia. There are many passenger
ship companies in Batam, so this business
competition cannot be avoided. At present, there are
various types of ship crossing routes in Batam. One
of the routes is the crossing from Batam to Stulang
Laut (Johor Bahru, Malaysia). One of the passenger
ship companies that have a route from Batam to
Stulang Laut (Johor Bahru, Malaysia) is PT. XYZ.
According to Hammer (2004), the background on
the business canvas has now been reversed where
customers are now in the foreground and the
company has been moved to the background. So,
customers are the center of good business in the form
of products or services. Today's business world has
been dominated by customers, so that customers are
no longer adjusting to the products or services
offered. However, companies must adapt to
customers by providing solutions to customer needs.
Then, it is also said that companies that remain self-
centred and not customer-centred cannot survive.
Now is an era of choice, where every customer
can choose and consider the product or service they
have to use because there are a variety of choices
offered. This could be one of the factors switching
customers to other brands that might result from
dissatisfaction with the company. Brand switching
behavior according to Hawkins & Mothersbaugh
(2010) is the result of customer dissatisfaction with a
product or service that causes customers to stop using
a product or service on a brand and replace it with
another brand. Factors that influence the intention to
switch brands according to Firmansyah (2019) can be
due to advertising, price, product/service quality,
word of mouth, personality, brand image, variety
seeking, customer dissatisfaction and promotions
offered by competitors. From the factors mentioned
that product/service quality and customer
dissatisfaction can make customers do brand
switching.
The company engaged in services and serving
hundreds of passengers every day, PT. XYZ as much
as possible provides optimal services to the people
who use their services. However, it cannot be denied
that the company is not always able to provide
services in accordance with the expectations of
Melinda, S. and Zuliarni, S.
Effect of Service Failure on Ferry Passenger Switching Behavior: The Role of Dissatisfaction.
DOI: 10.5220/0010355202910297
In Proceedings of the 2nd International Conference on Applied Economics and Social Science (ICAESS 2020) - Shaping a Better Future Through Sustainable Technology, pages 291-297
ISBN: 978-989-758-517-3
Copyright
c
2021 by SCITEPRESS – Science and Technology Publications, Lda. All r ights reserved
291

service users. When that happens, service failures
occur. Service Failures are situations where the
services provided are not successful in realizing the
expectations of customers (Michel, 2001). So far,
there are still failed services provided by PT. XYZ
officers. If there is a failure in the services provided
by the company and cause passengers to feel less
satisfied, then this is called customer dissatisfaction.
Thus, service failures are a failure of PT. XYZ
officers in providing services to customers. The failed
service can make customers feel dissatisfied so that
it can lead to brand switching behavior from
customers. So, brand switching behavior occurs
because of service failures and customer
dissatisfaction.
1.2 Research Purposes
This study investigated how service failures affect
dissatisfaction and brand switching behavior on PT.
XYZ ferry passengers. The research results help the
company to understand the real reasons why
customers dissatisfied and switch to another brand.
So the company can be improving and developing a
strategy to avoid service failures. Based on the
research background, the following purposed are
listed:
1. To analyze the effect of service failures on brand
switching behavior.
2. To analyze the effect of service failures on
customer dissatisfaction.
3. To analyze the effect of customer dissatisfaction
on brand switching behavior.
4. To analyze the effect of service failures on
brand switching behavior through customer
dissatisfaction.
of each service provided will be different whether it
is satisfying or not.
According to Mccoll-Kennedy & Sparks (2003)
there are four sources of service failures, there are
service, service provider, things out of control, and
customers. Service or facility provided by the service
provider that is less than optimal, such as the wrong
product/service, the wrong price, and the waiting
time is too long. From service providers, service
failures can occur because of improper employee
actions and behavior. The things out of control are
things that the company does not want and cannot
avoid during the process of providing services to
passengers caused by natural factors and other
organizational behavior. Then, the service failures
can originate from the behavior of the customer itself
and also because of other customer behavior.
2.2 Brand Switching Behavior
Brand switching according to Peter & Olson (2002)
is a buying pattern that has the characteristics of a
change or change from one brand to another. Hawkins
& Mothersbaugh (2010) said brand switching is the
result of customer dissatisfaction with products that
make customers stop buying or using products on
certain brands and replace them with other brands.
Meanwhile according to Ray (2019) brand switching
is a loyal process of one product or service for a
certain period but can also decide to exchange with
another, due to dissatisfaction or changes in
preferences.
According to Mazursky, LaBarBera, & Aiello
(1987), factors that influence brand switching are
intrinsic motives and extrinsic incentives. Intrinsic
Motives are factors that come from the customer.
The dimension is that the customer does not like the
product/service used and the customer moves to
another brand because they want to try a new
product/service. Extrinsic Incentives are factors that
affect brand switching that comes from outside the
customer. Its dimensions are the products/services
offered by competitors are cheaper and competitors
offer attractive promotions.
Then, the factors that influence brand switching
intentions according to Firmansyah (2019) are
advertising, price, product quality, word of mouth
communication, personality, brand image, variety
seeking, customer dissatisfaction and promotion. Of
all the factors that have been mentioned, there are
product quality or service failures and customer
dissatisfaction as factors that influence brand
switching behavior, so that the worse the services
provided and can cause customer dissatisfaction and
greater chances of customers to switch brands. So,
brand switching behavior can arise because of their
own desires or no longer want to use the old brand
again due to perceived dissatisfaction.
2.3 Customer Dissatisfaction
According to Kotler & Keller (2009) dissatisfaction
is a situation where customers' expectations are
higher or not in accordance with the services they
receive from marketers. The opposite of quality
service is service that fails, the consequence that must
be accepted is the dissatisfaction of the customer.
Customers have spent money and time to get
satisfaction for themselves (Laws, 2004). The use of
services is temporary so that there can be many
possibilities of contact between service providers and
customers (Kaihatu, Daengs, & Indrianto, 2015). Lu,
ICAESS 2020 - The International Conference on Applied Economics and Social Science
292
Lu, & Wang (2012) formed customer dissatisfaction
in 3 types, there are overall dissatisfaction with the
product / service, dissatisfaction due to negative
experiences felt more than positive experiences and
general dissatisfaction which is not happy with the
product / service offered.
In addition, García & Pérez (2011) stated that
dissatisfaction due to service failure caused customer
anger and regret. Then, the things that are often
experienced by customers who are dissatisfied with
the attitude of officers according to Kaihatu, Daengs,
& Indrianto (2015) are the company employs service
personnel who have a sour or sullen face and a rude
way of speaking, employees give a passive attitude
when serving customers like reluctantly or serving
customers while chatting with friends, being
discriminatory with customers is like differentiating
services provided between one customer and another
and underestimate customers.
3 METHODOLOGY
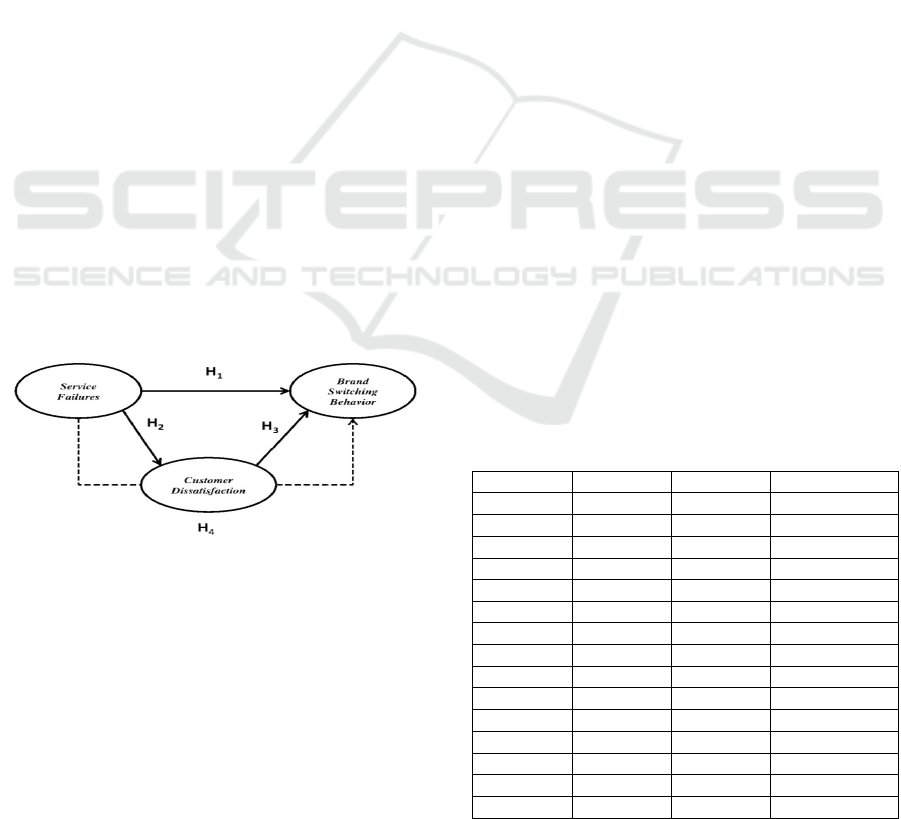
3.1 A Research Framework
Service failures are failures of officers in a company
in providing services to customers. The failed service
can make customers feel dissatisfied so that it can
lead to brand switching behavior from customers. So,
brand switching behavior can arise because of service
failures and customer dissatisfaction. From the
description presented, the research model that will be
conducted by researchers is illustrated in Figure 1.
Figure 1: A Research Framework
3.2 Research Hypothesis
Hypotheses that can be developed from the research
framework are:
H1: Service failures affect brand switching
behavior.
H2: Service failures affect customer
dissatisfaction.
H3: Customer dissatisfaction affects brand
switching behavior.
H4: Service failures affect brand switching
behavior through customer dissatisfaction.
3.3 Population and Sampling Methods
The population in this study were all PT. XYZ
passengers both Indonesian and overseas citizens who
came from Stulang Laut to Batam or who departed
from Batam to Stulang Laut.
The sample used is non-probability sampling with
purposive sampling. The sample of this study was
passengers who departed from Batam to Stulang Laut
who had used PT. XYZ at least 2 times and were
at least 17 years old, totalling 186 respondents.
4 ANALYSIS AND RESULTS
Data analysis using the statistical software SPSS 23,
the study of statistical methods used are as follows:
4.1 Validity and Reliability Analysis
Validity test is used to determine the level of validity
of the questionnaire instrument used in data
collection. Then also to find out whether the items
on the questionnaire can be examined. Items are valid
if r score > r table, conversely if r score < r table
then the item is invalid. R table seen by calculating N
- 2, and 186 - 2 = 184. Then, it can be seen the value
of R Table for 184 samples is 0.1439.
After processing the data, it was found that all the
r scores calculated for each question item on service
failures, brand switching behavior and customer
dissatisfaction > r tables, the results can be seen in
Table 1. So, the data in this study are valid.
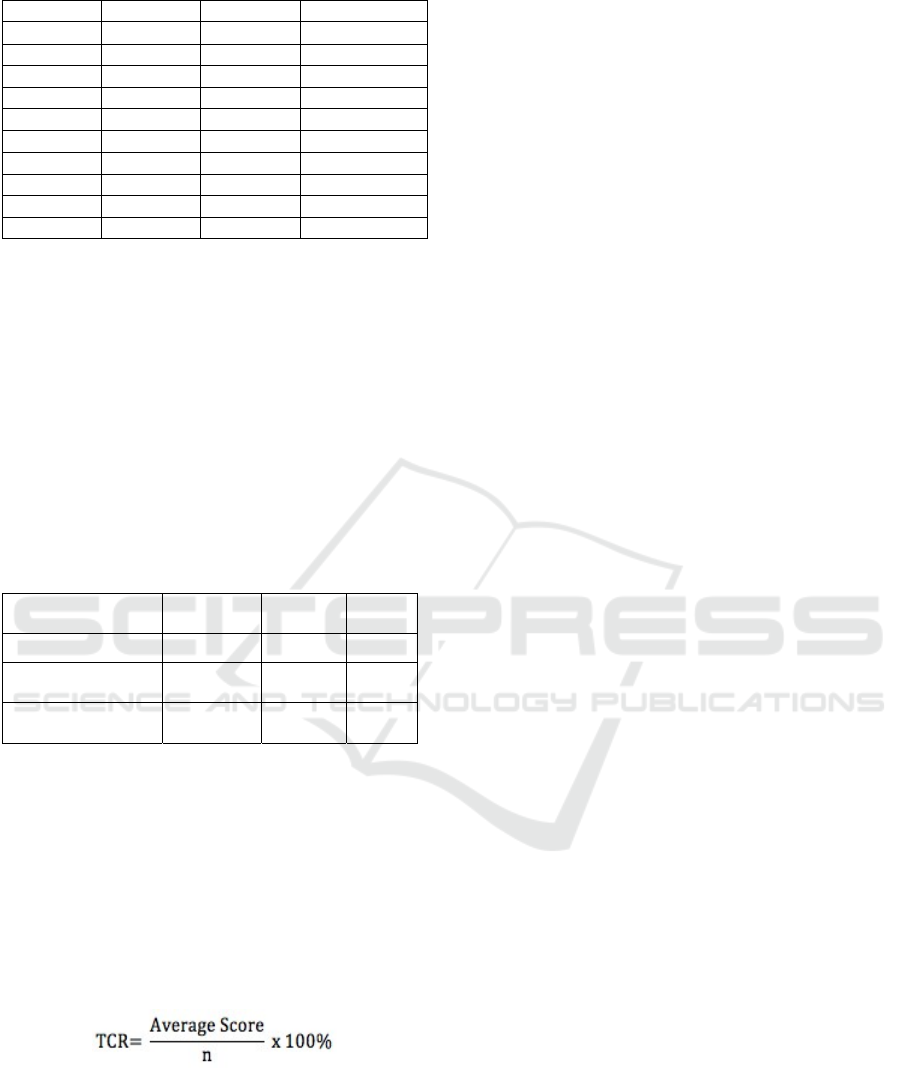
Table 1: Validity Test Results.
Va
r
ia
b
les R Scores R Ta
b
les Result
X1 0.296 0.1439 Vali
d
X2 0.334 0.1439 Vali
d
X3 0.367 0.1439 Vali
d
X4 0.609 0.1439 Vali
d
X5 0.507 0.1439 Vali
d
X6 0.408 0.1439 Vali
d
X7 0.438 0.1439 Vali
d
X8 0.273 0.1439 Vali
d
X9 0.273 0.1439 Vali
d
X10 0.275 0.1439 Vali
d
X11 0.683 0.1439 Vali
d
X12 0.708 0.1439 Vali
d
X13 0.680 0.1439 Vali
d
X14 0.663 0.1439 Vali
d
X15 0.551 0.1439 Vali
d
Effect of Service Failure on Ferry Passenger Switching Behavior: The Role of Dissatisfaction
293
X16 0.350 0.1439 Vali
d
X17 0.443 0.1439 Vali
d
X18 0.624 0.1439 Vali
d
Y1 0.770 0.1439 Vali
d
Y2 0.737 0.1439 Vali
d
Y3 0.550 0.1439 Vali
d
Y4 0.629 0.1439 Vali
d
Y5 0.724 0.1439 Vali
d
Z1 0.920 0.1439 Vali
d
Z2 0.912 0.1439 Vali
d
Z3
0.895
0.1439
Vali
d
Reliability test is used to determine the
consistency of the measurement if used twice or more
by using the same measuring instrument. The test
method is to compare the Cronbach alpha values with
a minimum Cronbach value of 0.6. So, if the value
obtained > 0.6 then the questionnaire is reliable. After
processing the data, it was found that the Cronbach
alpha values of all variables > 0.6, shown in Table
2. The value of Cronbach alpha of service failures is
0.800, brand switching is 0.717, and customer
dissatisfaction is 0.895. Then it can be concluded that
the data of this study are reliable.
Table 2: Reliability Test Results
Variables
Cronbach
Al
p
ha
Minimum
Values
Result
Service
Failures
0.800
0.60
Reliable
Brand
Switching
Behavio
r
(Y)
0.717
0.60
Reliable
Customer
Dissatisfaction
(Z)
0.895
0.60
Reliable
4.2 Descriptive Statistic Analysis
Descriptive analysis is used to describe the
characteristics of each variable. This analysis presents
data into a frequency distribution table, calculating
the average value, total score, and the level of
achievement of respondents (TCR) and interpreting
it. Riduwan (2006) said to find the level of
achievement of the respondents answers used the
following formula:
The criteria for the level of achievement of
respondents (TCR) can be classified as follows:
1. 0 - 25% = Very Low
2. 26% - 50% = Low
3. 51% - 75% = Hi
g
h
4. 76% - 100% = Very High
Based on the results, from 186 respondents who
participated in this study were mobilized by
Indonesian citizens. Then, the majority of
respondents who fill in are male. The age range of
respondents was 25 - 44 years who filled out the
research questionnaire. The majority of respondents
who participated had worked as employees and the
purpose of travelling is for work.
After that, the distribution of respondents answers
was analyzed for each question item that could
support each research variable. Overall, service
failures variable resulted in accumulation of an
average score of 3.25 with the TCR reaching 81.35%.
So, it can be concluded that the level of service
failures can disappoint customers when using PT.
XYZ services are very high. Brand switching
behavior variables produce an accumulation of an
average score of 3.39 with TCR reaching 84.68%. So,
it can be concluded that the level of brand switching
behavior is very high. Then, customer dissatisfaction
variable produces an average accumulation of scores
of 1.69 with TCR reaching 42.25%. So, it can be
concluded that the level of dissatisfaction from
customers using PT. XYZ services are low.
4.3 Classic Assumption Test
For the normality test, the data is calculated through
the Skewness & Kurtosis Test and for a significance
of 0.05, it is said to be normal if the Z value is
<1.96. The test results are Zskewness value -1.52
<1.96 and Zkurtosis -1.59 <1.96. Then, the residual
data are normally distributed and the regression
model meets the normality assumption.
The linearity test has criteria if the value of sig.
Deviation from Linearity> α, then the relationship
between variables is linear. The results found are the
relationship between service failures variables with
brand switching behavior has a value of 0.171> 0.05,
service failures with customer dissatisfaction have a
value of 0.218> 0.05 and customer dissatisfaction
with brand switching behavior has a value of 0.879>
0.05. Then, it can be concluded that the relationship
between variables is linear.
Then, multicollinearity test is used to find out
whether there is a strong correlation between
independent variables by looking at the value of VIF
(Variance Inflation Factor) does not exceed 4 or 5.
The results found are service failures and customer
dissatisfaction has a VIF value of 1,082 <of 5, so
there is no multicollinearity in this research.
Heteroskedasticity test uses the Glejser Test, by
regressing independent variables on the absolute
value of the residual. A good model is not
ICAESS 2020 - The International Conference on Applied Economics and Social Science
294
heteroskedasticity if t value with probability sig>
0.05. The results found are service failures and
customer dissatisfaction has a Sig. > 0.05 which is
0.615 and 0.497. So, there is no heteroskedasticity in
this study.
The autocorrelation test was tested with the
Durbin Watson Test provided that there was no
autocorrelation in the regression model. The results
show that the DW value is greater than the dU value,
which is 1.934> 1.7818, so there is no positive
autocorrelation. Then, if (4 - DW value)> dU, which
is 2.066> 1.7818 then there is no negative
autocorrelation. So, it can be concluded that there is
no positive or negative autocorrelation and the
research is convincing and can be concluded.
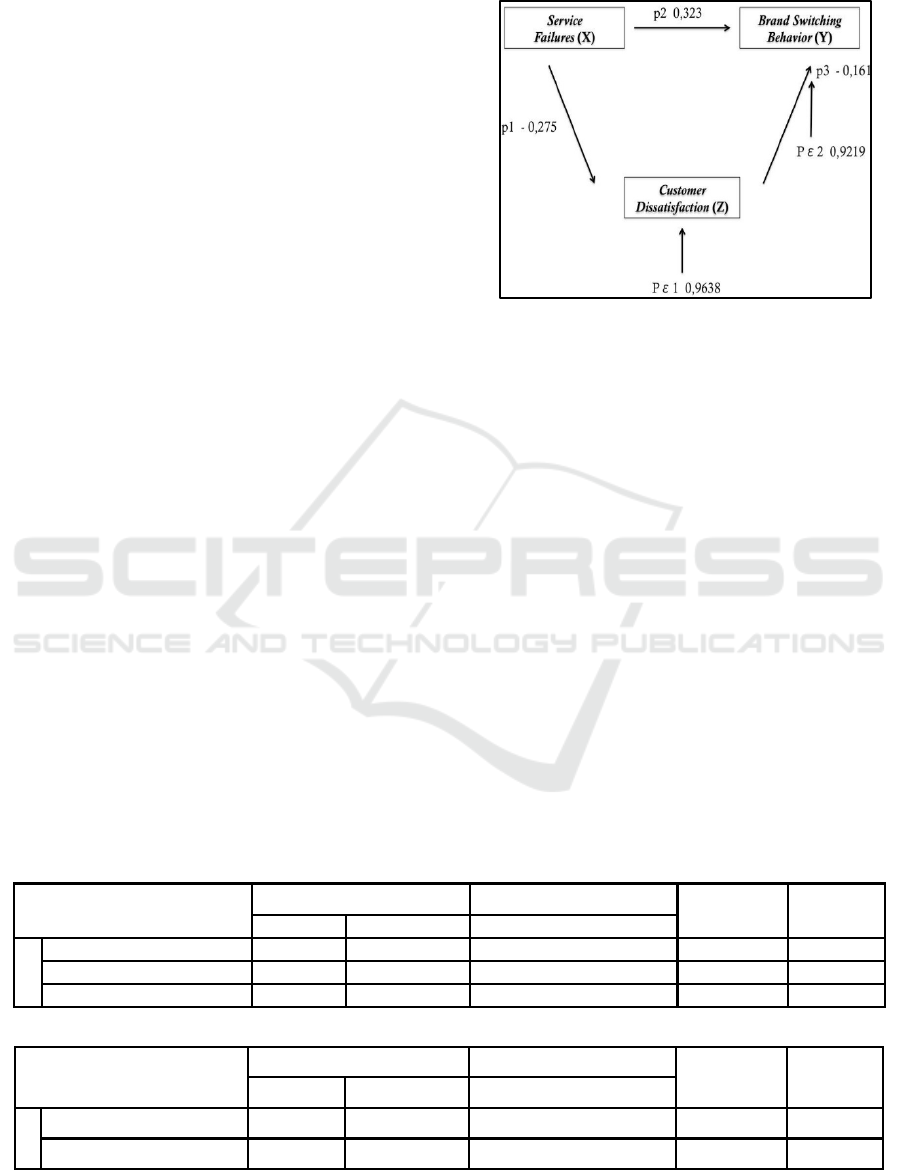
4.4 Path Analysis
Path analysis is used to measure the effect of a
variable on other variables directly or indirectly
(Olobatuyi, 2006). This analysis uses a path diagram
that aims to conceptualize a problem or test complex
hypotheses. From this diagram, the effects of the
independent variables on the dependent variable can
be calculated both directly and indirectly. The effects
between these variables can be seen from the path
coefficient. The path analysis equation model used in
this study is as follows:
Z = P1X + ε1 ………… .. Substructural 1
Y = P2X + p3Z + ε2 …… Substructural 2
From the output data processed using SPSS, the
equation is obtained as follows:
1. Customer Dissatisfaction = (-) 0,275 Service
Failures + 0.9638 …………… Substructural 1
2. Brand Switching Behavior = 0.323 Service
Failures + (-) 0.161 + 0.9219 .. Substructural 2
If formed in the diagram, equation substructural 1
and 2 shown in Figure 2.
Figure 2: Path Analysis Diagram
4.5 Hypothesis Testing
T-test is used to test partially. This research is two-
way research, so if the t score > t table or t score
< -t table, then there is an effect of independent
variables on dependent variable or hypothesis is
accepted. The t-test uses α = 5% and the degree of
freedom (df) of the test is n - k = 186 - 3 = 18, so the
t table value is 1.973.
Based on the results shown in Table 3, it indicates
that service failures affect brand switching behavior
(H1 accepted), service failures affects dissatisfaction
(H2 accepted) and customer dissatisfaction affects
brand switching behavior (H3 accepted).
Furthermore, to test the fourth hypothesis using
the Sobel test. This test is used to test the strength of
the indirect effect of independent variables to the
dependent variable through intervening variables.
The calculation is performed using the formula
developed by Ghozali (2011) as follows:
Table 3: t-Test Results
Model
Unstandardized Coefficients Standardized Coefficients
t
Sig.
B Std. Error Beta
1
(Constant) 11,798 1,628 7,246 ,000
Service Failures ,108 ,023 ,3234,586 ,000
Custome
r
Dissatisfaction -,215 ,094 -,161 -2,284 ,023
Dependent Variable: Brand Switching Behavior.
Model
Unstanda
r
dize
d
Coefficients Stan
d
a
r
d
ize
d
Coefficients
t
Sig.
B Std. E
r
r
o
r
Beta
1
(Constant) 9,229 1,076
8,579 ,000
SF -,068 ,018 -,275-3,883 ,000
Dependent Variable: Customer Dissatisfaction.
Effect of Service Failure on Ferry Passenger Switching Behavior: The Role of Dissatisfaction
295
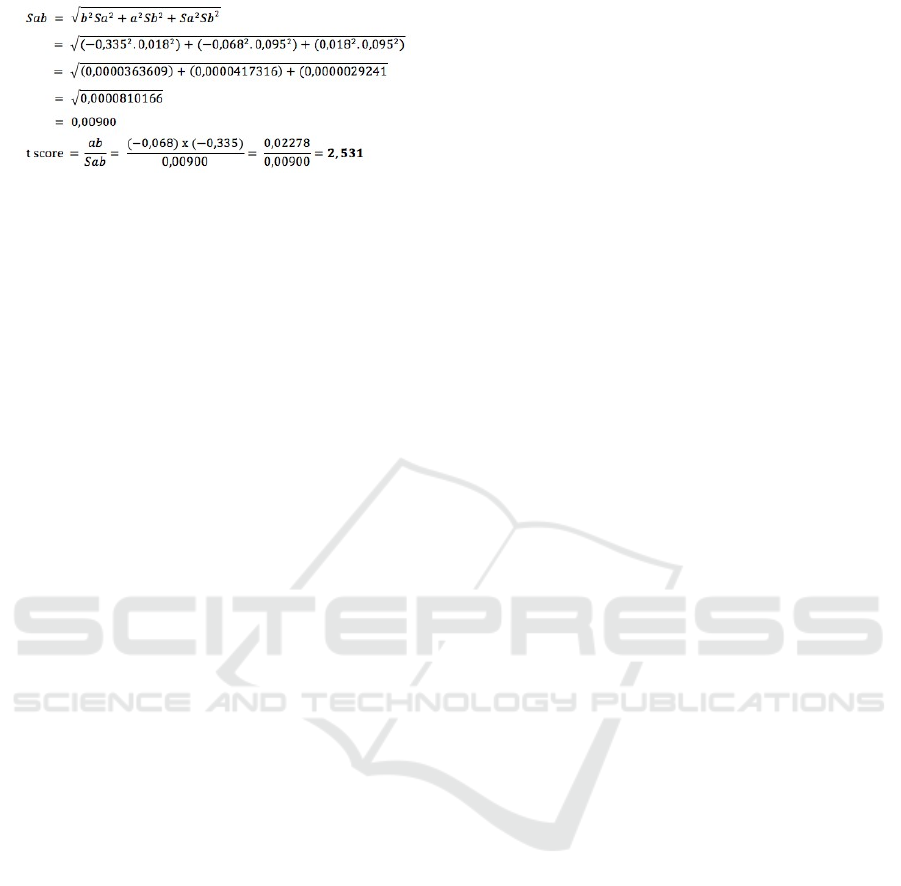
From the results, it was found that the value of t
scores 2.531 > t table 1.973. Then, there is a
mediating effect between the independent variables
on the dependent variable. So, it can be concluded
that the H4 is accepted and service failures have an
indirect effect on brand switching behavior through
customer dissatisfaction.
4.6 Coefficient of Determination
Then, for the test results, the coefficient of
determination is the Adjusted R
2
value is 0.150, which
means the ability of the model of the independent
variable (service failures & customer dissatisfaction)
explains the variation of the dependent variable
(brand switching behavior) is 15%.
4.6.1 The Effect of Service Failures on
Brand Switching Behavior
Based on the results of tests with the t-test, it was
found that service failures affect brand switching
behavior on PT. XYZ ferry passengers (H1 accepted).
Service failures affects brand switching behavior
because the t scores in the influential area. Thus, the
behavior of switching brands from passengers was
created because customers felt disappointed by the
failed service provided by PT. XYZ officers.
The results are the same as the results of research
from Awan, Nadeem & Faisal (2016) in their research
that explained that service failures affect brand
switching in the telecommunications industry related
to cellular service providers in Punjab-South
Pakistan. Then, the researchers say that if the failure
of the service increases, the desire to switch brands
from customers can increase as well.
4.6.2 The Effect of Service Failures on
Customer Dissatisfaction
Based on the results of tests with the t-test, it was
found that service failures affect customer
dissatisfaction on PT. XYZ ferry passengers (H2
accepted). Service failures affect customer
dissatisfaction because of the t scores in the
influential area. Thus, with the occurrence of a
service that fails will give dissatisfaction to the
customer.
The results of this study are in line with research
from Janjua (2017) which in his research found that
the type and intensity of service failures affected the
level of customer dissatisfaction. Then, it is also
explained that the size of the service failures that
occur will affect customer dissatisfaction. So, the
level of dissatisfaction with the customer depends on
how big or how often the intensity of service failure
occurs.
But the research of Rokhyadi & Putri (2017) has
the result that service failure and dissatisfaction have
a less powerful influence. The researchers explain
that the level of service failure felt by visitors is still
at reasonable level. So, if there is a failure in
providing service when serving customers, it does
not always make the customer immediately feel
disappointed or dissatisfied with the service
provided by the officer.
4.6.3 The Effect of Customer Dissatisfaction
on Brand Switching Behavior
Based on the results of testing with the t-test, it was
found that there was an effect of customer
dissatisfaction on brand switching behavior on PT.
XYZ ferry passengers (H3 accepted). Customer
dissatisfaction affects brand switching behavior
because of the t scores in the influential area. If
customers are not satisfied with the services provided,
they will switch from PT. XYZ by looking for
variations and try the services of other companies that
offer the same service, or switch because the prices
offered by competitors are cheaper and offer
attractive promotions.
In research of Widianti & Trinanda (2019) also
explained that customer dissatisfaction affects brand
switching behavior. In their research, it was stated
that the higher the customer dissatisfaction, the higher
brand transfer decisions. And conversely, the lower
the customer dissatisfaction, the decision to move the
brand will be lower too.
4.6.4 The Effect of Service Failures on
Brand Switching Behavior through
Customer Dissatisfaction
Based on the Sobel test results, it was found that
service failures affected brand switching behavior
through customer dissatisfaction on PT. XYZ ferry
passengers (H4 accepted). From these results indicate
that customer dissatisfaction as a mediating variable
plays a role in the effect of service failures on brand
switching behavior. So it can be concluded that if the
ICAESS 2020 - The International Conference on Applied Economics and Social Science
296

customer gets a service that fails, the customer will
switch to another brand because of the feeling of
dissatisfaction due to receiving the failed service.
The results of this study are strengthened by the
results of research from Buttle & Burton (2001)
which in his research explained that customers will
leave a brand because the customer is not satisfied
due to a failed service. So, if a customer experiences
a service that fails then they are not satisfied with this.
So, if customer dissatisfaction is out of tolerance then
they will take action that is certainly not desired by
all companies, which is to switch to another brand.
5 CONCLUSIONS
Based on the test results it can be concluded that
service failures affect brand switching behavior on
passengers using PT. XYZ. So brand switching
behavior of passengers is created because customers
feel disappointed from service failures provided by
PT. XYZ.
The test results also concluded that service
failures affect customer dissatisfaction on passengers
using PT. XYZ. So the occurrence of service failures
will cause dissatisfaction from customers of PT.
XYZ.
Then, the results that the influence of customer
dissatisfaction on brand switching behavior on
passengers using PT. XYZ If customers are not
satisfied with the services provided, they will switch
from PT. XYZ by looking for variations and try the
services of other companies.
This study also found that service failures affect
brand switching behavior through customer
dissatisfaction on passengers using PT. XYZ. Then
it can be concluded that if the customer get service
failures, the customer will switch to another brand
because dissatisfied wih the failed service.
REFERENCES
Chou, C., Goo, Y.-J., & Hsu, Y.-H. (2009). Service
Failures And Recovery Strategies From The Service
Provider Perspective. Asia Pacific Management Review
, 14.
Firmansyah, A. (2019). Pemasaran: Dasar Dan Konsep.
Jakarta: Qiara Media.
García, I. S., & Pérez, R. C. (2011). Effects Of
Dissatisfaction In Tourist Services: The Role Of
Anger And Regret . Tourism Management , 1404.
Ghozali, I. (2011). Aplikasi Analisis Multivariate Dengan
Program Spss. Semarang: Badan Penerbit Universitas
Diponegoro.
Hammer, M. (2004). Apa Yang Harus Dilakukan Setiap
Bisnis Untuk Menguasai Masa Depan. Jakarta:
Gramedia Pustaka Utama.
Hawkins, D. I., & Mothersbaugh, D. L. (2010). Consumer
Behavior: Building Marketing Strategy. New York.
Kaihatu, T. S., Daengs, A., & Indrianto, A. T. (2015).
Manajemen Komplain. Yogyakarta: Andi Offset.
Kotler, P., & Keller, K. L. (2009). Manajemen Pemasaran
(Vol. 2). Jakarta: Erlangga.
Laws, E. (2004). Improving Tourism And Hospitality
Services. Cambridge: Cabi Publishing.
Lu, Y., Lu, Y., & Wang, B. (2012). Effects Of
Dissatisfaction On Customer Repurchase Decisions In
E-Commerce—An Emotion-Based Perspective .
Journal Of Electronic Commerce Research .
Mazursky, D., Labarbera, P., & Aiello, A. (1987). When
Consumers Switch Brands. Psychology & Marketing
Journal , 4.
Mccoll-Kennedy, J. R., & Sparks, B. A. (2003). Application
Of Fairness Theory To Service Failures And Service
Recovery. Journal Of Service Research .
Michel, S. (2001). Analyzing Service Failures And
Recoveries: A Process Approach. International
Journal Of Service Industry Management , 12, 1.
Olobatuyi, M. E. (2006). A User's Guide To Path
Anslysis. Maryland: University Press Of America.
Peter, J. P., & Olson, J. C. (2002). Consumer Behavior (Vol.
1). Jakarta: Erlangga.
Ray, N. (2019). Managing Diversity, Inovation And
Infrastructure In Digital Business. Kolkata: Igi Global.
Riduwan, A. (2006). Rumus Dan Data Dalam Aplikasi
Statistika. Bandung: Alfabeta.
Roos, I., & Friman, M. (2008). Emotional Experiences In
Customer Relationships – A Telecommunication
Study. International Journal Of Service Industry
Management , 19.
Svafa, G. (2006). Service Leadership: The Quest For
Competitive Advantage. London: Sage Publications.
Effect of Service Failure on Ferry Passenger Switching Behavior: The Role of Dissatisfaction
297
