
Analysis of Corporate Bankruptcy and Financial Statement Fraud
Prediction using Altman Models and Beneish Models
Cut Annisa Selanda, and Afriyanti Hasanah
Applied Business Administration, Politeknik Negeri Batam, Jl. Ahmad Yani, Batam, Indonesia
Keywords: Altman Models Model, Beneish Models Model, Bankruptcy, Financial Statement Fraud
Abstract: The purpose of this study was to analyze the prediction of financial statement fraud and bankruptcy of
companies using the Altman Models model and the Beneish Models model. This research is a descriptive
analysis research with a quantitative approach using secondary data from the company’s financial statements.
The population in this study are property and real estate companies listed on the Indonesia Stock Exchange
(BEI) in the period 2014-2018 with a sample of 24 companies. The result showed that there is a
relationship between financial statement fraud and company bankruptcy conditions where there are financial
statements that are predicted to go bankrupt before manipulated, there are financial statements that are
manipulated before bankrupt, and there are financial statements that are simultaneously predicted to go
bankrupt and manipulated. Based on the analysis, the researcher argued that stakeholders would be better
protected when the Altman Models model and Beneish Models model are used simultaneously. Further
research is recommended to use another bankruptcy prediction tool and financial statement fraud prediction
tool.
1 INTRODUCTION
Each company has a financial report that serves to
provide information for making decisions, making
calculations, measurements, and evaluating all
aspects of the company's economy in a
comprehensive manner (Syakur, 2015). Financial
statements must be presented in a relevant, accurate,
detailed, and free from all forms of fraud. Many of
the practices that occur, high expectations in
achieving the income of a company are often
followed by ambition to manipulate financial
statements (Christy, Sugito, & Abdul, 2015). The
material misstatement of financial statements was
deliberately done to trick investors and creditors
(ACFE, 2016). Earnings management is a form of
financial statement fraud by reporting fictitious
transactions that will produce the desired profit value.
Cases of manipulation of financial statements
occur abroad and domestically. In 2001 it was
revealed that the management of one of the largest
companies in the United States, the Enron companies,
overestimated profits in the company's financial
statements until its debts were discovered and finally
declared bankrupt in December 2001 (Deil, 2014).
In 2002, the company World com which was also a
large company in the United States went bankrupt
after the company's financial game was revealed
(Pertiwi, 2015). The case of financial manipulation
in Indonesia was carried out by the SNF companies.
In 2018, SNP Finance was declared bankrupt after
committing fraud by reporting a fictitious financial
report by the Financial Services Authority (OJK).
Based on the cases above, financial statement fraud
needs to be detected as an effort to protect those who
need information (Gumiwang, 2018).
Fraud detection was carried out by Beneish
Models by formulating 8 analysis ratios to identify
the occurrence of fraudulent financial statements or
being involved in earnings manipulation (Beneish,
1999). The ratio can predict that 76% of the sample
companies studied by Beneish Models are classified
as manipulating financial statements. The method
found by Beneish Models is known as the Beneish
Models model. An analysis of the causes of the
financial statement fraud needs to be done. One of the
causes of fraud in bankruptcy (Albrecht, Albrecht,
Albrecht, & Zimbelman, 2012). Companies in a
vulnerable situation will try to increase profits to get
financial statements that will attract investors to
invest. Bankruptcy prediction was carried out by
Altman Models using 5 financial ratios and came to
154
Selanda, C. and Hasanah, A.
Analysis of Corporate Bankruptcy and Financial Statement Fraud Prediction using Altman Models and Beneish Models.
DOI: 10.5220/0010354501540164
In Proceedings of the 2nd International Conference on Applied Economics and Social Science (ICAESS 2020) - Shaping a Better Future Through Sustainable Technology, pages 154-164
ISBN: 978-989-758-517-3
Copyright
c
2021 by SCITEPRESS – Science and Technology Publications, Lda. All rights reserved

be known as the Altman Models model. Z-Score's
research results were able to predict bankruptcy with
an accuracy rate of 95% (Altman E. I., 1968).
There is the highest possibility that companies
facing financial difficulties will manipulate their
income to show a healthy company condition
(Maccarthy, 2017). This is in line with other research
statement that poor financial conditions have a strong
motivation to commit fraud (Abbas, 2017). Another
study by shows that companies are in a state of
financial difficulties and also detected as a
manipulator (Mavangere, 2015). This research is a
development of research that applies the Beneish
Models and Altman Models models simultaneously in
detecting bankruptcy and corporate fraud by using a
sample of companies that have been proven to have
committed fraud and bankruptcy (Maccarthy, 2017)
(Abbas, 2017) (Mavangere, 2015). The sample of this
study is the property and real estate subsector
companies listed on the Indonesia Stock Exchange
(IDX). The purpose of this study is to test first, that
the company is in a bankrupt or bankrupt zone before
it is classified as a manipulator. Second, the company
is classified as a manipulator before it is predicted to
be in a zone prone to bankruptcy or bankruptcy.
Third, companies classified as manipulators are also
predicted to be in a bankrupt or bankrupt zone.
The difference in research conducted with
previous research is, most of the previous studies
used a sample of companies that have been declared
cheating so that the conclusions obtained are limited
to cases that have been proven to be cheating, while
the sample of companies in this study is companies
that are still listed on the IDX.
2 THEORETICAL FRAMEWORK
AND HYPOTEHESIS
DEVELOPMENT
2.1 Theoretical Framework
2.1.1 Agency Theory
Agency theory underlies a set of shareholder
contracts with management in managing the control
and use of resources in the company (Jensen &
Meckling, 1976). Information about the company's
performance and operations are more widely owned
by management, giving rise to opportunities to
commit fraud such as manipulation of numbers in the
financial statements which will eventually develop
into something that is materially misleading and will
harm the company.
2.1.2 Fraud Triangle Theory
The Fraud Triangle theory explains that cheating is
caused by 3 factors including the first, pressure which
covers almost everything including economic
demands, lifestyle, and so on. Second, the
opportunity (opportunity) that usually occurs due to
a lack of internal control supervision and abuse of
authority. Third, rationalization is a set of ethical
values in a person's attitude and character (Cressey,
1953).
2.1.3 Maximizes Social Welfare Theory
Bankruptcy theory states that social welfare is
maximized when companies experience economic
difficulties. This is because creditors are more
interested in the availability of assets and the extent
to which these assets can satisfy their claims rather
than the prospect of saving the company.
2.2 Hypothesis Development
2.2.1 The Company Is Predicted to Go
Bankrupt before Manipulated
The Fraud Triangle theory which states that one of
the causes of fraud is when under pressure and
opportunity (Cressey, 1953). Abuse of authority by
management is done to produce financial reports that
are always good so investors remain interested in
investing their capital (Jensen & Meckling, 1976).
This hypothesis can be supported if there are
companies that are in the gray zone or are bankrupt
from the results of the Altman Models interpretation,
before being classified as a manipulator of the results
of the M-Score interpretation.
2.2.2 The Company Is Predicted to Be
Classified as a Manipulator before It
Is in the Bankruptcy Zone
The Fraud Triangle theory which states that one of
the causes of fraud is the opportunity (Cressey, 1953).
The opportunity is owned by management as a party
that is more flexible about the company's financial
statements (Jensen & Meckling, 1976). The desire
and ambition to achieve a company is often followed
by fraud (Christy, Sugito, & Abdul, 2015).
Companies always want to have financial reports that
look good when the fraud can lead to bankruptcy in
the future. This hypothesis can be supported if there
Analysis of Corporate Bankruptcy and Financial Statement Fraud Prediction using Altman Models and Beneish Models
155
are companies classified as manipulators from the M-
Score interpretation results before they are predicted
to be in the gray zone or bankrupt from the Altman
Models interpretation results.
2.2.3 Companies That Are Classified as
Manipulators Simultaneously Are Also
Predicted to Be in the Bankruptcy
Zone
The Fraud Triangle theory which states that one of
the causes of fraud is when the opportunity arises
when management wants to commit fraud and there
is the pressure when the company is in bad
condition so that the company is categorized in
bankruptcy and also classified as a manipulator
(Cressey, 1953).
This hypothesis can be supported if there are
companies that are classified as manipulators and are
also in a bankrupt zone.
3 RESEARCH METHODS
3.1 Data Types and Sources
The type of data in this study are secondary data in
the form of financial statements of the property and
real estate sub-sector companies for the period 2014-
2018. Data sources were obtained through the IDX's
official website, www.idx.co.id. As well as the
individual company sample pages.
3.2 Variable Operational Definitions
and Measurements
3.2.1 Bankruptcy
In 1995, Altman Models modified the model so that
it could be used in all types of companies in
developing countries (Altman, Peck, & Hartzell,
1995). The elimination of Sales / Total Assets
variables is done because this ratio is very varied in
companies with different asset sizes. The modified
Altman Models equation is:
Z-Score = 6.56Z1 +3.26Z2 + 6.72Z3 + 1.05Z4
Source: (Altman E. I., 1968)
The definition of ratio used as a measurement is:
1. Z1 Ratio (Net Working Capital to Total Assets)
𝑍1
𝑁𝑒𝑡 𝑊𝑜𝑟𝑘𝑖𝑛𝑔 𝐶𝑎𝑝𝑖𝑡𝑎𝑙
𝑇𝑜𝑡𝑎𝑙 𝐴𝑠𝑠𝑒𝑡𝑠
The Z1 ratio measures the company's ability to
generate networking capital from total assets. If the
company is in financial difficulty, working capital
will decrease faster than total assets, so the ratio will
decrease.
2. Z2 Ratio (Retained Earnings to Total Assets)
The Z2 ratio measures the company's ability to
generate retained earnings from total company assets.
3. Z3 Ratio (Earnings Before Interest and Tax
to Total Assets)
𝑍3
𝐸𝑎𝑟𝑛𝑖𝑛𝑔𝑠 𝐵𝑒
𝑓
𝑜𝑟𝑒 𝐼𝑛𝑡𝑒𝑟𝑒𝑠𝑡 𝑎𝑛𝑑 𝑇𝑎𝑥
𝑇𝑜𝑡𝑎𝑙 𝐴𝑠𝑠𝑒𝑡𝑠
Z3 ratio measures the effectiveness of the company
in earning profits before paying interest and taxes.
4. Ratio Z4 (Book Value of Equity to Book
Value of Debts)
𝑍4
𝐵𝑜𝑜𝑘 𝑉𝑎𝑙𝑢𝑒 𝑜𝑓 𝐸𝑞𝑢𝑖𝑡𝑦
𝐵𝑜𝑜𝑘 𝑉𝑎𝑙𝑢𝑒 𝑜𝑓 𝐷𝑒𝑏𝑡𝑠
Table 1: The Altman Models Model Parameter Index
No. Z-Score Classification
1 <1.10 The company is bankrupt
2 1.10<Z<2.60 The company is in grey zone
3 >2.60 The company in good condition
Source: (Altman E. I., 1968)
3.2.2 Fraudulent Financial Statements
Fraudulent is measured using the Beneish Models
model with the formula:
M-Score = -4.84 + 0.92 DSRI + 0.528GMI +
0.404AQI + 0.892 SGI + 0.115DEPI
+ -
ICAESS 2020 - The International Conference on Applied Economics and Social Science
156

0.172 SGAI + 4.679TATA + -0.327 LVGI
The definition of ratio used as a measurement is:
1. Day Sales in Receivable Index (DSRI)
The DSRI ratio is used to compare accounts
receivable against sales generated by the company
one year (t) and the previous year (t-1).
DSRI=
/
/
An increase in the amount of trade receivables owned
indicates.
2. Gross Margin Index (GMI)
The GMI ratio is used to compare the company's
gross profit for one year (t) and the previous year (t-
1).
GMI=
/
/
Z4 ratio shows the capability of a company to fulfill
the obligations of the capital market value. Generally,
companies that run aground will accumulate more
debt than their capital.
Altman Models ratio calculation is intended to
determine the category of a company classified as
healthy, prone to bankruptcy, or bankrupt if it gets a
value according to the parameter index according to
the Z-Score. The parameter index determined by
Altman Models is as follows:
The decrease in the company's gross profit means
the company's prospects have decreased and indicated
fraud.
3. Assets Quality Index (AQI)
Increasing the amount of deferred expenses is an
indication of fraud because the company is trying to
delay costs.
𝐴𝑄𝐼
1
𝐶𝑢𝑟𝑟𝑒𝑛𝑡 𝐴𝑠𝑠𝑒𝑡𝑠
𝐹𝑖𝑥𝑒𝑑 𝐴𝑠𝑠𝑒𝑡𝑠
𝑇𝑜𝑡𝑎𝑙 𝐴𝑠𝑠𝑒𝑡𝑠
1
𝐶𝑢𝑟𝑟𝑒𝑛𝑡 𝐴𝑠𝑠𝑒𝑡𝑠
𝐹𝑖𝑥𝑒𝑑 𝐴𝑠𝑠𝑒𝑡𝑠
𝑇𝑜𝑡𝑎𝑙 𝐴𝑠𝑠𝑒𝑡𝑠
AQI ratio compares non-current assets other than
fixed assets with the total assets of the company in
one year (t) and the previous year (t-1).
4. Sales Growth Index (SGI)
The SGI ratio compares sales in one year (t) and the
previous year (t-1).
𝑆𝐺𝐼
𝑆𝑎𝑙𝑒𝑠
𝑆𝑎𝑙𝑒𝑠
A decrease in this ratio indicates a decrease in sales.
This indicates fraud.
If LVGI> 1, then this shows the potential
condition of the company for the occurrence of
earnings overstatement to meet the needs of paying
the high debt.
5. Depreciation Index (DEPI)
The DEPI ratio compares depreciation expense to
fixed assets before depreciation in one year (t) and the
previous year (t -1).
𝐷𝐸𝑃𝐼
𝐷𝑒𝑝𝑟𝑒𝑐𝑖𝑎𝑡𝑖𝑜𝑛
𝐷𝑒𝑝𝑟𝑒𝑐𝑖𝑎𝑡𝑖𝑜𝑛
𝐹𝑖𝑥𝑒𝑑 𝐴𝑠𝑠𝑒𝑡𝑠
𝐷𝑒𝑝𝑟𝑒𝑐𝑖𝑎𝑡𝑖𝑜𝑛
𝐷𝑒𝑝𝑟𝑒𝑐𝑖𝑎𝑡𝑖𝑜𝑛
𝐹𝑖𝑥𝑒𝑑 𝐴𝑠𝑠𝑒𝑡𝑠
𝐭𝐨𝐫
Beneish Models ratio calculations each have a
parameter index to determine whether the company
is classified as a manipulator and a non-manipulator.
The parameter index determined by Beneish Models
is as follows:
6. Index (SGAI)
The SGAI ratio measures sales, general expenses, and
administration to sales in one year (t) and the previous
year (t -1).
𝑆𝐺𝐴𝐼
𝑆𝐺𝐴𝐼
𝑆𝑎𝑙𝑒𝑠
𝑆𝐺𝐴𝐼
𝑆𝑎𝑙𝑒𝑠
A decrease in the company's operating expenses when
there is an increase in sales indicates an overstatement
of earnings.
7. Total Accrual to Total Assets (TATA)
A decrease in the company's operating expenses when
there is an increase in sales indicates an overstatement
of earnings.
Analysis of Corporate Bankruptcy and Financial Statement Fraud Prediction using Altman Models and Beneish Models
157

𝑇𝐴𝑇𝐴
𝑂𝑝𝑒𝑟𝑎𝑡𝑖𝑛𝑔 𝑃𝑟𝑜𝑓𝑖𝑡
𝐶𝑎𝑠ℎ𝑓𝑙𝑜𝑤 𝑓𝑟𝑜𝑚 𝑂𝑝𝑒𝑟𝑎𝑡𝑖𝑛𝑔 𝐴𝑐𝑡𝑖𝑣𝑖𝑡𝑖𝑒𝑠
𝑇𝑜𝑡𝑎𝑙 𝐴𝑠𝑠𝑒𝑡𝑠
8. Leverage Index (LVGI)
Index of debt level is a ratio that compares the
amount of debt to total assets in a year (t) and the
previous year (t -1).
𝐿𝑉𝐺𝐼
𝑇𝑜𝑡𝑎𝑙 𝐿𝑖𝑎𝑏𝑖𝑙𝑖𝑡𝑖𝑒𝑠
𝑇𝑜𝑡𝑎𝑙 𝐴𝑠𝑠𝑒𝑡𝑠
𝑇𝑜𝑡𝑎𝑙 𝐿𝑖𝑎𝑏𝑖𝑙𝑖𝑡𝑖𝑒𝑠
𝑇𝑜𝑡𝑎𝑙 𝐴𝑠𝑠𝑒𝑡𝑠
Table 2: The Beneish Models Parameter Index
No Index Non-
Mani
p
ulator
Manipulator
1 DSRI <1.030 >1.460
2 GMI <1.041 >1.190
3 AQI <1.040 >1.250
4 SGI <1.134 >1.610
5 DEPI <1.001 >1.077
6 SGAI <1.001 >1.041
7 TATA <0.018 >0.031
8 LVGI <1.037 >1.111
Total <2.22 >2.22
Source: (Beneish, 1999)
3.3 Location and Research Object
The study was conducted on the property and real
estate subsector companies listed on the Indonesia
Stock Exchange (IDX) for the period 2014-2018.
3.4 Sampling Technique
The sample selection is done by using a non-
probability purposive sampling technique with the
first criteria, property, and real estate subsector
companies listed on the Indonesia Stock Exchange
(BEI) in a row during the 2014-2018 period. Second,
Publish financial statements 5 years in a row during
the period 2014-2018.
3.5 Data Collection Technique
Data collection techniques used in this study are
archival data techniques in the database, namely
secondary data collection in the form of financial
statements.
3.6 Data Processing Techniques
The research data processing technique is first,
determining the variables of the financial statements.
Second, the data input process is entered into the
table. Third, the calculation of the variables ratios of
the Altman Models model and the Beneish Models
Model. Data processing using Microsoft Excel
programs.
4 RESULT AND DISCUSSION
4.1 Altman Models Ratio Calculation
Result
Table 3: Altman Models Ratio Calculation Result
No Company Z-Score
2014 2015 2016 2017 2018
1 APLN 2.77 2.31 1.8 2.32 1.72
2 ASRI 1.63 1.49 1.57 2.05 2.35
3 BEST 7.2 5.34 5.55 5.76 6.62
4 BIPP 3.12 5.08 3.09 3.09 3.95
5 BKSL 2.98 2.48 3.2 3.55 3.2
6 COWL 1.26 1.1 1.37 0.62 -0.05
8 DART 7.64 -1.42 -2.33 -1.33 -2.18
9 DILD -1.64 -0.58 -1.86 -1.72 -0.52
10 EMDE -2.14 -2.41 -1.12 -1.24 -1.14
11 FMII -3.05 2.5 -0.69 -2.78 -2.8
12 GPRA -1.72 -2.24 -2.04 -1.87 -1.89
13 GWSA -1.04 -0.67 -1.69 -2.76 -1.52
14 KIJA -1.58 -1.84 -1.2 -2.44 -1.08
15 LPCK -0.98 -0.6 -1.9 -0.6 -0.65
16 LPKR -1.39 -1 -1.61 -1.4 -1.83
17 MDLN -0.74 -0.69 -2.24 -2.04 -1.87
18 MTLA -0.78 -2.17 -2.15 -1.25 -2.68
19 MTSM -2.93 -2.82 -0.39 -2.16 -2.55
20 NIRO -1.87 -1.45 -1.18 -1.64 -2.31
21 MORE -2.38 -20.3 -2.44 -2.22 -1.88
22 PWON -1.39 -0.22 -0.25 -1 -1.95
23 SMDM -1.52 -1.89 -1.53 -2.3 -2.24
24 SMRA -1.33 -0.91 0.75 -1.56 -2.19
Source: Data processed with Microsoft Excel.
ICAESS 2020 - The International Conference on Applied Economics and Social Science
158
4.2 Beneish Models M-Score Ratio
Calculation Result
Table 4: Beneish Models M-Score Ratio Calculation Result
No Company Z-Score
2014 2015 2016 2017 2018
1 APLN -2.15 -2.07 -1.78 -1.58 -1.86
2 ASRI -1.65 -1.82 -1.53 -1.87 -1.48
3 BEST -1.67 -1.28 7.27 -2.39 -2.99
4 BIPP -1.08 -2.29 -1.89 -1.83 -2.47
5 BKSL -1.57 -2.02 -0.81 -1.48 -1.86
6 COWL -1.87 -2.06 -1.79 -1.33 -2.24
8 DART -1.84 -1.78 -1.77 -1.93 -1.73
9 DILD
0,3361
11 ‐1.42 ‐2.33 ‐1.33 ‐2.18
10 EMDE
‐1.64 ‐0.58 ‐1.86 ‐1.72 ‐0.52
11 FMII
‐2.14 ‐2.41 ‐1.12 ‐1.24 ‐1.14
12 GPRA
‐3.05 02.05 ‐0.69 ‐2.78 ‐2.8
13 GWSA
‐1.72 ‐2.24 ‐2.04 ‐1.87 ‐1.89
14 KIJA
‐1.04 ‐0.67 ‐1.69 ‐2.76 ‐1.52
15 LPCK
‐1.58 ‐1.84 ‐1.2 ‐2.44 ‐1.08
16 LPKR
‐0.98 ‐0.6 ‐1.9 ‐0.6 ‐0.65
17 MDLN
‐1.39 ‐1 ‐1.61 ‐1.4 ‐1.83
18 MTLA
‐0.74 ‐0.69 ‐2.24 ‐2.04
0,10208
3
19 MTSM
‐0.78 ‐2.17 ‐2.15 ‐1.25 ‐2.68
20 NIRO
‐2.93 ‐2.82 ‐0.39 ‐2.16 ‐2.55
21 MORE
‐1.87 ‐1.45 ‐1.18 ‐1.64 ‐2.31
22 PWON
‐2.38 ‐2.03 ‐2.44 ‐2.22 ‐1.88
23 SMDM
‐1.39 ‐0.22 ‐0.25 ‐1 ‐1.95
24 SMRA
‐1.52 ‐1.89 ‐1.53 ‐2.3 ‐2.24
Source: Data processed with Microsoft Excel
4.3 Descriptive Statistic
Table 5: Descriptive Statistic
Variable N Min Max Mean
Std.
Deviation
Z-Score 120 -0,05 31,88 5,6976 4,85823
M-Score 120 -3,05 7,64 -1,4711 1,44233
Source: Data proses by SPSS Statistics 20.
Based on the above table, it can be seen that the
amount of data used in this study is 120 data each
from the results of the M-Score and Altman Models
5 years in a row with a sample of 24 real estate and
property sector companies listed on the IDX. The
table shows that the known Altman Models as a
bankruptcy prediction tool has an average value of
5.6976, a standard deviation value of 4.85823, a
minimum value of -0.05 obtained by Cowell
Development Company (COWL) in 2018, and a
maximum value of 31.88 obtained by Indonesia
Prima Property Company (OMRE) in 2016. M-Score
as a cheating prediction tool has an average value of
-1.44711, a standard deviation value of 1.44233, a
minimum value of - 3.05 obtained by Fortune Mate
Indonesia Company (FMII) in 2014, and a maximum
value of 7.64 obtained by Duta Realty Company
(DART) in 2014.
4.4 Normality Test
Table 6: Normality Test
Shapiro Statistic D f Sig.
M-Score .940 21 .214
Z-Score .945 21 .276
Source: Data processed with SPSS Statistics 20
Based on the results of the normality test above,
it is known that the value of degree of freedom is 21
if the value of degree of freedom <50 then the
normality decision is taken using Shapiro. The
Shapiro output shows significant value for the
Altman Models of 0.214 and a significant value for
the M- Score of 0.276, because the significant values
of the two models> 0.05, it can be concluded that the
calculated Altman Models and M-Score data are
distributed normally.
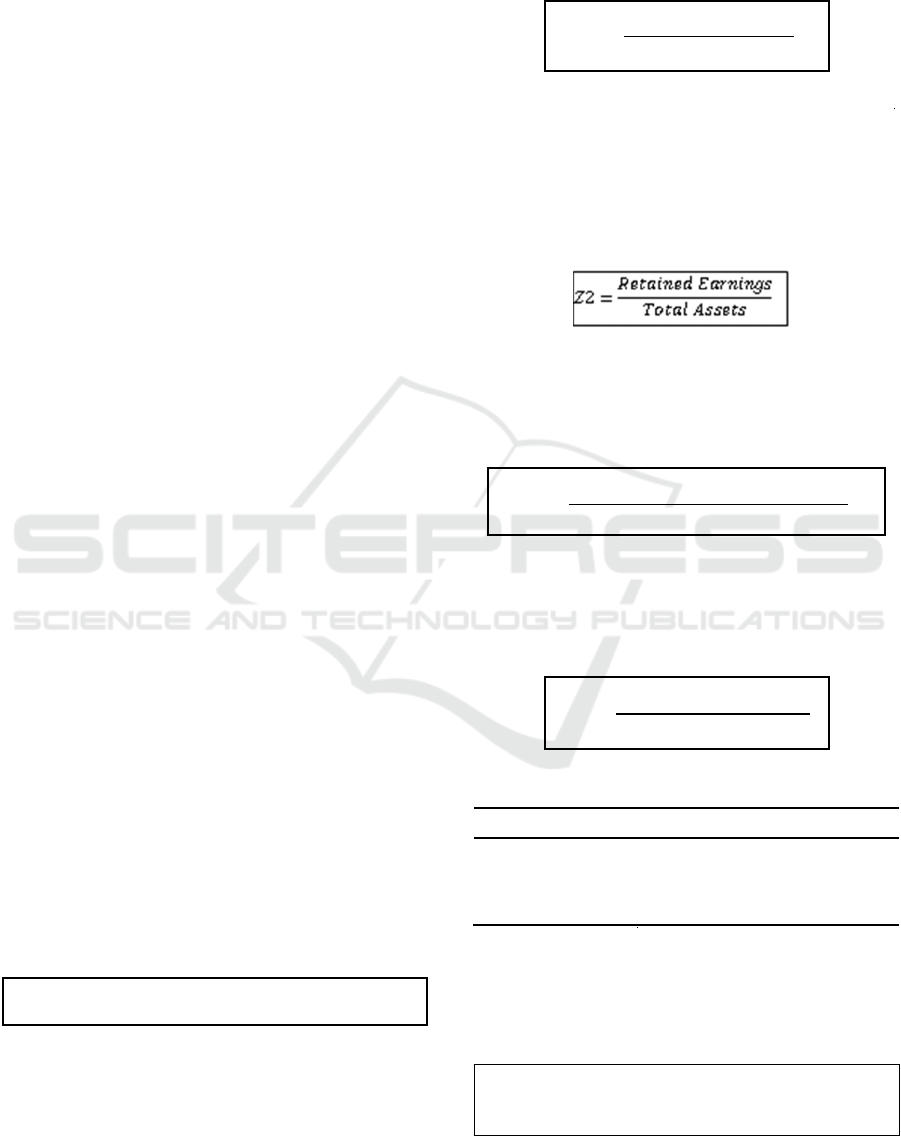
4.5 Descriptive Analysis
A summary of the company's conditions each year
from 2014 to 2018 using the Altman Models model is
as follows:
Figure 1: Company Conditions Using the Altman Models
Model
Overall based on the Altman Models results, the
property, and real estate sub-sector companies are in
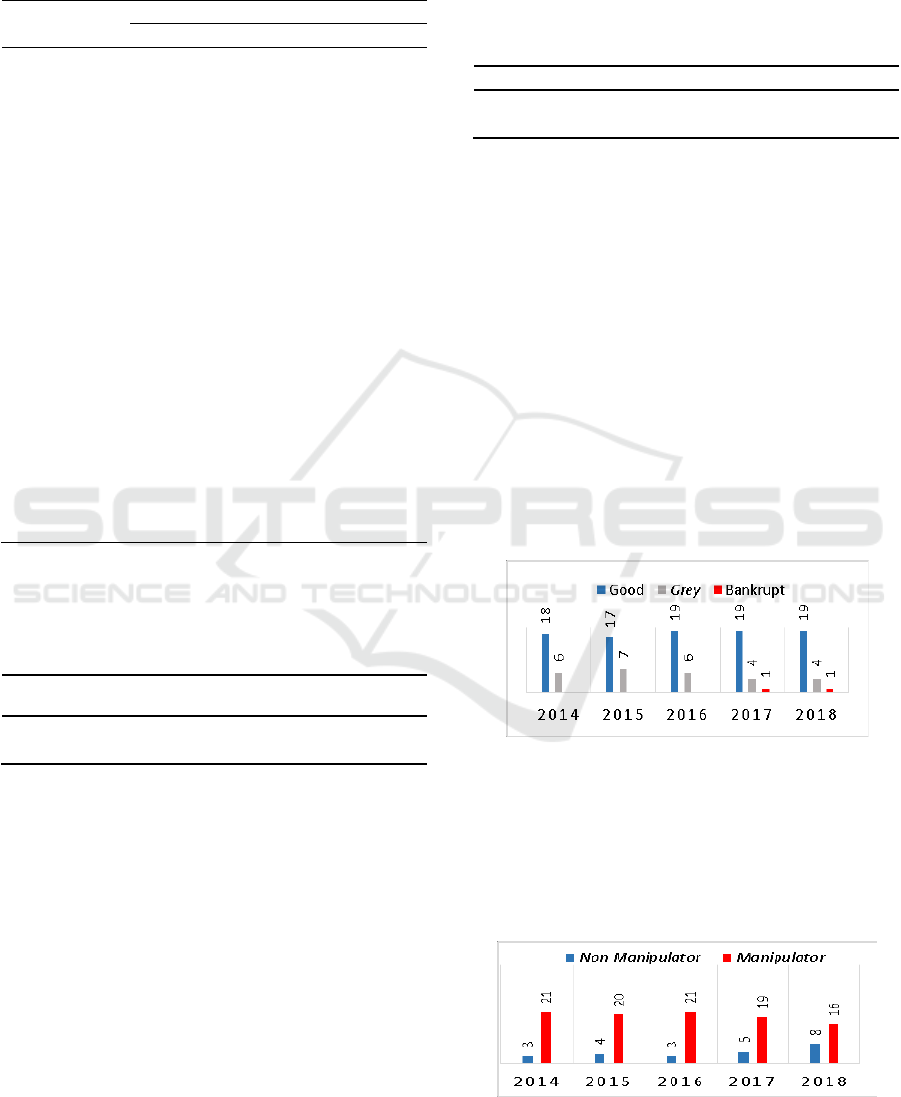
a healthy condition. A summary of the company's
conditions each year from 2014 to 2018 using the
Beneish Models M-Score model is as follows:
Figure 2: Company Conditions Using the Beneish Models
Model
Analysis of Corporate Bankruptcy and Financial Statement Fraud Prediction using Altman Models and Beneish Models
159

Overall based on the M-Score results, the property
and real estate sub-sector companies in 2014-2018
were classified as manipulators.
The two tables above show that the majority of
companies are in good health, but on the other hand,
most companies are detected as manipulators every
year. This shows that an analysis of the company's
financial condition and the detection of simultaneous
financial statement fraud is needed.
4.6.1 The Company Is Predicted to Go
Bankrupt before Manipulated
Based on the results of table 3 and table 4 calculations
using the Altman Models model and Beneish Models
model, there are companies that are predicted to be
in the bankruptcy zone before being classified as a
manipulator. This states that the first hypothesis (H1)
is supported. The company is as follows:
1. Fortune Mate Indonesia (FMII) Company
In 2014, the Altman Models of 2.25 indicated that
the Fortune Mate Indonesia companies was in a
bankrupt condition and the M-score of -5.05 showed
that the company was not classified as a
manipulator. 1 year to 2 years after the company is
predicted to be bankrupt, namely in 2016 and 2017,
the Altman Models of 7.74 and 13.44 shows that
companies leaving the gray zone are in good health
but the M- Score is 2.50 and -0.69 shows that the
company is classified as a manipulator. In 2014 the
overall M- Score results did not indicate that the
company was classified as a manipulator, but the
SGAI ratio value indicated the potential for fraud.
4.6 Data Analysis of Hypotheses
The company's 2014 financial report found that sales
decreased by 14% while operations increased by
7%. Beneish Models stated that the value of the
SGAI ratio ≥1,040 indicates the potential for fraud. In
2015 and 2016 the company left the gray zone but
the M-Score results stated that the company was
classified as a manipulator. This shows that the
company is indicated to be healthy because based on
the financial statements, the company experienced
an increase in sales of up to 437% in 2015 and 68%
in 2016. Beneish Models said an increase in sales
with an SGI ratio of 61,610 indicates the potential for
fraud. In 2015 and 2016 there was also an increase in
the composition of the accruals of assets owned by
the company. Beneish Models state an increase in
accrual transactions in revenue recognition with a
TATA ratio of ≥0.031 indicates the potential for
fraud. In 2016 the value of the AQI ratio increased
by 0.95 from the previous year, Beneish Models
stated that an increase in the amount of non-current
assets with an AQI ratio value ≥1,250 indicates the
potential for fraud.
In 2017 and 2018 the results of the FMII company
Altman Models are still in good health and the M-
Score shows the company is not classified as a
manipulator. Each of the Beneish Models ratios if
examined shows that there is still a potential
indicated ratio of fraud. The ratio is the DSRI ratio
based on financial statements, the company has
difficulty in collecting cash from debtors, and sales
decreased by 9% in 2017. The AQI ratio shows the
potential for fraud because of an increase in the
amount of current assets that can provide benefits in
the future.
The LGVI ratio value in 2017 also shows that the
potential for fraud is due to an increase in the amount
of corporate debt by 120%. In 2018 the company is in
a healthy condition and only the LVGI ratio is
indicated to be a possible manipulator due to fraud
committed in the previous year. The financial
statements show an increase in the amount of debt up
to 221%. This shows that the analysis of each result
of the M-Score ratio value is needed to make a
decision.
2. Indonesia Prima Property (OMRE)
In 2014 the results of the Altman Models 1.51
showed that the Indonesian Prima Property
companies was gray or prone to bankruptcy and the
M-Score - 2.38 results showed that the company was
not classified as a manipulator. One year after the
company is predicted to be prone to bankruptcy,
namely in 2015 the Altman Models of 15.01 shows
the company coming out of the gray zone to be in a
healthy condition but the M-Score value of -2.03
indicates that the company is classified as a
manipulator. In 2014 the overall M-Score results did
not indicate that the company was classified as a
manipulator, but the SGAI ratio value indicated the
potential for fraud.
The company's financial statements show that
there was an increase in operating expenses on
decrease sales. Beneish Models states an increase in
operating expenses with a value of SGAI ratio ≥1,040
indicates the potential for fraud. In 2015 the
company came out of the gray zone but the M-Score
results stated that the company was classified as a
manipulator. This shows that in 2015 the company
was indicated to be healthy due to a decrease in asset
quality with an AQI ratio of ≥1,250.
ICAESS 2020 - The International Conference on Applied Economics and Social Science
160

In 2016, 2017 and 2018, the company is in a
healthy condition and is not classified as a
manipulator, but if the M-Score ratio is analyzed one
by one, the value of the SGAI ratio 3 years in a row
will be potential for fraud. The financial report shows
that there was an increase in operating expenses by
1%, 0.82%, and 0.78% in sales which actually
continued to decrease. The value of the GMI ratio in
2017 also has the potential for fraud. A decrease in
profitability of the company's gross profit by 34% in
2017 caused the value of the GMI ratio ≥1,190 to
potential fraud. This shows that the analysis of each
result of the M-Score ratio value is needed to make a
decision.
The explanation above proves the existence of
companies that are in the gray zone or go bankrupt
before being classified as a manipulator. These results
are in accordance with the bankruptcy or the
condition of the company's financial difficulties can
lead to fraud (Albrecht, Albrecht, Albrecht, &
Zimbelman, 2012). This statement is in line with the
Fraud Triangle theory which states that one of the
causes of fraud is when under pressure and
opportunity (Cressey, 1953). Abuse of authority by
management is done to produce financial reports that
are always good so investors remain interested in
investing their capital (Jensen & Meckling, 1976).
This result is also in line with other research on
companies that have been declared cheating by using
the Altman Models model and Beneish Models
model, that prior to fraud, the company was in a
bankrupt situation (Kartikasari & Irianto, 2010)
(Maccarthy, 2017) (Abbas, 2017).
4.6.2 The Company Is Predicted to Be
Classified as a Manipulator before It
Is in the Bankruptcy Zone
Based on the results of the Altman Models and
Beneish Models Model calculations in table 3 and
table 4, there are companies that are predicted to be
classified as manipulators before being in the
bankruptcy zone. This states that the second
Hypotheses (H2) is supported. The company is as
follows:
1. APLN Company
Table 3 shows that in 2014 a Altman Models of
2.977 stated that the company was in good health
but an M-Score of -2.15 indicated the company was
classified as a manipulator from 2015 to 2018, after
being predicted to be classified as a manipulator, the
company's Altman Models value indicates a
bankrupt condition and is consistent with the
potential for fraud. The potential ratio variables for
fraud are as follows:
a. SGAI ratio value
In 2014 the sales increased by 7.5% but not in
accordance with the increase in operating expenses
and in 2018 it was known from the company's
financial statements, there was a 28% decrease in
sales resulting in an SGAI ratio ≥1,040 indicating a
potential for fraud due to the decrease prospects.
b. TATA ratio value
In 2014, 2015, 2016, and 2017, it is known that the
amount of cash generated from profits is low, namely
46%, 29%, 31%, and 36% of the operating profit
obtained. This causes the value of the TATA ratio
00.031 so that it is indicated the potential for fraud.
c. DSRI Ratio Value
In 2018 there was an increase in the amount of
receivables by 9.2% and a 28% decrease in sales
which led to a DSRI value of 41,460 which was
potential for fraud.
This explains that the fraud committed caused
bankruptcy and it will be difficult to stop committing
fraud because the company must continue to cover up
the fraud committed with other new frauds. Other
research states that this property issuer indeed carries
various bad records related to the condition of his
company.
2. BKSL Company
In 2014, the Altman Models was 2.98, which means
the company was in good health, but the M-Score
was - 1.57, indicating the company was classified as
a manipulator. A year after it was predicted to be
classified as a manipulator, the 2015 Altman Models
indicates that the company is prone to bankruptcy
and continues to have the potential for fraud. In2014
the company was in good health but there was a
decrease in profitability of the company's gross profit
by 45%, a decrease in the quality of fixed assets by
87%, and an increase in operating expenses by 29%
in sales which actually decreased by 26%. This causes
the value of the GMI ratio ≥1,190, the value of the
AQI ratio ≥1,250, and SGAI ≥1,040 which indicates
the potential for fraud.
In 2015, when the Altman Models showed that
the company was prone to bankruptcy, according to
information that the company had worsened due to
the decrease in gross profit because of the large
number of sales which fell after being caught in a
bribery case. In 2016, 2017, 2018, even though the
company left the bankrupt zone, the M-Score
Analysis of Corporate Bankruptcy and Financial Statement Fraud Prediction using Altman Models and Beneish Models
161

indicates the company was classified as a
manipulator. This shows that a company that looks
fine is not necessarily free from all forms of fraud.
Fraud detection analysis must be carried out before
the possibility of bankruptcy in the following years.
3. DART Company
In 2014 the Altman Models was 3.89, indicating that
the company was in good health but the M-Score of
7.64 indicated that the company was classified as a
manipulator from 2015 to 2018 after being predicted
to be classified as a manipulator, the company's
Altman Models value indicates a bankrupt and prone
to bankruptcy potential, except in 2016. The potential
ratio variables for fraud are as follows:
a. DSRI ratio
In 2014, 2015 and 2016 from the company's financial
statements known to increase receivables by
1,541%, 24%, and 23%. Beneish Models states if the
value of accounts receivable that increases with a
DSRI value of ≥1,040 are potential for fraud.
b. DEPI Ratio
In 2014, 2016, 2017, and 2018 there was a decrease
in depreciation of assets which actually increased.
Beneish Models stated that the delay in disclosure of
depreciation with a DEPI value of 01,077 is potential
for fraud.
c. SGAI ratio
From 2014 to 2018 the value of the SGAI ratio
≥1,040, which indicates the potential for fraud. Sales
increased in 2014 but were not in line with the
number of operational increases, and sales decreased
in the following years but operational expenses that
actually increased caused the company to be detected
as the potential for fraud.
d. TATA Ratio
In 2014, 2015 and 2017, it is known that the amount
of cash generated on earnings is low and this explains
that the fraud committed caused bankruptcy. In 2015
the company was in a bankrupt condition after being
classified as a manipulator with a very high M-score.
In 2016 it was known that PT Indonesian Rating
Agency had downgraded Duta Realty Company
rating due to the weakening of financial conditions.
This is consistent with the detection using the Altman
Models model that in 2015 the company was in
bankruptcy condition and in 2016 the company
ranking was lowered.
The explanation above proves the existence of
companies that are predicted to be classified as
manipulators before being in the gray zone or going
bankrupt. The results of this hypothesis analysis are
in accordance with the statement other research
which explains that in general bankruptcy
experienced by large companies is due to the
manipulation of financial statements (Irianto, 2003).
This statement is in line with the Fraud Triangle
theory which states that one of the causes of fraud is
the opportunity (Cressey, 1953). The opportunity is
owned by management as a party that is more
flexible about the company's financial statements
(Jensen & Meckling, 1976). The statement of other
research the desire and ambition to achieve a
company is often followed by fraud (Christy, Sugito,
& Abdul, 2015). Companies always want to have
financial reports that look good when the fraud can
actually lead to bankruptcy in the future.
4.6.3 Companies That Are Classified as
Manipulators Simultaneously Are Also
Predicted to Be in the Bankruptcy
Zone
Based on the results of the calculation of table 3 and
table 4 using the Altman Models model and Beneish
Models model, there are companies that are classified
as manipulators simultaneously also in the
bankruptcy code. This states that the third hypotheses
(H3) is supported. The company is as follows:
1. ASRI Company
Table 3 shows that in a row from 2014 to 2018, the
Altman Models value stated that the company was in
a bankrupt condition and the M-Score was as large as
indicating the company was classified as a
manipulator. The potential ratio variables for fraud
are as follows:
a. DSRI ratio
In 2014, 2015, and 2016 there was an increase in
receivables by 77% in 2014, a decrease in sales by
2.5% in 2015, and an increase in receivables by 51%
in 2016 and a decrease in sales resulting in a DSRI
value ≥1,040 indicating potential for fraud.
b. DEPI Ratio
In 2018 there will be a depreciation decrease of
21%. Beneish Models stated that the delay in
disclosure of depreciation with a DEPI value of
01,077 is potential for fraud.
c. SGAI ratio
In 2014 and 2018 the value of the SGAI ratio
≥1,040 indicated the potential for fraud. There was
ICAESS 2020 - The International Conference on Applied Economics and Social Science
162

an increase in sales, but operating expenses decreased
so the company was suspected to be a manipulator
as stated by Beneish Models.
d. TATA Ratio
In 2015 it was known that operating profit rose 75%
but the amount of cash generated was not significant
and caused the value of the TATA ratio ≥0.031 so
that it was indicated as a potential for fraud.
This explains that there is a relationship between
fraud and bankruptcy. This must be watched out
because the value of the company that does not
improve and running its operations through fraud can
ultimately cause the company to go bankrupt.
2. Cowell Development (COWL) Company
Consequently from 2014 to 2017, the Altman Models
value states that the company is in a bankrupt
condition and M-Score is equal to indicate the
company is classified as a manipulator, whereas in
2018 the company is not classified as a manipulator
but is in a bankrupt condition. In 2014 from the value
of DSRI, the company is predicted to overestimate the
number of sales, the value of TATA shows the amount
of cash generated from earnings is not appropriate,
and the value of LVGI shows an increase in the
amount of debt by 206%. The SGI ratio is also
detected as the potential for fraud because sales rose
sharply by 70% so it is feared that the company has
the drive to continue to maintain and raise the sales
target. In 2017 based on the very high DSRI value,
namely an increase due to an increase in receivables
by 77%, indicating companies are having difficulty
collecting cash from the debtors. In 2018, the
company is not classified as a manipulator but is
already in the bankrupt zone, but the ratio still has
SGAI value that has the potential for fraud. Cowell
Development Company in 2018 is predicted to be in
bankrupt condition with the lowest Altman Models
value among all property and real estate sub-sector
companies because it is known that in 2018 the
company was declared to have suffered a very high
loss of 162 Billion Rupiah.
3. DILD Company
Respectively from 2014 to 2018, the Altman Models
value states that the company is in a bankrupt
condition, and an M-Score value of indicates the
company is classified as a manipulator. The potential
ratio variables for fraud are as follows:
a. DSRI ratio
In 2015 and 2018 there was an increase in sales but
accounts receivable increased by 51% in 2015 and
65% in 2016 which resulted in a DSRI value
≥1,040 indicating potential for fraudulent.
b. GMI ratio
In 2015 there was a decrease in the profitability of
gross profit where there was an increase in sales by
16% but not significantly to the increase in gross
profit. Beneish Models stated the value of the GMI
ratio ≥1,190 potential for fraud.
c. SGAI ratio
In 2014, 2015 and 2016 the value of the SGAI ratio
≥1,040 indicated the potential for fraud. There has
been an increase in sales for 3 years in a row, but it is
not in accordance with the increase in operating
expenses so the company is suspected to be a
manipulator as stated by Beneish Models (Beneish,
1999).
d. TATA Ratio
From 2015 to 2017 it was found that the company
experienced a deficit that showed an increase in
accrual transactions in revenue recognition. TATA
ratio value 00,031 so that it is indicated the potential
for fraud.
In 2016 it was known that Indonesia Securities
Rating downgraded Development Company in
accordance with the Altman Models prediction that
the company was right in bankruptcy since 2015. This
shows that the company continued to commit fraud to
run its operations even though the fraud did not make
the company look good- fine. This condition is very
dangerous to the company's value if there is no further
effort to analyze and improve the company's prospects
going forward.
The explanation above proves the existence of
companies classified as manipulators is also predicted
to be in the gray zone or go bankrupt. This result is
in line with other research that companies that are
predicted to go bankrupt are also detected to
manipulate financial statements (Mavangere, 2015).
This is in line with the theory of Fraud Triangle
which states that one of the causes of fraud is when
there is an opportunity when management wants to
commit fraud and pressure when the company is in
bad condition so that fraud continues (Cressey, 1953).
Although the accuracy of the ratio of the Altman
Models model and the ratio of the Beneish Models
model is not 100%, it is better to detect it in order to
avoid unwanted losses in the future.
Analysis of Corporate Bankruptcy and Financial Statement Fraud Prediction using Altman Models and Beneish Models
163

Property business observer explained that the
condition of the property subsector over the past 5
years was indeed not conducive because it was still in
a phase of stagnation, one of the factors stemming
from the wait and see actions of investors towards the
political year and tax reporting. The use of the
Altman Models model and the Beneish Models
model together is very helpful to find out the actual
financial condition of the company rather than just
using the Altman Models model which shows the
property and real estate companies are in a healthy
condition but it turns out to be potential for fraud. The
detection of the Beneish Models model still has the
possibility of inaccuracy in classifying the company.
The explanation above proves the existence of
companies classified as manipulators is also predicted
to be in the gray zone or go bankrupt. This result is
in line with other research that companies that are
predicted to go bankrupt are also detected to
manipulate financial statements (Mavangere, 2015).
Other research which states that one of the
causes of fraud is when there is an opportunity when
management wants to commit fraud and pressure
when the company is in bad condition so that fraud
continues (Cressey, 1953). Although the accuracy of
the ratio of the Altman Models model and the ratio
of the Beneish Models model is not 100%, it is better
to detect it in order to avoid unwanted losses in the
future.
5 CONCLUSION
The author can conclude the three supported
hypotheses that there are companies that are predicted
to be in the bankruptcy zone before being classified as
a manipulator. This shows that the condition of the
company's financial difficulties can cause companies
to commit financial statements. There are companies
that are predicted to be classified as manipulators in
the bankruptcy zone. This shows that fraud will also
cause the company to be in a vulnerable condition to
go bankrupt or bankrupt. There are companies that are
predicted to be classified as manipulators
simultaneously and also predicted to be in the
bankruptcy zone. This states that the company
continues to commit fraud to carry out its operations
even though the fraud does not make the company
look okay. This also shows that the company's
bankruptcy conditions are vulnerable to fraud.
Stakeholders will be better protected when the
Altman Models model and the Beneish Models model
are jointly used to see the company's condition.
REFERENCES
Abbas, A. (2017). Earnings Fraud and Financial. 117-134.
Asia Pasific Fraud Journal.
ACFE. (2016). Report to Nations on Occupational Fraud
and Abuse Global Study 2016.
Albrecht, W. S., Albrecht, C. O., Albrecht, C. C., &
Zimbelman, M. F. (2012). Fraud Examination 4th
Edition. Natorp Boulevard: South-Weastern, Chengage
Learning.
Z-Score, E. I. (1968). Financial Ratios, Dscriminant. 589-
609. Journal of Finance.
Z-Score, Peck, & Hartzell, J. (1995). Emerging Markets
Corporate Bonds: A Scoring System. Wiley and Sons.
Beneish, M. D. (1999). The Detection of Earning
Manipulation. Financial Analysis Journal.
Christy, I. M., Sugito, & Abdul, H. (2015). Penerapan
Formula Beneish M-Score dan Analisis DIiskriminan
Linier untuk Klasifikasi Perusahaan Manipulator dan
Non Manipulator. 287-293. Jurnal Gaussian.
Cressey, D. (1953). Other People's Money: a Study in The
Social Psychology of embezzlment.
Deil, S. A. (2014, April 3). Retrieved from Liputan6.com:
https://www.liputan6.com/bisnis/read/2031867/ enron-
skandal-besar-perusahaan-energi-yang- cekik-investor.
Gumiwang, R. (2018). Kasus SNP Finance: Upaya
Menutup Celah Curang Keuangan. Retrieved from
tirto.id: www.tirto.id.
Irianto, G. (2003). Skandal Korporasi dan Akuntan.
Jensen, & Meckling. (1976). The Theory of The Firm:
Manajerual Behaviour, Agency Cost, and Ownership
Srucrute. 305-360. Journal of Financial and Economics.
Kartikasari, R. N., & Irianto, G. (2010). Penerapan Model
Beneish (1999) dan Model Altman Models (2000)
dalan Pendeteksian Kecurangan Laporan keuangan.
Jurnal Akuntansi Multiparadigma.
Maccarthy, J. (2017). Using Altman Models Altman
Models and Beneish M-Score Models to Detect
Financial Fraud and Corporate Failure: A Case Study of
Enron Corporation. 159-166. International Journal of
Finance and Accounting 2017.
Mavangere, K. (2015). Predicting corporate bankruptcy and
earnings manipulation using the Altman Models
Altman Models and Beneish M score. International
Journal of Management Sciences and Business
Research.
Pertiwi, H. A. (2015, October 20). Perusahaan dengan
Skandal Terbesar di Dunia. Retrieved from
www.economy.okezone.com.
Syakur, A. S. (2015). INTERMEDIATE ACCOUNTING.
Jakarta: AV Publisher.
ICAESS 2020 - The International Conference on Applied Economics and Social Science
164
