
Effect of Liquidity on Profitability
Yanshanti Buan Agusfina, and Sinarti
Department of Business Management, Politeknik Negeri Batam, Jl. Ahmad Yani, Batam, Indonesia
Keywords: Liquidity, Profitability, Current Ratio, Quick Ratio, Liquid Ratio, Net Profit Margin, Return on Equity, Return
on Capital Employed.
Abstract: This study aims to determine the effect of liquidity and profitability on 20 companies listed on the Indonesia
Stock Exchange in the infrastructure, utilities and transportation sectors for 5 years from 2013 -2017. This
study uses regression analysis to test 3 indicators of liquidity ratio (current ratio, quick ratio, and liquid ratio)
and 3 indicators of profitability ratio (net profit margin, return on equity, and return on capital employed).
The results of this study found that 2 liquidity indicators affect profitability indicators and 7 liquidity
indicators do not affect profitability indicators. Liquidity indicators that affect profitability indicators are the
Current Ratio significantly influence Return on Equity and, Quick ratio significantly influence to Return on
Capital Employed.
1 INTRODUCTION
Company management has an important task in
deciding and managing the company's economy in
order to maximize value and optimize profits.
Financial statements have the main focus of earnings,
financial statement information should have the
ability to predict future earnings with reference to
earnings in previous years. The optimal level of profit
can be calculated and analysed using profitability
ratios. Profitability ratios calculate the level of
company profitability in relation to the sale of total
assets, as well as own capital (Sartono, 2001). The
amount of profit is often compared to financial
conditions, this is to assess whether a company tends
to focus on profit or focus on company liquidity.
According to Hanafi & Halim (2012) Liquidity is
a measure of a company to meet short-term
obligations by considering current assets. Liquidity
refers to the company's ability to meet its short-term
obligations. Liquidity management ensures that the
company has the ability to meet current obligations.
Companies with high liquidity have a low
profitability risk, therefore companies must accept
low profits.
The company will be faced with a condition when
the company must determine the decision between
liquidity and profitability. If the company prefers to
increase the level of profit (profitability) will reduce
the level of liquidity. Conversely, if the company
prefers to increase liquidity, the company will reduce
the level of profitability. This needs to be considered
by the company, considering the liquidity and
profitability are two important things to guarantee and
develop the company's survival in the future. A high
level of liquidity allows the company to pay
obligations, but if the level of liquidity is low then the
company will experience insolvency and if this
problem continues to drag on, the company will likely
experience bankruptcy.
Previous research was conducted by Darmawan
(2010) in Indonesia using financial statements, with
the result that the liquidity ratio increased, but in
reality, the company was unable to pay the company's
obligations. The value of liabilities is higher than the
value of a guarantor owned by the company. The
company's profitability ratio generates significant
profits. Subsequent research in Sri Lanka by
(Ajanthan, 2013) found a significant relationship
between liquidity and profitability. Olerewaju &
Adeyemi (2015) investigated the existence and
direction of the interconnection between liquidity and
profitability for the period 2004-2013. They found no
causal relationship between liquidity and profitability
for 11 banks and unidirectional causality for 4 banks.
Similar research was also conducted by Hamid &
Akhi (2016) in Bangladesh, they suggest that there
is no significance between profitability and liquidity
in chemical companies in Bangladesh except Current
Ratio. Suryaningsih (2018) conducted a study in
Agusfina, Y. and Sinarti, .
Effect of Liquidity on Profitability.
DOI: 10.5220/0010354301470153
In Proceedings of the 2nd International Conference on Applied Economics and Social Science (ICAESS 2020) - Shaping a Better Future Through Sustainable Technology, pages 147-153
ISBN: 978-989-758-517-3
Copyright
c
2021 by SCITEPRESS – Science and Technology Publications, Lda. All rights reserved
147

Indonesia on construction and building sub-sector
companies, the results of which liquidity and
solvency affected profitability.
Throughout 2017 the realization of investment
has increased especially in the infrastructure, utilities,
and transportation sectors reaching 51.42%.
Investment worth IDR 708.9 billion is recorded in
domestic investment in the transportation equipment
business. The Central Statistics Agency (BPS)
informs the public that in 2017 Indonesia's economic
growth reached 5.07% and stated that the
transportation and warehousing sector had the fastest
growth.
Chairman of the Indonesian Supply Chain,
Setijadi predicts that in 2019 Indonesia's
transportation sector will grow to reach 11.15% to
Rp740.4 trillion. On the other hand, the
telecommunications industry in 2018 experienced the
worst conditions in its growth. According to
Ririek Adriansyah as chairman of the
Telecommunications Association said that the growth
of Indonesian telecommunications - 6.4%, this is the
worst history during the growth of the Indonesian
telecommunications industry. The
telecommunications industry experienced a decline,
but at the same time in the era of President Jokowi's
administration, within 5 years the government
accelerated the construction of infrastructure into the
National Strategic Project (PSN). Until now the
National Strategic Project is recorded in the process
of working as many as 245 PSN at a cost of up to
Rp4,197 trillion rupiah. The current condition of
industry growth, especially in the infrastructure,
utilities and transportation sectors, requires
management's attention and management at every
company. It is important to consider the economic
growth promoted by the infrastructure, utilities and
transportation sectors.
2 LITERATURE REVIEW
Several studies on the relationship between liquidity
and profitability have been carried out, including
Konadu (2009) who examined the effects of liquidity
on profitability for banks listed on the Ghana Stock
Exchange for the period 2002-2006. Konadu includes
Current Ratio, Quick ratio, cash ratio, and net
operating cash flow ratio as indicators of liquidity.
Meanwhile, net profit margin, Return on Equity
(ROE), Return on Assets (ROA) and net asset
turnover ratios as indicators of profitability. The
results identified a negative relationship between
liquidity and profitability in the Ghana banking
sector. Research conducted by Vieria (2010)
examined the relationship between liquidity and
profitability of airlines for 2005-2008 between short
and medium term found a positive relationship in
both cases.
Subsequent research by Saleem & Rehman
(2011) examined 26 oil and gas companies from
Pakistan for 2004-2009 to identify the
interdependence of liquidity and profitability. They
find that Current Ratio, Quick ratio and liquidity ratio
have a significant impact on Return on Investment
(ROI) while only liquidity ratios affect ROA and have
no impact on ROE. A similar study conducted by
Niresh (2012) examined the cause and effect
relationship between liquidity and profitability for 31
manufacturing companies listed in 2007-2011 in Sri
Lanka found no significant relationship between
liquidity (Current ratio, Quick ratio, and Liquid ratio)
and profitability (net profit, return on capital used,
and ROE).
Saluju & Kumar (2012) in their research on the
liquidity and profitability trade off from Airtel Bharti
Limited for 5 years found a negative relationship
between liquidity and profitability. Siame (2012)
analyzes the effect of liquidity on profitability for 120
companies registered from different industries of
South Africa between 2000-2009 and concludes that
for all industries namely the consumer goods
industry, the resource industry, and the service sector,
there is a negative relationship between profitability
and liquidity measured by the cash conversion cycle.
Further research conducted by Bolek & Wilinski
(2012) studied the relationship between liquidity and
profitability of construction companies listed on the
Warsaw Stock Exchange index for the quarter period
in 2000-2010 and concluded that the possible
influence of the Quick ratio on ROA was around
98.24% which was 80 .77% for the cash conversion
cycle. The results of research by Ibe (2013) which
explored the impact of liquidity management on
profitability for Afribank Plc, United Bank for Africa,
and Diamond Bank Plc. Nigeria from 1995-2010 and
found a significant relationship between bank
liquidity and profitability. In addition, this study also
identified liquidity management as a major problem
for the Nigerian banking industry.
Zygmunt (2013) tried to find out the impact of
liquidity on profitability for 10 IT companies
registered from Poland for 2003-2011 and concluded
a statistically significant correlation. He found a
positive relationship between the receivable
conversion period and the inventory conversion
period with profitability (ROA, ROE and return on
sales).
ICAESS 2020 - The International Conference on Applied Economics and Social Science
148

A similar study was carried out in Bangladesh by
Akter & Mahmud (2014) that identified the
relationship between liquidity and profitability of the
banking sector in Bangladesh. They examined 12
banks from 4 different sectors namely government,
Islamic, multinational, and private commercial banks
for 2006-2011 and found no significant relationship.
Olerewaju & Adeyemi (2015) investigated the
existence and direction of the interconnection
between liquidity and profitability of 15 quoted bank
deposit money in Nigeria for the period 2004-2013.
They found no causal relationship between liquidity
and profitability for 11 banks and unidirectional
causality for 4 banks.
Mahardika (2015) uses the 2012-2014 quarterly
financial statements of the company. The sample used
was 10 property companies registered with ISSI. The
results of the study explained that jointly and
simultaneously (F test) liquidity affects profitability
(ROI and ROE). Suryaningsih (2018) tested the effect
of liquidity ratios and solvency ratios on profitability
in the construction and building subsector companies
on the Indonesia Stock Exchange for the period 2012-
2016, using a sample of 10 companies and periods
during the year. The result is liquidity and solvency
affect profitability.
Based on the results of research on 26 oil and gas
companies from Pakistan for 2004-2009 to identify
the interdependence of liquidity and profitability.
They find that Current Ratio, Quick ratio and Liquid
Ratio have a significant impact on Return on
Investment (ROI) while only liquidity ratios affect
ROA and have no impact on ROE (Saleem & Rehman
2011). The financial statements report how the
condition and financial position of a company in
the period and operational activities for several
periods. The condition and position of financial
statements can be studied and analysed using
financial ratios. Financial ratios are designed to assist
and evaluate financial statements (Brigham &
Houston, 2014).
Based on this explanation, the hypothesis can be
formulated as follows:
H1: Current Ratio significantly influences the Net
Profit Margin.
H2: Current Ratio significantly influences Return
on Equity.
H3: Current Ratio significantly influences the
Return on Capital Employed.
H4: Quick ratio significantly influences the Net
Profit Margin.
H5: Quick ratio significantly influences Return
on Equity.
H6: Quick ratio significantly influences Return
on Capital Employed.
H7: Liquid Ratio significantly influences the Net
Profit Margin.
H8: Liquid Ratio significantly influences Return
on Equity.
H9: Liquid Ratio significantly influences Return
on Equity Capital Employed.
3 RESEARCH METHOD
The technique used in sampling is non-probability
sampling, namely purposive sampling, the sample is
based on special provisions. In determining the
sample, it is required that only infrastructure, utilities,
and transportation companies have financial
statements listed on the Indonesia Stock Exchange for
the period 2013-2017. The company must also report
profitability and liquidity during the observation year.
If the sample does not meet these requirements, the
sample cannot be used.
Data analysis techniques are used to answer the
research hypothesis. The analytical tool used is
simple linear regression using the help of a programs
PSS 20.
According to Ghozali (2013), to measure the
strength of the relationship between variables using
regression analysis. Simple linear regression is a
method to determine the effect of two variables that
are divided into dependent and independent variables
and show the direction of the relationship. Regression
can be calculated with the following formula:
Y = α + βx (1
)
Information:
Y : Dependent Variable
α : Constant
βx : Variable Coefficient x
The basis for decision making in the regression
analysis can be seen from the significance value, i.e.
if the significance value> 0.05 then there is no
influence of the independent variables on the
dependent variable. Conversely, if the significance
value <0.05 then there is the influence of the
independent variable on the dependent variable.
The object of research used in this study is
infrastructure, utilities, and transportation companies
which publish their financial statements and are listed
on the Indonesia Stock Exchange. The sample taken
is a sample selected using predetermined criteria.
Effect of Liquidity on Profitability
149
74 companies are listed as population companies
listed on the Indonesia Stock Exchange, because this
research uses purposive sampling where the sample
must be based on certain criteria when used in
research. There were 54 companies that did not meet
the criteria for the study sample. Then, researchers
found 20 companies that fit the research criteria to be
used as research samples. Furthermore, the 20
companies multiplied by 5 years, the researchers get
a total of 100 samples.
4 RESULT AND DISCUSSION
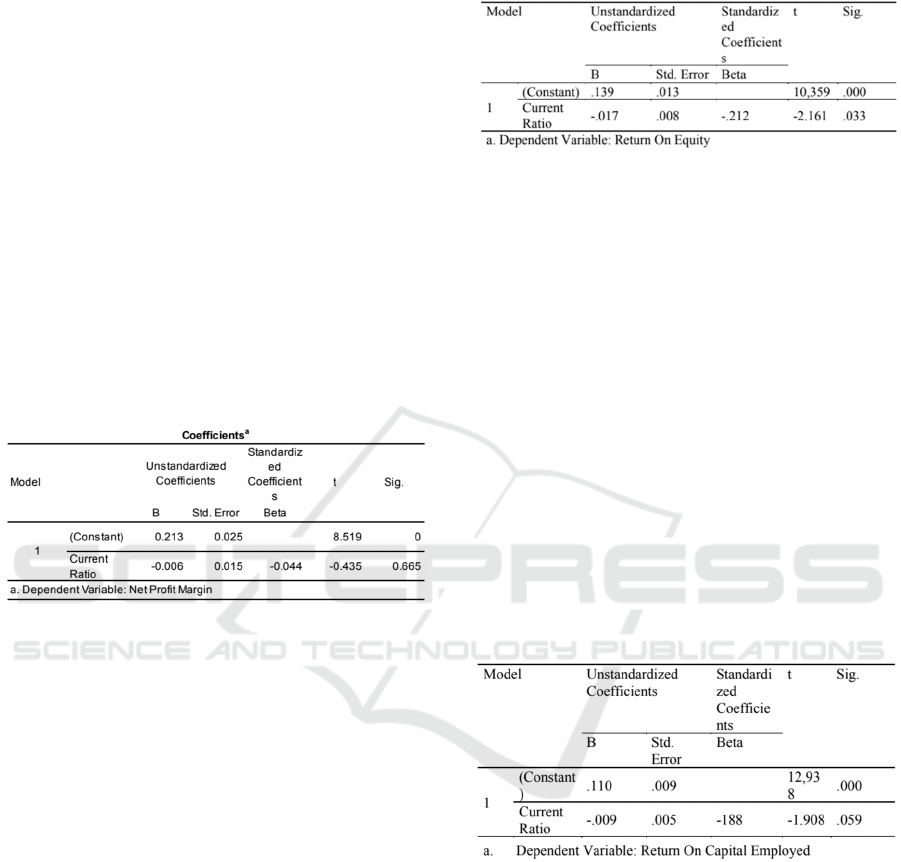
The results of testing Hypothesis 1 regarding the
effect of Current Ratio on Net Profit Margin can be
seen in table 1.
Table 1: Result of the simple linear regression testing
hypothesis 1.
Based on the test results above, it can be seen that
the significance level of 0.665 is greater than 0.05, so
hypothesis 1 that is the current ratio significantly
influences the unsupported net profit margin. This
means that the net profit margin is not influenced by
the current ratio as an indicator of the liquidity ratio.
The results of this study are in line with research
conducted by Niresh (2012) who examined the cause
and effect of the relationship between liquidity and
profitability for 31 manufacturing companies
registered in 2007-2011 in Sri Lanka found no
significant relationship between liquidity (Current
ratio, Quick ratio , and Liquid ratio) to net profit
margin as an indicator of profitability.
Hypothesis 2 test results about the effect of the
current ratio on return on equity can be seen in table
2.
Table 2: Result of the simple linear regression testing
hypothesis 2.
Based on the test results above it can be seen that
the significance level of 0.033 is smaller than 0.05 so
that the 2 current ratio hypothesis has a significant
effect on return on equity, so this hypothesis is
supported. It can be concluded that the return on
equity is influenced by the current ratio as an
indicator of liquidity ratios. The results of this study
contradict the previous research conducted by Saleem
& Rehman (2011) examined 26 oil and gas
companies from Pakistan for 2004-2009 to identify
interdependencies of liquidity and profitability. They
find that Current Ratio, Quick ratio and liquidity ratio
have a significant impact on Return on Investment
(ROI) while only liquidity ratios affect ROA and have
no impact on ROE.
Hypothesis 3 testing results about the effect of
Current Ratio on Return on Capital Employed can be
seen in the following table 3.
Table 3: Result of the simple linear regression testing
hypothesis 3.
Based on the results, can be seen that the
significance level of 0.059 is greater than 0.05, it can
be concluded that the hypothesis 3 Current Ratio
significantly influence Return on Capital Employed
can be stated hypothesis test results 3 are not
supported. This means that the return on employed
capital is not influenced by the current ratio as an
indicator of the liquidity ratio. The results of this
study are in line with previous studies conducted by
Saleem & Rehman (2011) and Niresh (2012).
The results of testing the hypothesis about the
effect of Quick Ratio on Net Profit Margin can be
seen in table 4.
ICAESS 2020 - The International Conference on Applied Economics and Social Science
150
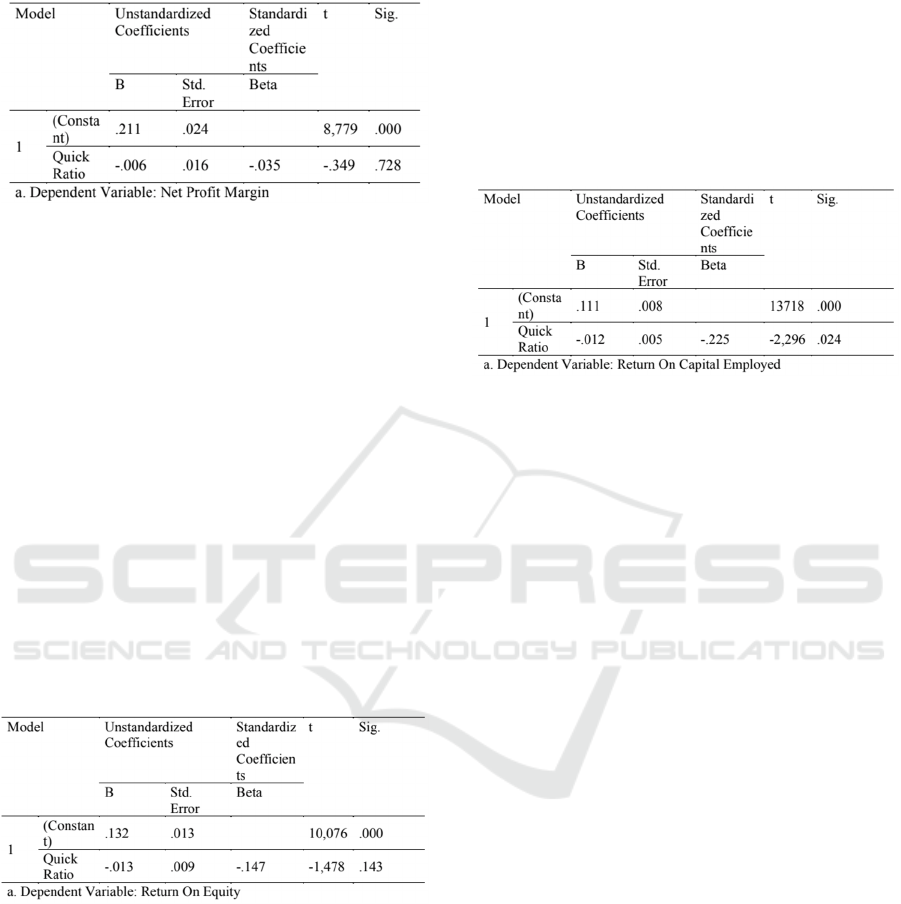
Table 4: Result of the simple linear regression testing
hypothesis 4.
Based on results the above test can be seen that
the significance level of 0.728 is greater than 0.05, it
can be concluded that Hypothesis 4 Quick Ratio
significantly affects the Net Profit Margin it can be
stated that the results of hypothesis 4 test are not
supported. It can be concluded that the net profit
margin is not affected by the quick ratio as an
indicator of liquidity ratios. This results is in line with
research conducted by Niresh (2012) who examined
the cause and effect of the relationship between
liquidity and profitability for 31 manufacturing
companies registered in 2007-2011 in Sri Lanka did
not find a significant relationship between liquidity
(Current ratio, Quick ratio, and Liquid ratio) to the net
profit margin as an indicator profitability.
The results of testing the hypothesis about the
effect of Quick Ratio on Return on Equity can be seen
in table 5.
Table 5: Result of the simple linear regression testing
hypothesis 5.
Based on the results of the above test it can be seen
that the significance level of 0.143 is greater than
0.05, it can be concluded that the 5 Quick Ratio
hypothesis has a significant effect on Return on
Equity, it can be stated that the results of hypothesis
test 5 are not supported. It can be concluded that
return on equity is not influenced by quick ratio as an
indicator of liquidity ratios. The results are in line
with the results of previous studies conducted by
Saleem & Rehman (2011) examined 26 oil and gas
companies from Pakistan for 2004-2009 to identify
interdependencies of liquidity and profitability. They
found that the quick ratio had a significant impact on
Return on Investment (ROI) while only the liquidity
ratio affected ROA and had no impact on return on
equity (ROE).
The results of testing the hypothesis about the
effect of Quick Ratio on Return on Capital Employed
can be seen in table 6.
Table 6: Result of the simple linear regression testing
hypothesis 6.
Based on the results of the above test it can be seen
that the significance level of 0.024 is less than 0.05, it
can be concluded that the hypothesis 6 Quick Ratio
significantly influences Return on Capital Employed
can be stated that the results of the hypothesis test 6
are supported. It can be concluded that the return on
capital employed is influenced by the quick ratios an
indicator of liquidity ratios. The results of the
research in hypothesis 6 (H6) are in line with the
results of previous studies conducted by Viera (2010)
found a positive effect on quick ratio as an indicator
of liquidity on return on capital employed as an
indicator of profitability. The results of the three
hypothesis tests state that there is a negative influence
which means that if there is an increase in the quick
ratio liquidity indicator it will reduce the profitability
indicator of net profit margin, return on equity and
return on capital employed. Conversely, if there is a
decrease in the liquidity indicator quick ratio will
increase the profitability indicator of net profit
margin, return on equity and return on capital
employed.
The results of testing the hypothesis of the effect
of Liquid Ratio on Net Profit Margin can be seen in
table 7.
Based on the results of the above test it can be seen
that the significance level of 0.639 is greater than
0.05, it can be concluded that the 7 Liquid Ratio
hypothesis significantly influences the Net Profit
Margin, it can be stated that the results of the
hypothesis 7 test are not supported. It can be
concluded that the net profit margin is not affected by
liquid ratio as an indicator of liquidity ratios.
Effect of Liquidity on Profitability
151
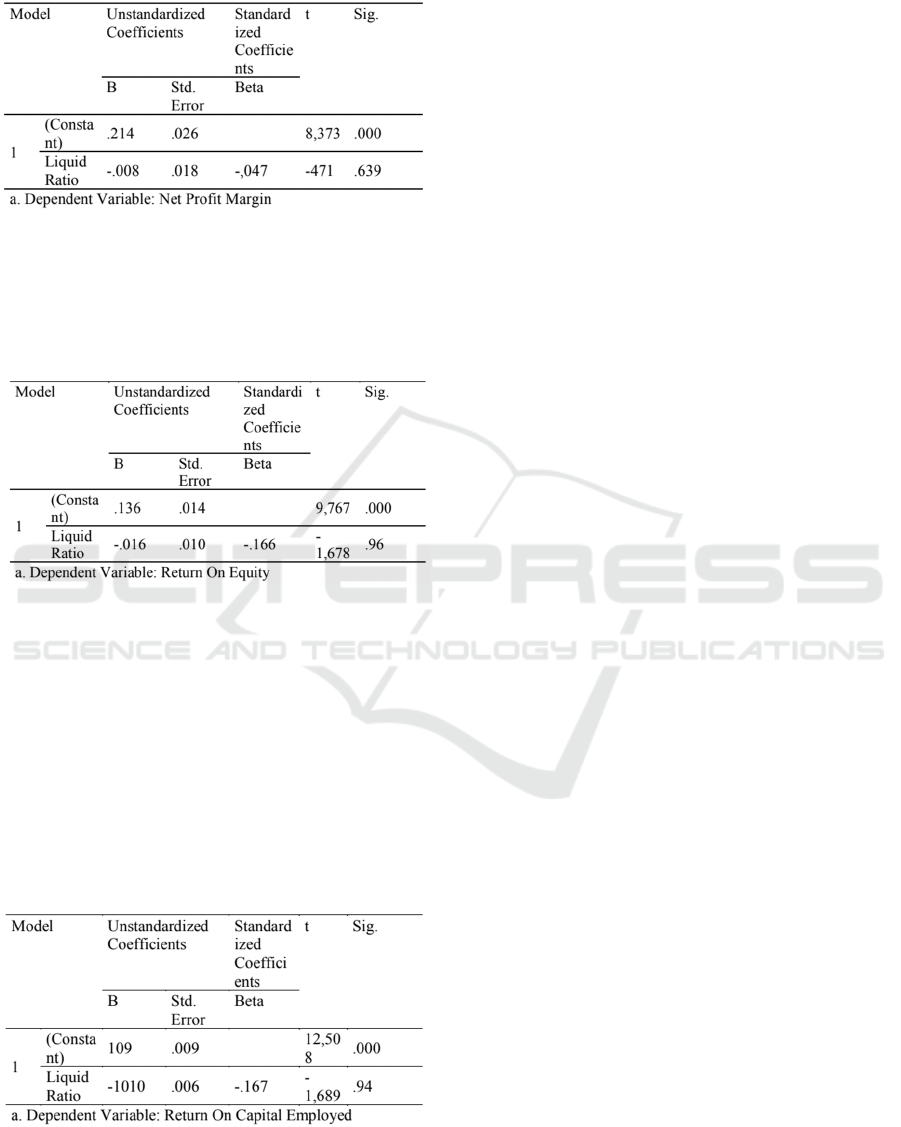
Table 7: Result of the simple linear regression testing
hypothesis 7.
The results of testing the hypothesis of the effect
of Liquid Ratio on Return on Equity can be seen in
table 8.
Table 8: Result of the simple linear regression testing
hypothesis 8.
Based on the results of the above test it can be seen
that the significance level of 0.096 is greater than
0.05, then the hypothesis 8 Liquid Ratio significantly
influences Return on Equity can be concluded that
hypothesis 8 is not supported. This means that return
on equity is not influenced by liquid ratio as an
indicator of liquidity.
The results of testing the hypothesis of the effect
of Liquid Ratio on Return on Capital Employed can
be seen in table 9.
Table 9: Result of the simple linear regression testing
hypothesis 9.
Based on the results of the above test it can be seen
that the significance level of 0.094 is greater than
0.05, then Dehypnotises 9 Liquid Ratio significantly
influences Return on Capital Employed it can be
concluded that Hypothesis 9 is not supported. This
means that return on employed capital is not affected
by liquid ratio as an indicator of liquidity.
According to Duijm (2016) assets liquid
contained in the balance sheet of financial statements
covering all cash, securities, cash reserves in the
central bank to capital. Good management and
policies will lead to the calculation and measurement
of the ability to get profitability of the company. In
the three hypothesis tests that have been carried out
in this study, finding that the liquid value of the
company does not affect the profitability aspects of
companies listed in the infrastructure, utilities, and
transportation sectors, namely net profit margin,
return on equity, and return on employed capital. The
results of the three hypothesis tests state that there is
a negative influence, which means that if there is an
increase in the liquidity liquid ratio indicator, it will
decrease the profitability indicator of net profit
margin, return on equity and return on capital
employed.
5 CONCLUSIONS
Based on the research that has been done, it can be
concluded:
Current Ratio effect on Return on Equity can be
interpreted that any change by the Current Ratio
liquidity indicator will cause Return on Equity to
increase or decrease. However, Current Ratio does
not significantly influence Net Profit Margin and
Return on Capital Employed. It can be concluded that
the value of Net Profit Margin and Return on Capital
Employed tends to be stable even though the Current
Ratio liquidity indicator changes.
Quick Ratio does not affect Net Profit Margin and
Return on Equity, meaning that any changes to Quick
Ratio do not have an impact on Net Profit Margin and
Return on Equity. However, Quick Ratio affects the
Return on Capital Employed meaning that any
changes to the Quick Ratio will cause the Return on
Capital Employed to decrease or increase.
Liquid Ratio does not affect the three indicators of
profitability, i.e. Net Profit Margin, Return on Equity,
and Return on Capital Employed. then any changes
that occur in Liquid Ratio will not affect all three
profitability indicators.
Every company whether listed on the IDX or not
must manage the company's liquidity as well as
possible. With high liquidity, the company will be
able to pay short obligations. High liquidity value also
ICAESS 2020 - The International Conference on Applied Economics and Social Science
152

has a high risk, so management must balance the
opportunity and risk. An increase in current assets and
current liabilities is one way to deal with low liquidity
values, while minimizing current assets and current
liabilities is one way to deal with if the liquidity value
is too high.
Furthermore, profitability is the main goal of
every company. High profit illustrates the high
productivity of financial performance. High
profitability is also not uncommon to attract investors
to want to invest. Wise financial management will
produce the right decisions for the future. Therefore,
companies should also pay attention to the level of
value of each profitability ratio indicator including
Net Profit Margin, Return on Equity, and Return on
Capital Employed.
REFERENCES
Ajanthan, A. (2013). A nexus between Liquidity and
Profitability; A Study of Trading Companies in Sri
Lanka. European Journal of Business and Management,
5 (7).
Akter, A., & Mahmud, K. (2014). Liquidity and
Profitability Relationship in Bangladesh Banking
Industries. International Journal of Empirical Finance,
143-151.
Bolek, M., & Wilinski, W. (2012). The Influence of
Liquidity on Profitability of Polish Construction Sector
Companies. Financial Internet Quartely e-Finance.
Brigham & Houson. (2014). Financial Management (8th).
Jakarta: Salemba Empat.
Ghozali, I. (2013). Application of Multivariate Analysis
with SPSS Program. Semarang: Diponegoro University
Publisher Agency.
Hamid, MK, & Akhi, RA (2016). Liquidity and
Profitability Trade-off in the Pharmaceuticals and
Chemicals Sector of Bangladesh. International Journal
of Science and Research, 420-423.
Hanafi, & Halim. (2012). Financial Statement Analysis.
Yogyakarta: UPPAMP YKPN.
Ibe, SO (2013). The Impact of Liquidity Management on the
Profitability of banks in Nigeria. Journal of Finance
and Bank Management, 37-48.
Konadu, JS (2009). Liquidity and Profitability: Empirical
Evidence from listed Banks in Ghana. Kwane Nkrumah
University of Science and Technology.
Kieso, DE, & Weygandt, JJ (2008). Intermediate
Accounting Edition VII Volume III. Jakarta: Binarupa
Aksara
Niresh, JA (2012). Trade Off between Liquidity and
Profitability a Study of Selected Manufacturing Firms
in Sri Lanka. Researchers World Journal of Arts,
Science and Commerce, 2-4.
Olerewaju, OM, & Adeyemi, OK (2015). Causal
Relationship Between Liquidity and Profitability of
Nigerian Deposit Money Banks. International Journal
on Academic Research in Accounting Finance and
Management Sciences, 165-171.
Saleem, Q., & Rehman, RU (2011). Impacts of Liquidity
ratios on Profitability Case of Oil and Gas Companies
of Pakistan. Interdisclipinary Journal of Research in
Business, 95-98.
Saluju, P., & Kumar, P. (2012). Liquidity and Profitability
Trade Off (A Study on Airtel Bharti Limited).
International Journal of Advanced Research in
Management and Social Sciences, 77-84.
Siame, C. (2012). The Relationship between
Profitability and Liquidity in South African Listed
Firms. University of Cape Town.
Suryaningsih, W. (2018). Analysis of the Effect of Liquidity
and Solvency on Profitability on Construction and
Building Companies listed on the IDX. Management
Skirpsi, Muhammadiyah University.
Vieria, RS (2010).
The Relationship Between Liquidity
and Profitability an Exploratory Study of Airline
Companies Between 2005 and 2008. Unpublished
Master Thesis of UMEA University.
Zygmunt, J. (2013). Does Liquidity impact on
Profitability. In Proceedings of the Conference of
Informatics and Management Sciences, 247-251.
Effect of Liquidity on Profitability
153
