
Automatic Plant Health Monitoring Device based on NDVI Analysis
using Raspberry Pi for Water Apple Plant
Rizky Pratama Hudhajanto
1
, Nanta Fakih Prebianto
1
, Muchammad Fajri Amirul Nasrullah
2
and Jesy
Neland
1
1
Electrical Engineering, Politeknik Negeri Batam, Batam, Indonesia
2
Infomatics Engineering, Politeknik Negeri Batam, Batam, Indonesia
Keywords: NDVI, Raspberry Pi, Agriculture, Water Apple Plant
Abstract: Indonesia is a tropical country with abundant agricultural products. Therefore, the increase of efficiency and
productivity of these crops is needed. Normalized Difference Vegetation Index is an index used to monitor
plant health. To find out the NDVI value, a special camera is used to capture Near Infrared (NIR) light
spectrum. This special camera is usually used by the professional plantation industry and is very expensive.
In this study, we used a raspberry pi and a low cost Pi Noir camera to create a system that can predict the
NDVI value of plants. The plant used as testing object is a Water Apple Plant (Syzygium aqueum). The result
was that the system was able to identify the health of plant based on their NDVI value.
1 INTRODUCTION
As a nation that has a tropical nature, Indonesia is
provided with tremendous natural resources. One of
the natural resources that can be utilized as an energy
source is agricultural farm. This comprises of
plantations of rubbers, coconuts, oil palm, and so on.
This plantation spread in excess of 20 million
hectares of land area. From this number of land area
dedicated for agriculture, it means should be
considered to increase the efficiency and productivity
of the plantations.
Precision farming is a method to increase the
efficiency and productivity of farms or plantations.
Precision farming uses technology to identify plant
and manage its variability. As the results, the farmers
can determine the use of fertilizers, seeds, waters, or
pesticides efficiently. Many precision farming
technologies use the camera to identify the health of
the plant. The camera used is a special multispectral
camera. This multispectral camera can capture non
visible light spectrum. This non visible spectrum
sometime has information about plant’s condition and
health. If one can understand plant health precisely,
the use of fertilizers, waters, or pesticides can be more
efficient. This also will increase the productivity with
less capital cost.
There are many vegetation indices used in
precision farming. The most popular vegetation index
is Normalized Difference Vegetation Index (NDVI).
This NDVI can be used to determine the health of
plant. The high number of NDVI will indicate the
healthier the plant is. NDVI uses information from
light that is reflected by the plant leaves. This light
information is captured by special camera. The
special camera is a normal camera modified to
capture special light spectrum. Most of the light
spectrum captured is a non-visible light spectrum. So
NDVI uses the image processing technology to
calculate the index. This index indicates the
chlorophyll concentration of leaves, which means it
may also indicate the health of plants (Yang et al.,
2017).
Normal green leaves in a plant absorbs red light
and reflect near infra-red (NIR) light. This Red light
has 600 nm to 700 nm of wavelength, and NIR light
has 700 nm to 110 nm. Its absorption is the part of
photosynthesis process. This absorption process is
happened due to the presence of chlorophyll.
The reflected near-infrared light can indicate the
health of some type of plant. Equation (1) is the
equation to compute NDVI using near-infrared and
red captured by camera.
𝑁𝐷𝑉𝐼
𝑁𝐼𝑅 𝑅
𝑁𝐼𝑅
𝑅
(1)
Hudhajanto, R., Prebianto, N., Nasrullah, M. and Neland, J.
Automatic Plant Health Monitoring Device based on NDVI Analysis using Raspberry Pi for Water Apple Plant.
DOI: 10.5220/0010352701150118
In Proceedings of the 3rd International Conference on Applied Engineering (ICAE 2020), pages 115-118
ISBN: 978-989-758-520-3
Copyright
c
2021 by SCITEPRESS – Science and Technology Publications, Lda. All rights reserved
115
NIR is the average of color signal in the
wavelength of 800 to 1000 nm. R is the average of
color signal in the wavelength of 560 nm to 670 nm
range. The value of NDVI is in the range of +1 and -
1. NDVI value close to zero indicates that the health
of the plant is not god, while NDVI value +1 means
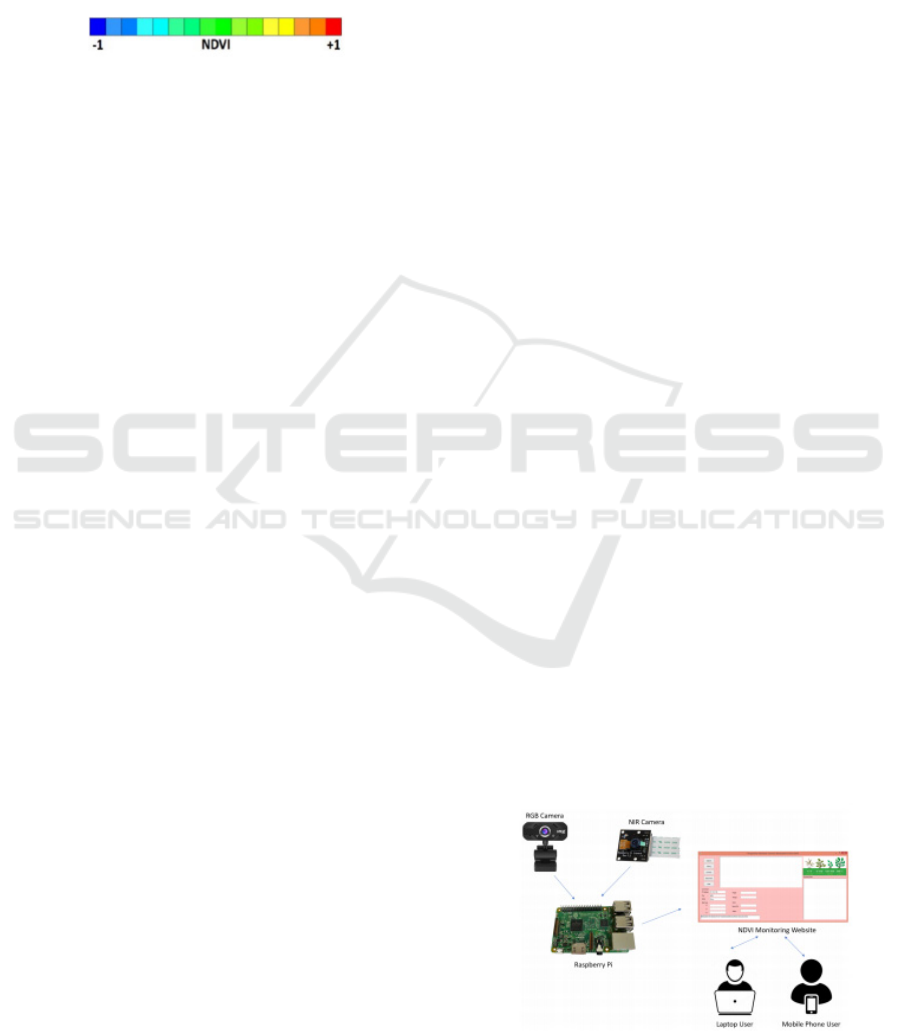
the plant is in good health condition. Figure 1 shows
the NDVI color range and its value.
Figure 1: NDVI color range.
Nowadays, the standard normal camera usually is
equipped with NIR blocking filter. The reason is that
the NIR light can make the photos taken from that
camera become unnatural. There are many ways to
make the camera can capture NIR light. The first
method modifies the lens of camera to unblock the
NIR light (Beisel et al., 2018; Rabatel et al., 2011;
Variyar et al., 2015). This method is sometime very
difficult. In some cameras, the lens is so small and
brittle. Modify the lens can make the camera broken
and unusable. The second method is to use a
specialized camera (Ritz et al., 2020; Vidoni et al.,
2017). This camera is made specially for capturing
NIR light. This camera is solution for who do not
want to modify the lens. However, the price of this
camera is so high. This camera is also rarely found on
many countries’ local market.
Distinct studies demonstrated that NDVI can be
measured by using only single camera (Rabetel et al.,
2011). The camera used by Rabatel et al. (2011) is a
Single Lens Reflect (SLR) Camera which is modified
by removing its Near Infrared Blocking Filter. This
modification is not easy. One must understand the
camera body parts and lenses. One mistake can make
the camera unusable. Another research from Glenn et
al. (2018), showed the measurement of NDVI by
using single Pi Noir Camera. This camera is a special
camera built for raspberry pi. This camera does not
employ an Infrared Filter, so that the resulting image
contains infrared information that is reflected by
objects. In spite of that, this camera stiil need a blue
filter. The Glenn NDVI measurement is calculated by
using NIR value and blue value. This means, Glenn
et al. measured blue NDVI in their research. Many
researches showed that NDVI calculated using blue
spectrum has less good result than using red
spectrum.
The development of the mini PC technology has
encouraged the use of the mini PC as the main
computer in monitoring plants. Wang et al. (2020)
have conducted research on the use of raspberry pi
and pi noir camera to see the NDVI value of corn
plants. At a cost of only 70-85 USD, they managed to
capture NDVI values as well as predict nitrogen
levels precisely. The Pi Noir camera as a camera to
monitor NDVI is also used by Avotins et al. (2020)
and Bicans et al. (2019). Avotins et al. (2020) uses the
Raspberry Pi Model 3 as the main computer to
capture and process the images. The captured data is
then sent using an internet connection to the cloud.
NDVI values, which are numbers, sometimes
cause the reader to have difficulty understanding
them. Therefore, Wijitdechakul et al. (2017) grouped
plant index values such as NDVI, NDWI, and SAVI
into semantic keyword groups. So that it can be
concluded directly by the system whether the plant is
drought, or the soil moisture of the plant is not good.
In this research, we propose NDVI calculation
by using two cameras. The first camera is standard
webcam camera, and the second is Pi NoIR Camera.
We use raspberry pi as a main image processor. From
the first camera, the red pixel information obtained
and from the second camera, The NIR pixel
information is obtained. The tests are carried out on
several conditions of leaf. The results are grouped in
several keywords such as “Healthy”, “Unhealthy”,
and “Dead”. These keywords are then showed to the
user via web applications.
2 METHODOLOGY
In this project, two cameras are used. The first camera
is standard RGB camera and the second one is Pi
NoIR camera. Figure 2 shows the system used in this
project. As an image data processor, Raspberry pi
type B is used. Rapsberry pi captures image from two
cameras. These two cameras have different resolution
and different view angle. Before image being
processed, the two images (stereo image) need to be
matched. After these images matched, the red pixel
information is extracted from first RGB camera.
Then, the NIR pixel information is extracted from
second camera.
Figure 2: Raspberry Pi system.
ICAE 2020 - The International Conference on Applied Engineering
116
The NDVI is calculated using equation (1). Then,
the result, is colormaped by using information shown
in Figure 1. The resulting NDVI image and NDVI
number are shown on the web application. This web
application is served by web server in the Raspberry
Pi. This application can be accessed by user from
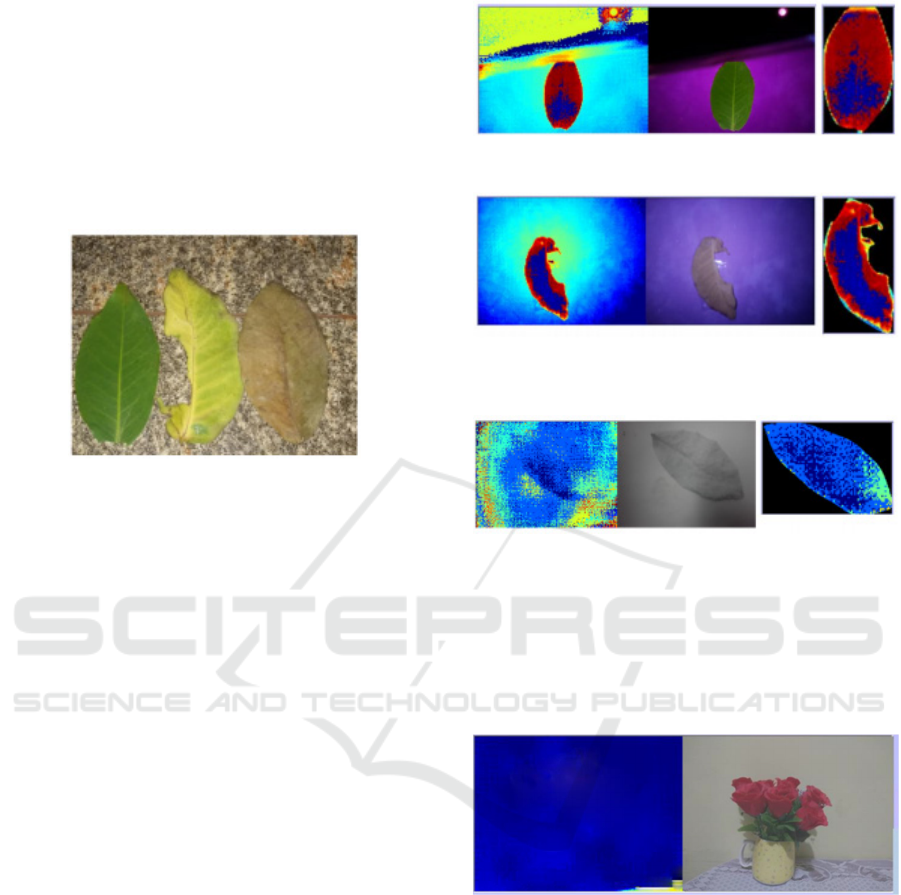
everywhere. For the testing purpose, a leaf is placed
in front of the cameras. We used Water Apple
(Syzygium aqueum) leaves as testing object. The
leaves used for the test are shown in Figure 3.
Figure 3: Water apple leaves as testing object.
3 RESULT AND DISCUSSION
In the first test, the green healthy water apple leaf is
placed in front of the cameras. The resulting image is
shown in figure 4. As we can see in figure 4, the red
pixel dominates the image color. This red color is a
representation of the chlorophyll intensity in the leaf.
From the results of the NDVI calculation, the value
was 0.479, which means that the leaf is in good
health.
In the second experiment, an object of water
apple leaf that is torn and slightly yellow is placed in
front of the camera. The result captured by the system
is shown in figure 5. In contrast to the previous
healthy leaf, this leaf has more dominant blue color.
Only a few red pixels are visible. Many red pixels are
clustered on the outer side of the leaf. From the results
of NDVI calculations, the value is 0.142 which means
the plant is in an unhealthy state.
In the third experiment, the water apple leaf
object which looked dry was used as the test object.
The results of the received image is shown in figure
6. From the observations, it can be seen that almost
all leaf colors show blue. This means that the leaf is
dry, there is no indication of chlorophyll at all. From
the NDVI calculation, the value of -0.9 is obtained,
which means that the leaf is in a dead condition.
Figure 4: NDVI image of healthy green water apple leave.
Figure 5: NDVI image of not healthy green water apple
leave.
Figure 6: NDVI image of death green water apple leave.
In the fourth and final experiment, dummy plant
is used as testing object. The resulting image is shown
in figure 7. It can be seen that the image result shows
an all blue color. No red pixel is detected. This is
because in dummy plants, there is no chlorophyll
intensity. The result is the plant in dead condition.
Figure 7: NDVI image of dummy plant.
4 CONCLUSIONS
Nowadays, there are many NDVI measurement
solutions on the market, they are usually very
expensive and need very skilful personnel to operate.
The proposed system described in this paper presents
an affordable alternative to one who needs to know
the health of the plants from NDVI measurement
perspective. From the experimental results, this
system has succeeded in identifying the health of
water apple leaves and predicting the average NDVI
Automatic Plant Health Monitoring Device based on NDVI Analysis using Raspberry Pi for Water Apple Plant
117

value of the leaf. Furthermore, further research will
be carried out on the effect of NDVI values on crop
yields and water requirements of plants.
REFERENCES
Avotins, A., Kviesis, K., Bicans, J., Alsina, I., Dubova, L.,
2020. Experimental analysis of IoT based camera SI-
NDVI values for tomato plant health monitoring
application. Agronomy Research, 18(2).
Beisel, N. S., Callaham, J. B., Sng, N. J., Taylor, D. J., Paul,
A.-L., Ferl, R. J., 2018. Utilization of single-image
normalized difference vegetation index (SI-NDVI) for
early plant stress detection. Applications in Plant
Sciences, 6(10), e01186.
Bicans, J., Kviesis, K., Avotins, A., 2019. IoT Camera-
based Approach to Capture and Process SI-NDVI
Sensor Data for Industrial Tomato Greenhouse. In 7th
IEEE Workshop on Advances in Information,
Electronic and Electrical Engineering (AIEEE). IEEE.
Glenn, D. M., Tabb, A., 2018. Evaluation of five methods
to measure Normalized Difference Vegetation Index
(NDVI) in apple and citrus. International Journal of
Fruit Science, 19(2), 191–210.
Jinmika, W., Yasushi, K., Shiori, S., Chawan, K., 2017. A
multispectral imaging and semantic computing system
for agricultural monitoring and analysis [JB]. Frontiers
in Artificial Intelligence and Applications, 292
(Information Modelling and Knowledge Bases
XXVIII), 314–333.
Rabatel, G., Gorretta, N., Labbé, S., 2011. Getting NDVI
spectral bands from a single standard RGB digital
camera: a methodological approach. In Advances in
Artificial Intelligence, Springer Berlin Heidelberg, page
333–342.
Ritz, E., Bjerke, J. W., Tømmervik, H., 2020. Monitoring
winter stress vulnerability of high-latitude understory
vegetation using intraspecific trait variability and
remote sensing approaches. Sensors, 20(7), 2102.
Variyar, V. V. S., Haridas, N., Aswathy, C., Soman, K. P.,
2015. Pi Doctor: A low cost aquaponics plant health
monitoring system using infragram technology and
Raspberry Pi. In Proceedings of the International
Conference on Soft Computing Systems. Springer India.
Vidoni, R., Gallo, R., Ristorto, Carabin, G., Mazzetto, F.,
Scalera, L., Gasparetto, A., 2017. ByeLab: an
agricultural mobile robot prototype for proximal
sensing and precision farming. Volume 4A: Dynamics,
Vibration, and Control. In ASME 2017 International
Mechanical Engineering Congress and Exposition.
ASME.
Wang, L., Duan, Y., Zhang, L., Rehman, T. U., Ma, D., Jin,
J., 2020. Precise estimation of NDVI with a simple NIR
sensitive RGB camera and machine learning methods
for corn plants. Sensors, 20(11), 3208.
Yang, H., Yang, X., Heskel, M., Sun, S., Tang, J., 2017.
Seasonal variations of leaf and canopy properties
tracked by ground-based NDVI imagery in a temperate
forest. Scientific Reports, 7(1).
ICAE 2020 - The International Conference on Applied Engineering
118
