
POLIBATAM PANTAU COVID-19: Geospatial WebGIS
Application for Covid-19 Sharing Information in Riau Island
Province
Luthfiya Ratna Sari
1
, Farouki Dinda Rassarandi
1
, Siti Noor Chayati
1
, Sudra Irawan
1
, Selly Artaty
Zega
2
, Supardianto
3
, Adelia Eky Wardani
1
, Moh. Bagus Rahmadi
1
, Rizki Irianto
1
, Arifatul Hidayah
2
,
and Ilmi Nazar Hamdi
3
1
Geomatic Enginering Technology, Politeknik Negeri Batam, Batam, Indonesia
2
Animation, Politeknik Negeri Batam, Batam, Indonesia
3
Informatic Enginering, Politeknik Negeri Batam, Batam, Indonesia
Keywords: Covid-19, Public Information, WebGIS.
Abstract: Accessible geo-information data availability around Covid-19 theme has become a priority since SARS-CoV-
2 pandemic outbreak phase affecting more than 8 million people around the world. In this paper, we present
a platform with multiple types and sources of data to escalate public awareness through information about
overview, prevention, and symptoms of SARS-CoV-2 virus infection, case update, self-evaluating risk, and
awareness. Through interactive, server-side WebGIS functionalities, the developer can provide multiple
information sources with a high definition of accuracy with potential feedback from the user to gather more
information.
1 INTRODUCTION
The capability to integrate geospatial data with non-
spatial data support is promoting the geographic
information system (GIS) rapid development.
Internet-based GIS (WebGIS) technology (Yin et al.,
2019) establish to support web application structure
with GIS. Concomitant with web technology
development (WebGIS) technology growth in
research major and various application is evolving.
Along with the widening spread of interest,
application in infectious disease through the Covid-
19 pandemic era became a concerning research topic.
Since last December 2019 (Chen, et al., 2020),
SARS-CoV-2 virus infection around the world
caused more than eight hundred thousands of deaths,
and twenty million cases confirmed to be positive.
With invasive disease spreads primarily from person
to person through small droplets from a person with
Covid-19 to others (Lai, Shing, Ko, &Hsueh, 2020),
public awareness and concerns play a massive role in
infection prevention (Pourghasemi, 2020). We
developed WebGIS Covid-19 information for a
specific area in Riau Islands Province, namely
Polibatam Pantau Covid-19.
Different from other already published Covid-19
related WebGIS that cover displaying Covid-19 case
around the globe in a science perspective (John
Hopkins University, 2020), Covid-19 recorded case
in Indonesia in government perspective (Indonesian
Task Force for Covid-10, 2020), and focused Riau
Island Province confirmed Covid-19 data and
information with classic GIS display (Riau Island
Province Task Force for Covid-19, 2020). This canal
provides multiple types and source data information
that can be easily accessed and perceptibly for the
public with an informative and interactive manner to
achieve goals as public knowledge enhancer around
Corona Virus Disease 2019.
With an open-source CSS layout template,
Polibatam Pantau Covid-19 WebGIS segmented into
four tabs, such as Home, About Covid-19, Covid-19
on Maps using ArcGIS Online, and video discussing
the health sector, especially Covid-19 Global
Pandemic. Each tab consists of different levels in
representation and data from various trusted sources.
This paper will discuss how to develop a one-stop
update for public information awareness around
Covid-19 Pandemic, specifically in Riau Island
Province.
64
Sari, L., Rassarandi, F., Chayati, S., Irawan, S., Zega, S., Supardianto, ., Wardani, A., Rahmadi, M., Irianto, R., Hidayah, A. and Hamdi, I.
POLIBATAM PANTAU COVID-19: Geospatial WebGIS Application for Covid-19 Sharing Information in Riau Island Province.
DOI: 10.5220/0010351700640069
In Proceedings of the 3rd International Conference on Applied Engineering (ICAE 2020), pages 64-69
ISBN: 978-989-758-520-3
Copyright
c
2021 by SCITEPRESS – Science and Technology Publications, Lda. All rights reserved
2 CONSTRUCTION AND
FRAMEWORK DESIGN
The system design to provide a single stop with all in
information around Covid-19 and specific daily case
update in Riau Islands Province to inform the user and
achieve better health knowledge and awareness. The
construction requires a set of data information input,
intranet simulation, and extranet publicity, as well as
the easiness of user access. Integration of multi-type
multi-source data for multi-user is expecting to
intensify a whole set of publication that provided by
many stakeholders around Covid-19 Pandemic and
suppress human-to-human transmission rate.
This framework consists of four independent
layers. The changes in one layer do not affect the
others, which offer stability and ease of maintenance.
With the ‘thick-server’ service, the server can
effectively maintain the quality and consistency of
content, meanwhile collecting data through limited
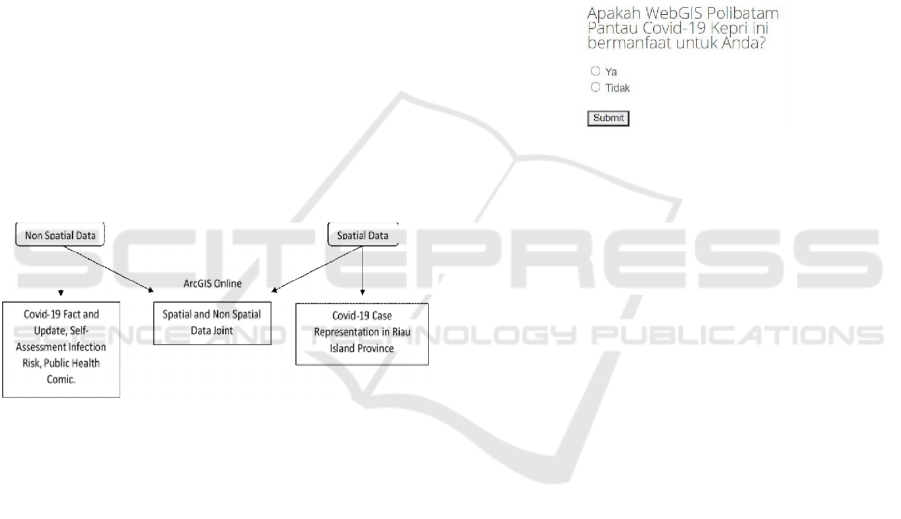
interaction from the user. As shown in Figure 1, this
entire system architecture is designed with three
major frameworks: data layer, middle service layer,
and presentation.
Figure 1: Polibatam pantau Covid-19 architecture.
Gathering raw data play a crucial role in
Polibatam Pantau Covid-19 construction and
development in part of process management
planning. Two major types of data accommodate in
our system: non-spatial Covid-19 data and spatial
data. All gathered data were collected from various
trusted sources and adjusted to adapt to our system.
2.1 Non-spatial Covid-19 Data
Non-spatial data type support in this site covers text,
image, graph, and video from global and regional
trusted source updates. This source covers from
formal institutional data and information released by
WHO (World Health Organization) (2020),
Indonesian Ministry of Health (2020), Indonesian
Task Force for Covid-19 (2020), Local Government
for Covid-19 (Riau Island Province Task Force for
Covid-19, 2020), and casual information such as
validated comic, image, video, graph and article from
HaloDoc website (Halodoc, 2020). Collected data
items include PDP (individual in monitoring) case,
ODP (patient in monitoring) case, OTG (person with
no symptoms) case, positive case, recovered case, and
Covid-19 confirmed death.
A series of questions adapted from the SehatQ
website (SehatQ, 2020) on collaboration with the
Indonesian Ministry of Health to provide self-
assessing risk towards SARS-CoV-2 virus infection
for the public. Quality control to maintain an
excellent WebGIS public perspective mirrored with a
quick question, as shown in Figure 2. Both feedback
collected as a database and used to treasure user
information for better development.
Figure 2: Feedback quality.
All this information segmented into three
segments with different extensions based on
visualization needs, such as .html and .php. Record
and information updated regularly based on source
updated data. Where clients only have access to view
and take a self-assessing risk towards SARS-CoV-2
question. In this way, the server can well maintain
system performance stability and data input-output
quality.
2.2 Spatial Covid-19 Data
Spatial data involved in this WebGIS includes map
layers administration from Riau Island Province.
Spatial data file format in .SHP combined with
attribute numerical Covid-19 case from PDP, ODP,
OTG, positive, recovered, and death by Covid-19
case. This data manipulation steps were completed in
QGIS and imported as a separate layer based on
city/district level administration to ArcGIS Online.
3 FUNCTIONALITIES AND
DEVELOPMENT
Simplification of the building process of Polibatam
Pantau Covid-19, shown in Figure 3. While designing
and scripting done in the intranet server with the help
of CSS (Cascading Style Sheets) with health theme
POLIBATAM PANTAU COVID-19: Geospatial WebGIS Application for Covid-19 Sharing Information in Riau Island Province
65
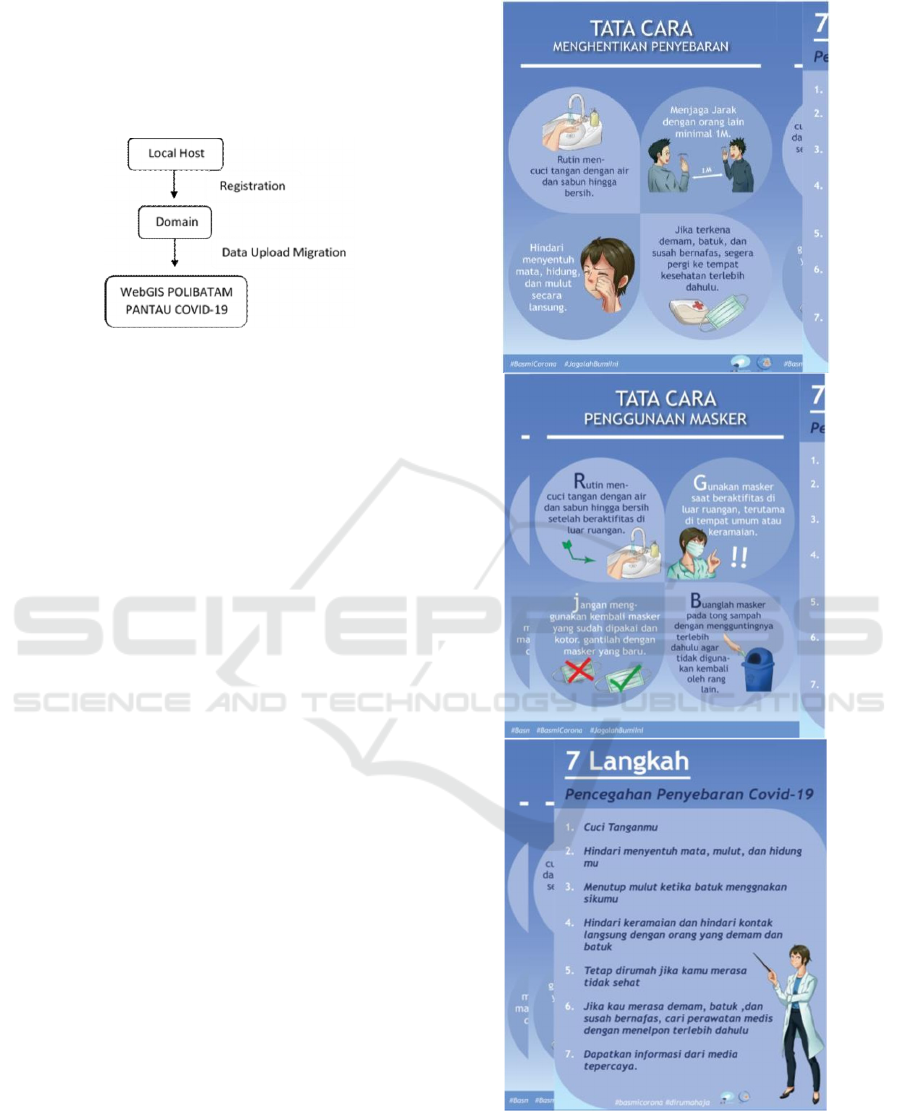
and adjusted. XAMPP for Apache is used to build and
registration of the pre-release website. Data migration
and upload using the Batam State Polytechnic domain
to achieve published
https://pantaucovid19kepri.polibatam.ac.id/index.ht
ml site.
Figure 3: Development step.
3.1 Home
From this section, the user will find basic information
about Covid-19 including article, info-graphic
(Figure 4), Link to the outside website (Indonesian
Task Force for Covid-19, 2020; Riau Island Province
Task Force for Covid-19, 2020; Covidsualizer, 2020;
Polibatam Self Risk Assessment, 2020) (Figure 5),
daily Riau Island Province’s Covid-19 update with
numerical and accumulative graphical display. Comic
(Figure 6) about Indonesia’s government
recommendation to stay at home during Covid- 19
outbreak provided for the user to be downloaded as a
vehicle to reach a various level of user.
3.2 About Covid-19
Further Covid-19 related articles from various source
and contributor presented on this section to inform
user basic knowledge what is Covid-19 and how
dangerous it is. Quality control feedback from user
(Figure 2) embedded in this section. At this tab also
published information about Batam State Polytechnic
personal safety equipment donation for health sector
workers who in need of supply along with fast
response call center for Riau Island’s Covid-19, as
displayed on Figure 7.
Figure 4: Info-graphic created to inform the user how to
minimize the spread.
ICAE 2020 - The International Conference on Applied Engineering
66
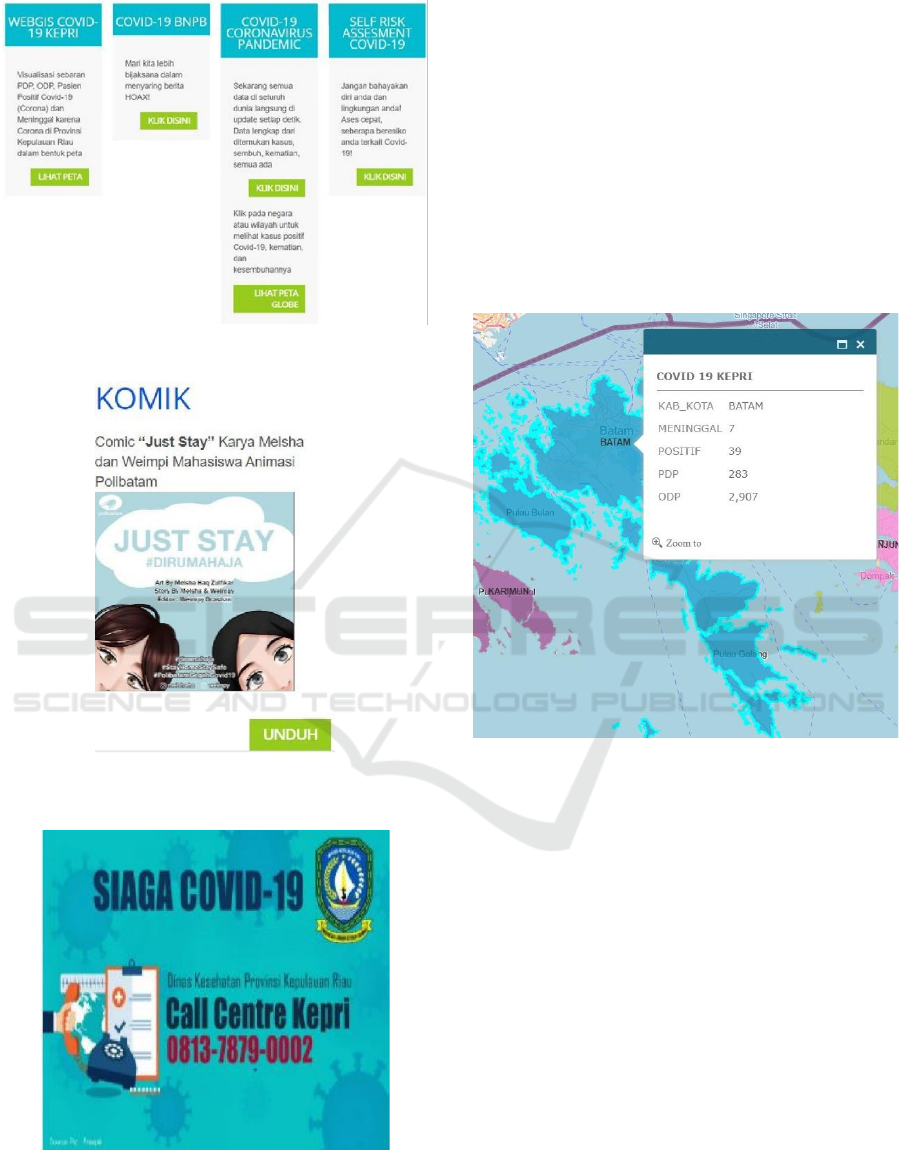
Figure 5: Supportive website link attachment.
Figure 6: Downloadable comic provided with Covid-19
prevention theme.
Figure 7: Fast Response Call Center Attached.
3.3 Covid-19 on Maps
Polibatam Pantau Covid-19 WebGIS provides
various information attributes such as PDP, ODP,
OTG, positive, recovered, and Covid-19 confirmed
death in Riau Island Province’s (Figure 8) updated
daily based on the formal local government press
release. The base map for this representation can be
pick using satellite imagery, imagery hybrid, streets,
topographic, navigation, terrain with labels, map
canvas, national geographic style map, oceans, and
OpenStreetMap (OSM) based on a build-in option
provided by ArcGIS Online.
Figure 8: Map attribute label.
Each city and regencies in Riau Island Province,
such as Batam City, TanjungPinang City, Bintan
Regency, Natuna regency, Anambas Islands
Regencies, Lingga Regencies, and Karimun
Regencies separated in the different map layer. For
each region, the color label using non-gradual type
and not indicating the rate of severity degrees (Figure
9).
Each category value is recorded, linked, and
accumulated to build statistical trend lines to provide
an instant perception of how Covid-19 outbreak
developed every day in this province (Figure 10).
Since the statistical analysis of pandemic recorded
data proven to hold crucial functionality (Qian, Zhang
J. Yang, & C. Yang, 2004), this representation
provided to build a quick overview of how the
situation changes over time. Consist of information
from the entire positive case, active positive case,
until healed positive case to specified user perception.
POLIBATAM PANTAU COVID-19: Geospatial WebGIS Application for Covid-19 Sharing Information in Riau Island Province
67
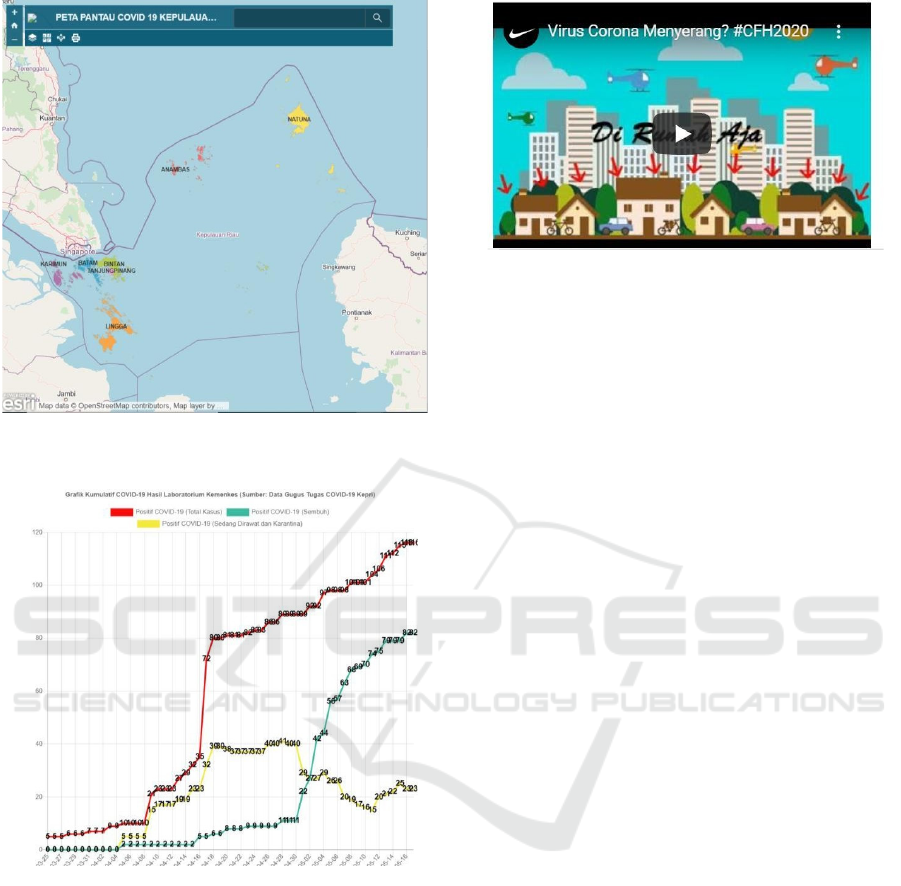
Figure 9: Thematic mapping for Covid-19 in Riau Island
Province.
Figure 10: Trend line statistical analysis.
3.4 Video
Embracing the diverse user backgrounds, especially
in Riau Islands Province, our project provides visual
video information to promote a higher rate of
information delivery from the creator to a client.
Video embedded is from various sources, such as
secondary data like news, trusted popular health
influencer, 3rd party video publisher, and primarily
data produced by our team (Figure 11).
Figure 11: Video produced by our team.
4 CONCLUSIONS
The rise of information technology development
triggers the rapid growth of WebGIS applications in
the heath sector. Information publicity with internet
bases in the pandemic era proves their strength to
deliver data and information for the public since the
ease of access with no specific tools and
requirements. Polibatam Pantau Covid-19 is a typical
application case. Thick-server attitude adapted to
maintain accuracy and stability of information
delivered to the clients, mainly in WebGIS that gather
information from multiple sources and display
various types of data. Polibatam Pantau Covid-19
recorded positive feedback from the user and proven
to handle a high visit rate.
ACKNOWLEDGEMENTS
Batam State Polytechnic supports this project. We
gratefully acknowledge all the assistance in providing
us with development equipment and the environment.
REFERENCES
Chen, N., et al., 2020. Epidemiological and clinical
characteristics of 99 cases of 2019 novel coronavirus
pneumonia in Wuhan, China: a descriptive study.
Lancet, pp. 507-513.
Covidvisualizer, Retrieved July 14
th
, 2020, from
https://www.covidvisualizer.com.
Geospatial Information Agency, Retrieved September 5
th
,
2020, from https://covid19.big.go.id.
Pourghasemi, H. R., et al., 2020. Spatial modeling, risk
mapping, change detection, and outbreak trend analysis
of coronavirus (COVID-19) in Iran (days between
February 19 and June 14, 2020). International Journal
of Infectious Diseases, Volume 98, pp 90-108.
ICAE 2020 - The International Conference on Applied Engineering
68

Halodoc, Retrieved August 11
th
, 2020, from
https://www.halodoc.com/kesehatan/coronavirus.
Indonesian Ministry of Health, Retrieved July 14
th
, 2020,
from https://covid19.kemkes.go.id/category/situasi-
infeksi-emerging/info- corona-virus/#.Xu67cUUzZPY.
Indonesian Task Force for Covid-19, Retrieved July 14
th
,
2020, from https://covid19.go.id/.
Indonesian Task Force for Covid-19, Retrieved September
5
th
, 2020, from https://bnpb-
inacovid19.hub.arcgis.com.
Johns Hopkins University, Retrieved from September 5
th
,
2020, from
https://gisanddata.maps.arcgis.com/apps/opsdashboard
/index.html#/bda7594740fd40299423467b48e9ecf6.
Lai, C. C., Shih, T. P., Ko, W. C., H. J., Hsueh, P. R., 2020.
Severe acute respiratory syndrome coronavirus 2
(SARS-CoV-2) and coronavirus disease-2019
(COVID-19): The epidemic and the challenges.
International Journal of Antimicrobial Agents, Volume
55, Issue 3.
Polibatam Self Risk Assessment, Retrieved August 11
th
,
2020, from http://if.polibatam.ac.id/sra-
covid19/sra_convid19.php.
Qian, Z., Zhang, L., Yang, J., & Yang, C., 2004. Global
SARS information WebGIS design and development,"
IGARSS 2004. In 2004 IEEE International Geoscience
and Remote Sensing Symposium, Anchorage, AK, pp.
2861-2863 vol.5, doi:
10.1109/IGARSS.2004.1370289. IEEE.
Riau Island Province Task Force for Covid-19, Retrieved
July 14
th
, 2020, from
https://corona.kepriprov.go.id/data.
Riau Island Province Task Force for Covid-19,
Retrieved September 5
th
, 2020, from
https://corona.kepriprov.go.id.
SehatQ, Retrieved August 11
th
, 2020, from
https://www.sehatq.com/tag/coronavirus.
WHO, Retrieved July 14
th
, 2020, from
https://www.who.int/emergencies/diseases/novel-
coronavirus- 2019.
Yin, et al., 2019. An Integrated Design For Geospatial
Analysis Based On WebGIS. 2019. In 2019 IEEE 3rd
Advanced Information Management, Communicates,
Electronic and Automation Control Conference
(IMCEC), Chongqing, China, pp. 1890-1894. IEEE.
POLIBATAM PANTAU COVID-19: Geospatial WebGIS Application for Covid-19 Sharing Information in Riau Island Province
69
