
EEG Patterns Analysis of Methadone Patients with Closed Eyes
Condition using Wilcoxon Test
Dwi Esti Kusumandari
1
, M. Faizal Amri
1
, Artha I. S.
1
, Rina Ristiana
1
, Maissy Jahja
2
and Arjon Turnip
3
1
Technical Implementation Unit for Instrumentation Development, Indonesian Institute of Sciences,
Komplek LIPI gedung 30, Bandung, Indonesia
2
Department of Physical Engineering, Telkom University, Bandung, Indonesia
3
Department of Electrical Engineering, Padjadjaran University, Bandung, Indonesia
Keywords: Methadone, EEG, Brain Waves, Wilcoxon Test.
Abstract: This research was conducted to know the effect of methadone on brain waves before and after consuming
methadone with closed eyes and relaxed body conditions. EEG signal recording will use 19 channels, which
are placed using a 10-20 system. The raw data will be filtered using a bandpass filter (0.5 - 70 Hz), removal
of artifacts using the Independent Component Analysis (ICA) method, and feature extraction using the Fast
Fourier Transform method. Then a significant test will be carried out using the Wilcoxon test with a
significance value (accuracy) of 95% or p <0.05. The results were obtained, namely the effect of methadone
on brain waves with an average number of participants that is 14 people on alpha waves. Furthermore, each
wave occurs at a different recording stage.
1 INTRODUCTION
Methadone maintenance therapy is one of the stages
of rehabilitation for opioid drug users, such as
cocaine, heroin, marijuana, and others (Dewi, 2017).
This therapy is done to help addicts reduce the habit
of using needles (Kementerian Kesehatan RI, 2013).
This is because the methadone given is like a syrup,
so it must be consumed by mouth, not by injection.
To determine the effect of methadone, it is still seen
through changes in behaviour alone. This is not
accurate enough, because not all patients follow the
therapy properly and routinely. Several researchers
have researched about EEG recording to determine
the effect of methadone on patients during the
rehabilitation process.
EEG has been use since 1929 (Simbolon, 2019).
EEG is used to record the electrical activity in the
brain with electrodes placed on the scalp (Sanei,
2007). Usually, an EEG is used to look for
abnormalities in the brain, such as epilepsy. However,
now, EEG can be used to see the effects of drug on
the brain.
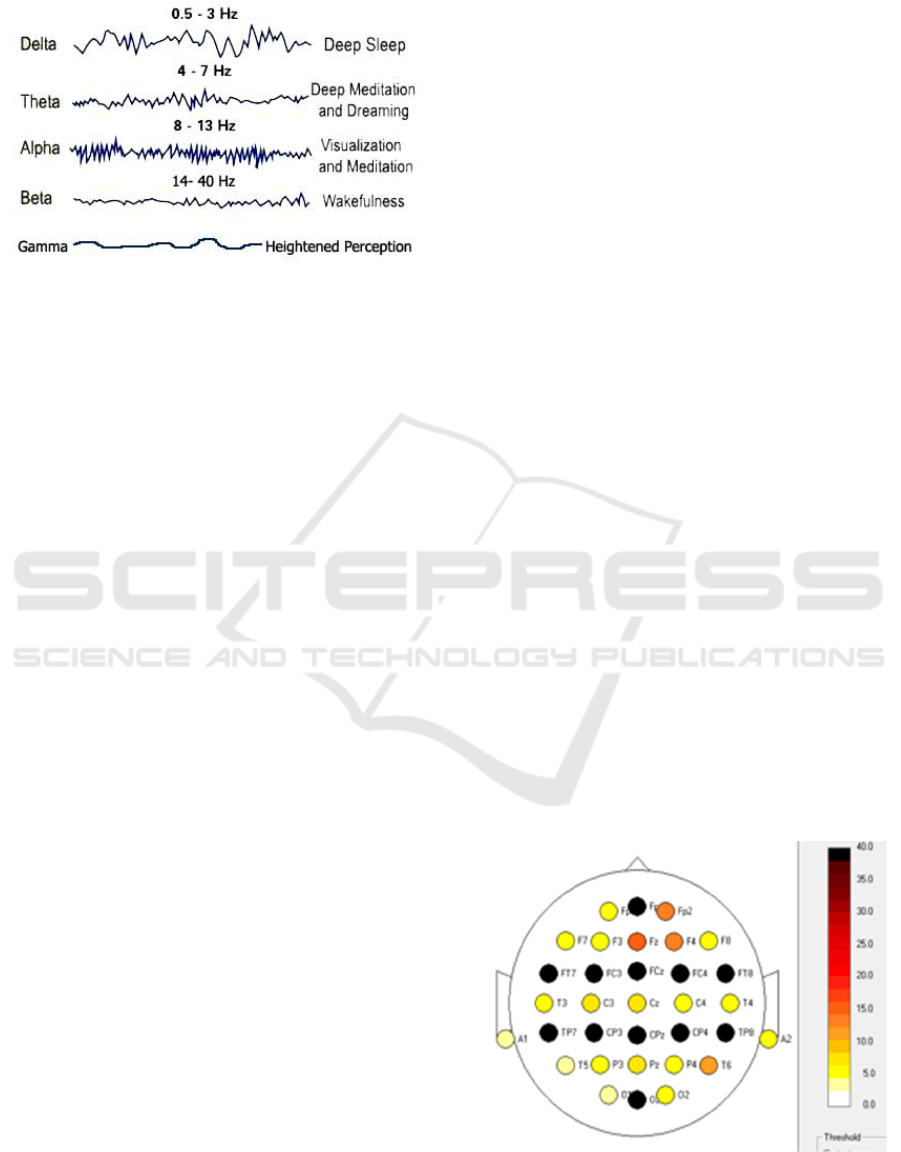
The electrical activity of the brain based on its
frequency is divided into delta, theta, alpha, and
gamma waves. Delta (δ) has a frequency range from
0.5-4 Hz and an amplitude of 20-200 μV. Delta waves
are generated in a state of deep sleep, without dreams
or what is commonly known as deep sleep. Theta (θ)
has a frequency range of 4-8 Hz and an amplitude of
10 μV. Theta waves are generated during light or very
drowsy sleep, trance, hypnosis, meditation. Alpha (α)
has a frequency range from 8-13 Hz and an amplitude
is normally below 50 μV. Alpha waves are generated
in a state of relaxation or begin to rest, going to sleep,
the transition between conscious and unconscious.
Beta (β) has a frequency range from 13-30 Hz and an
amplitude is normally below 30 μV. Beta waves are
generated when you are thinking, focused. Gamma
(γ) has a frequency range from 30-50 Hz. Gamma
waves are generated when a person feels panic,
fearful, and is in a state of full awareness. The brain
wave pattern of normal people can be seen in Figure
1.
To determine the effect of methadone, several
researchers conducted studies on theta, alpha, and
beta waves (Jahja, 2019; Wang, 2014; Kusumandari,
2019; Gunawan, 2012; Uson, 2008). With the results
are that the used of methadone affect those three brain
waves. However, the data processing used was to see
the trend of these three waves in methadone
574
Kusumandari, D., Amri, M., S., A., Ristiana, R., Jahja, M. and Turnip, A.
EEG Patterns Analysis of Methadone Patients with Closed Eyes Condition using Wilcoxon Test.
DOI: 10.5220/0010339000003051
In Proceedings of the International Conference on Culture Her itage, Education, Sustainable Tourism, and Innovation Technologies (CESIT 2020), pages 574-578
ISBN: 978-989-758-501-2
Copyright
c
2022 by SCITEPRESS – Science and Technology Publications, Lda. All rights reserved
maintenance therapy patients with normal people.
Besides that, some focus on the frontal part only
Figure 1: Brain wave pattern of normal people.
(Turnip, 2019; Turnip 2017). Based on this, this study
will focus on 4 waves, namely delta, theta, alpha, and
gamma to see the effect of methadone before and after
consuming methadone. The stage after consuming
methadone will be divided into 3 sessions, namely 10
minutes, 1 hour, and 3 hours after consuming
methadone. From 3 sessions after consuming
methadone, it will be compared with before
consuming methadone. The recording process will be
carried out with closed eyes and relaxed body
condition. It aims to help doctors find out which brain
waves have undergone significant changes to create
the right treatment for other brain waves as well.
2 METHOD
2.1 Participants
Participants used 30 men aged 25-45 years and have
a history of at least high school education. These
participants will be divided into 2 groups, namely 19
participants for methadone rehabilitation patients and
11 participants as control participants. The
methadone rehabilitation patient participants were
TRM of RS Hasan Sadikin, Bandung. The criteria
that a methadone patient participant must have is that
it has been more than 6 months and its regular use,
has been in a stabilized dose, which is above 60 mg,
is a THD patient (take-home doses), does not use
other types of drugs other than benzodiazepines for
the last 1 month, and do not have serious physical
illnesses, epilepsy, and organic mental disorders that
can make communication difficult.
2.2 Experiment
The experiment is carried out in the UNPAD Faculty
of Medicine treatment room, Bandung. Each
participant in a methadone rehabilitation patient will
undergo 2 recording stages, before and after
consuming methadone. During the recording process,
participants will be directed by the operator to be
relaxed, eyes closed, and minimize any unexpected
movements and eye blinks.
Experiments have been completed with ethical
clearance. Before the experiment, each participant
was required to take a urine test and fill out informed
consent. Then the subjects were interviewed by
medical team about the subject related with an abuse
of drug. During the recording, the subject was asked
to relax with closing eyes before, after 10 minutes,
one hour, and after three hours of methadone intake.
This time rule was chosen to identify the change of
brain activity to the given doses of methadone. It is
also predicted that after three hours, the craving has
been stopped as the methadone has effectively
functioning. The experiments were conducted in a
room that has been conditioned from the noise and
comfort with the subject. Then the subject is paired
with a device in the form of an electro-cap on the head
and also a belt tied to the chest of the subject such that
the electro-cap is fit with the subject body. The EEG
signals are recorded through 19 electrode channels,
including Fp1, Fp2, F7, F3, F2, F4, F8, T3, C3, Cz,
C4, T4, T5, P3, P2, P4, T6, O1, O2 (Fig. 1). The Cz
(central part of the brain) is chosen as a reference.
When electrodes are installed on the subject head,
there will be a large impedance between the scalp and
the electrode. Therefore, electrolyte liquid is needed
which serves to minimize those impedance such that
the current (brain activity) flows more easily. The
used electrolyte liquid is electro-gel. Electrode
Figure 2: Position with impedance electrode.
EEG Patterns Analysis of Methadone Patients with Closed Eyes Condition using Wilcoxon Test
575
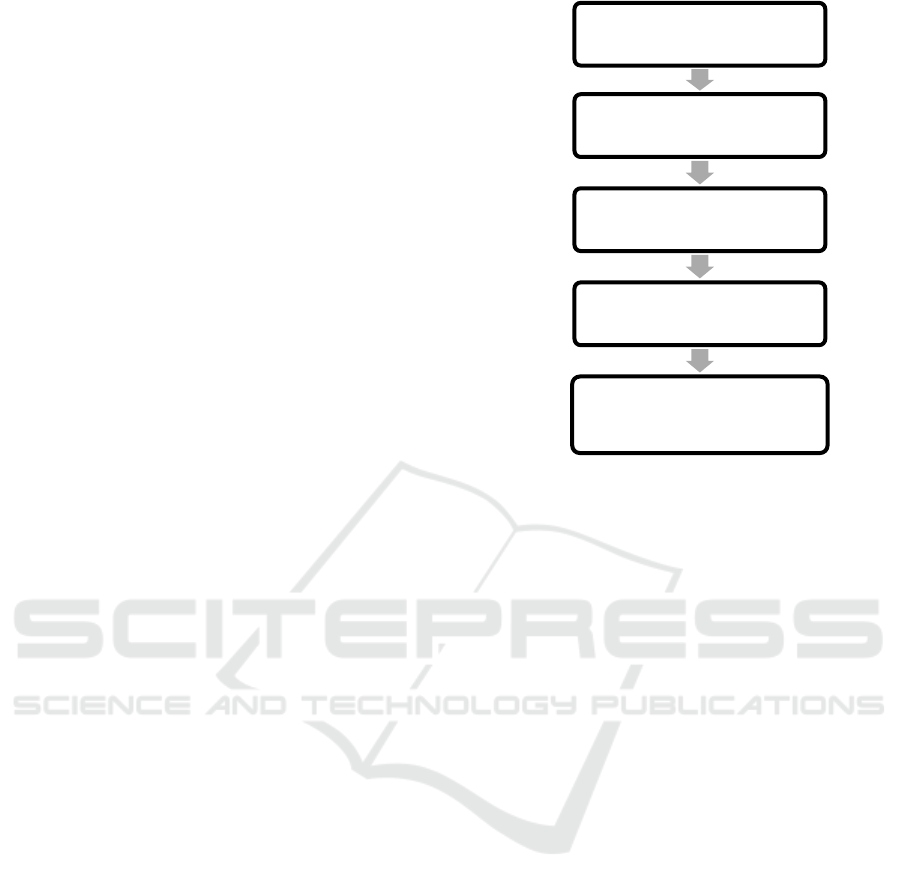
EEG Signal Record
Data Aquititions
Preprocessing
Feature Extraction
OUTPUT (frequency &
amplitude of the brain
activity)
impedance can be monitored in the WinEEG software
before the signal recording process is started. The
appearance of the impedance setting is shown in Fig.
2. The dark colour on the electrode indicator indicates
a large impedance (inactive), while the bright colour
indicates a low impedance. In this experiment, the
impedance is retained under 5 KOhm such that a
high-quality of the EEG data is obtained.
2.3 Pre Processing
The results of the recording of the EEG signal will be
obtained in the form of raw data which will be
followed by a filtering process using a Finite Impulse
Response (FIR) with a bandpass filter (0.5-70 Hz)
impulse response type and artifact removal using the
Independent Component Analysis (ICA) method
(Wang, 2014).
Independent Component Analysis (ICA) can be
used to extract the signal source underlying a series
of mixed signals being measured. In this study, the
ICA method was used to separate the EEG signal
from the overlapping artifacts on the electrodes
attached to the scalp assuming statistically the signal
source is independent.
EEG data is assumed to fit the following equation
model:
𝑥
𝑡
𝐴𝑠
𝑡
𝑣𝑡 (1)
Where, in equation (1) there are three parts,
namely 𝑥,𝑠, and 𝑣, each of which is a vector of the
signal source, the observed signal, and the noise that
occurs at discrete time. 𝑥
𝑡
𝑥
𝑡
,𝑥
𝑡
,.…,𝑥
𝑡
is a linear mixture of
sources. 𝑁 𝑠
𝑡
𝑠
𝑡
,𝑠
𝑡
,.…,𝑠
𝑡
, 𝐴 is a
mixed matrix with size 𝑀𝑥𝑁, and 𝑣𝑡
𝑣1𝑡, 𝑣2𝑡, … , 𝑣𝑀𝑡
is additional noise on the
EEG sensor.
2.4 Feature Extraction
To get the characteristics of each wave, feature
extraction will be carried out using the Fast Fourier
Transform (FFT). Mathematically represented by
equation (2), namely (Turnip, 2019):
𝑠
𝑓
𝑠
𝑡
𝑒
𝑑𝑡
(2)
Whereas 𝑠
𝑓
is the frequency domain signal,
𝑠
𝑡
is the time domain signal, and 𝑒
is a
constant.
The signal processing scheme is given in the
Figure. 3
Figure 3: Signal processing scheme.
2.5 Wilcoxon Signed-rank Test
The Wilcoxon signed-rank test is the nonparametric
test equivalent to the dependent t-test. As the
Wilcoxon signed-rank test does not assume normality
in the data, it can be used when this assumption has
been violated and the use of the dependent t-test is
inappropriate. It is used to compare two sets of scores
that come from the same participants. This can occur
when we wish to investigate any change in scores
from one time point to another, or when individuals
are subjected to more than one condition.
The Wilcoxon signed-rank test represented by
equation (3):
𝑊
∑
𝑠𝑔𝑛𝑥
,
𝑥
,
. 𝑅
(3)
Whereas 𝑊 is test statistic, 𝑁
is sample size, 𝑠𝑔𝑛
is sign function, 𝑥
,
,𝑥
,
is corresponding ranked
pairs from two distribution, and 𝑅
is rank i.
3 RESULT & ANALYSIS
The results of EEG recording on closed eyes can be
seen in Figure 2. Raw data in Figure 2 will go through
several stages of signal processing, namely from the
filtering process, removal of artifacts, feature
extraction, and up to data processing.
The effect of methadone use can be seen through
changes in the amplitude value before and after
CESIT 2020 - International Conference on Culture Heritage, Education, Sustainable Tourism, and Innovation Technologies
576

Figure 2: Raw data on closed eye.
consuming methadone. One way is to use the
Wilcoxon test. Wilcoxon test is intended for data that
are not normally distributed (Turnip, 2017). To
determine the influence of methadone use, it can be
seen from the Sig.2-tailed value. In this study, using
the assumption of accuracy with a Sig. 2-tailed value
<0.05 (p <0.05) which is equivalent to 95%. The
sig.2-tailed value can be seen from before 10 minutes,
before 1 hour after consuming methadone, and before
3 hours after consuming methadone.
Based on the results of recording with closed eyes,
it can be seen that each wave has a different rate of
change for each channel, as shown in Table 1.
Table 1: Recapitulation of the Wilcoxon test of 19 participants.
Channel
Delta Theta
A
lpha Gamma
Sig.2-
tailed
Number of
p
articipants
Sig.2-
tailed
Number of
p
articipants
Sig.2-
tailed
Number of
p
articipants
Sig.2-
tailed
Number of
p
articipants
F
p
1
- - - - - - 0.019 5
F
p
2
0.011 3 - - - - 0.003 5
F
7
0.033 4 - ---- -
F
3
0.02 4 - - - - 0.022 5
F
z
0.012 5 - ---- -
F
4
0.016 4 - - 0.049 12 0.036 5
F
8
0.009 3 - ---- -
T
3
0.049 5 - - - - 0.002 5
C
3
0.012 4 - - - - 0.046 7
C
z
0.022 4 - - 0.049 15 0.006 5
C
4
0.018 5 - - 0.005 15 0.018 6
T
4
0.018 5 - - - - 0.036 6
T
5
0.025 5 - - - - 0.03 6
P
3
0.013 3 - - - - 0.027 7
P
z
0.028 5 - - 0.012 14 - -
P
4
0.018 5 - - 0.03 14 0.014 6
T
6
0.012 5 - - - - 0.024 4
O
1
0.006 3 - ---- -
O
2
0.016 5 - - 0.027 14 0.014 6
Avera
g
e - 4.24 - - - 14 - 5.57
In Table 1, it can be seen that, in the delta, almost all
channels experienced significant changes with a p-
value <0.05, with the mean change of participants at
4.24 people. This change occurred before taking
methadone to 10 minutes after taking methadone. In
the theta wave, there was no significant change in all
channels and all recording stages. This is because all
of them have a p value> 0.05. In alpha waves, several
channels experience significant changes, namely on
the F4, Cz, C4, Pz, P4, and O2 channels with an
average number of participants who experience
changes, namely 14 people. However, not all of these
channels have undergone significant changes at the
same stage. Channels F4 and Cz occurred before
consuming methadone with 10 minutes after
consuming methadone, while C4, Pz, P4, and O2
occurred before consuming methadone 1 hour after
consuming methadone. This change in alpha waves
occurs, because of the p-value <0.05. In gamma
waves, almost all channels experienced significant
changes and occurred at the same stage, namely
before consuming methadone with 3 hours after
consuming methadone with the average participant
who experienced changes, namely 5.57 people. When
compared with the average number of participants
who experienced changes from before to after
EEG Patterns Analysis of Methadone Patients with Closed Eyes Condition using Wilcoxon Test
577

consuming methadone, the effect of methadone was
mostly felt in alpha waves although not in all
channels.
4 CONCLUSIONS
Based on the average number of participants, it can
be seen that there is an effect of methadone that is
mostly felt by 14 participants on alpha waves.
Besides, each wave occurs at a different recording
stage.
ACKNOWLEDGEMENTS
This research was supported by Technical
Implementation Unit for Instrumentation
Development (Deputy for Scientific Services),
Indonesian Institute of Sciences, Indonesia and
INSINAS 2019 Program from Ministry of Research,
Technology and Higher Education, Indonesia.
REFERENCES
Dewi, Inggriane P.; Fauziah, D., 2017. "Pengaruh Terapi
Seft Terhadap Penurunan Tingkat Kecemasan pada
Para Pengguna NAPZA", Jurnal Keperawatan
Muhammadiyah(2), p. 6.
Kementrian Kesehatan RI, 2013. Peraturan Menteri
Kesehatan Republik Indonesia Nomor 57 Tahun 2013
tentang Pedoman Penyelenggaraan Program Terapi
Rumatan Metadona.
Simbolon, Artha I. et al., 2019. "Alteration in Resting EEG
for Different Dosage of Methadone Treatment", in
International Conference of Computer Science and
Information Technology (ICoSNIKOM), Medan.
Sanei, Saeid and Chambers, Jonathan A., 2007. EEG
SIGNAL PROCESSING. UK: John Wiley and Sons,
Ltd, pp. 10-12.
Jahja, Maiisy, 2019. "Analisis Amplitudo Alpha dan Theta
untuk Melihat Pengaruh Methadone dengan Kondisi
Buka dan Tutup Mata", Laporan Kerja Praktik,
Universitas Telkom, Indonesia,
Wang, Grace Y.; Kydd, Rob; Wouldes, Trecia A.; Jensen,
Maree; and Russell, Bruce R., 2014. "Changes in
Resting EEG Following Methadone Treatment in
Opiate Addicts", Journal of Neurophysiology.
Kusumandari, Dwi Esti; Turnip, Arjon; and Iskandar,
Shelly., 2019. "Artifact Removal with Independent
Component Analysis for 2D Brain Mapping of Drug
User Before and After Taking Methadone",
Internetworking Indonesia Journal, vol. 11.
Gunawan, Dadang; and Juwono, Filbert H., 2012.
Pengolahan Sinyal Digital dengan Pemrograman
Matlab, Graha Ilmu. Yogyakarta. Pertama ed.
Santoso, Singgih., 2008. Panduan Lengkap Menguasai
SPSS 16. PT Elex Media Komputindo. Jakarta.
Uson, J.R. Valdizan; and Gorricho, M. Domingo., 2008.
"QEEG Mapping and Methadone", the European
Journal of Psychiatry, vol. 22, no. 1.
Turnip, Arjon et al., 2019. "The Increase of Brain Activity
in Frontal Lobe after Taking One Hour Methadone
Intake", in ICSEEC, Bandung.
Turnip, Arjon; Kusumandari, Dwi Esti; Simbolon, Artha I.;
Hidayat, Teddy; and Wirakusumah, Firman F., 2017.
"Effects of drug Abuse on Brain Activity in Frontal
Cortex Area", in ICITISEE, Yogyakarta.
CESIT 2020 - International Conference on Culture Heritage, Education, Sustainable Tourism, and Innovation Technologies
578
