
Design of Alcohol Detection and Classification Devices in Traditional
Legen / Tuak Drinks using an IoT-based MQ-3 Sensor
Diana Rahmawati
1
, Koko Joni
1
, Rahmah Syarifah Febriana
1
and Heri Setiawan
2
1
Electrical Engineering Dept, University of Trunojoyo Madura, Bangkalan, Indonesia
2
Electrical Weapon System Dept, Polytechnic of Indonesian Army, Batu, Indonesia
Keywords: ATmega2560; Classification of alcohol; IoT ; MQ-3; Naïve Bayes.
Abstract: Rapid detection and classification of alcohol content in traditional legen / tuak drinks need,because high
alcohol content in drinks is very dangerous for consumption. MQ-3 sensors used to obtain electronic aspects
of chemical reactions then captured by the ATmega2560 microcontroller as data retrieval of objects, which
will then be forwarded
for processing on a Personal Computer. This tool is designed to display and classify
legen/palm wine with 3 conditions (good, good
enough, dangerous). The IoT(Internet of Things) technology
is used with a short
process and display data accurately
on smartphone
. Using the naïve Bayes method, the
accuracy of the tool in the trial results is 90%
successful and it can be said that this tool functions well.
1 INTRODUCTION
Nira or roomie is a sweet liquid obtained from the
stems of plants such as sugar cane, beetroot, sorghum,
maple or bunches of sap from the palm family such
as sugar palm, palm, date, sago, siwalan and so on.
Palm palm juice or commonly called "legen" this
word is actually
the term "legi" in Javanese which
means "sweet". In the process of tapping the roomie
needs to be done with good handling and
afterward,
roomie is a liquid containing certain sugars (sucrose,
glucose, fructose, and carbohydrate) which has an
average acidity level
around 6-7 and has a fragrant
aroma. If the roomie is stored in a period of time
there will be natural fermentation by the presence
of
microorganisms contained in the roomie, thus
producing an acidic taste due to the formation of
acetic sour which is a good medium for
the growth of
microorganisms such as bacteria. In a vulnerable
short storage time the drink when consumed will
have a negative
impact due to the longer storage can
lead to the activity of enzymes that are in the roomie
develops and makes the alcohol content in these
drinks increase. Sunanto says that in Indonesia palm
trees can grow well and be able to produce in areas
with fertile soil at an altitude of 500m-800m above
sea level. In areas that have a height of less than
500m or more than 800m, sugar palm plants can still
grow but the fruit production is less than the
maximum. Tuak is a typical drink that is tapped from
palm trees and then stored for 6 hours to 7 hours so
it undergoes a fermentation process and turns into a
drink that has an alcohol content of 4% -5%. Sweet
Tuak is a drink that contains alcohol and is a type of
traditional drink made from palm rommie (Bhuta,
Desai, & Keni, 2015)(Alkohol & Fermentasi,
n.d.)(Ikegami, 1997)(I. G. Ayu, Dhyanaputri, & Jirna,
2017). Palm trees are also referred to as tuak trees,
producing palm water (sap) that drips from the flower
arrangements. People limit the notion of fermentation
only to alcoholization and lactation (Fatmawati,
2016)(Rizal, Erna, Nurainy, & Tambunan, 2016).
Fermentation is an anaerobic overhaul of
carbohydrates that
results in the formation of stable
fermented products(Rizal et al., 2016) (Ilmu &
Dalam, 2019)(Pamungkas & Kompiang,
2006)(Moede & Gonggo, 2017)(I. Ayu, Pranayanti,
& Sutrisno, 2015) .
The Regulation from the Indonesia’s Minister of
Health No.86 / 1977 say that alcoholic drinks are
divided into 3 groups, namely A with 1-5% alcohol
content, class B with 5-20% alcohol content and C
group with 20-55% alcohol content.(Artikel,
2018)(Pangan & Pelita, 2017) To
find out the alcohol
content in drinks, labolatorium testing requires and
take a long time(Alkohol & Fermentasi, n.d.). In this
case the traditional
drink of sap or "legen" is a drink
that does not contain alcohol, prior to the storage
process, it is uncertain the percentage increase in
alcohol content in this drink.(I. G. Ayu et al., 2017)
278
Rahmawati, D., Joni, K., Febriana, R. and Setiawan, H.
Design of Alcohol Detection and Classification Devices in Traditional Legen / Tuak Drinks using an IoT-based MQ-3 Sensor.
DOI: 10.5220/0010331302780284
In Proceedings of the International Conference on Health Informatics, Medical, Biological Engineering, and Pharmaceutical (HIMBEP 2020), pages 278-284
ISBN: 978-989-758-500-5
Copyright
c
2021 by SCITEPRESS – Science and Technology Publications, Lda. All rights reserved

Not a few ordinary Muslim people who are mistaken
in knowing the amount of alcohol taken from the
fermentation of roomie. From the LPPOM MUI
2008 notes, beverage products from the fermentation
process that contain alcohol
(naturally present) are
allowed to be consumed if the amount is very small at
less than 1%(I. G. Ayu et al., 2017)(Alkohol &
Fermentasi, n.d.).
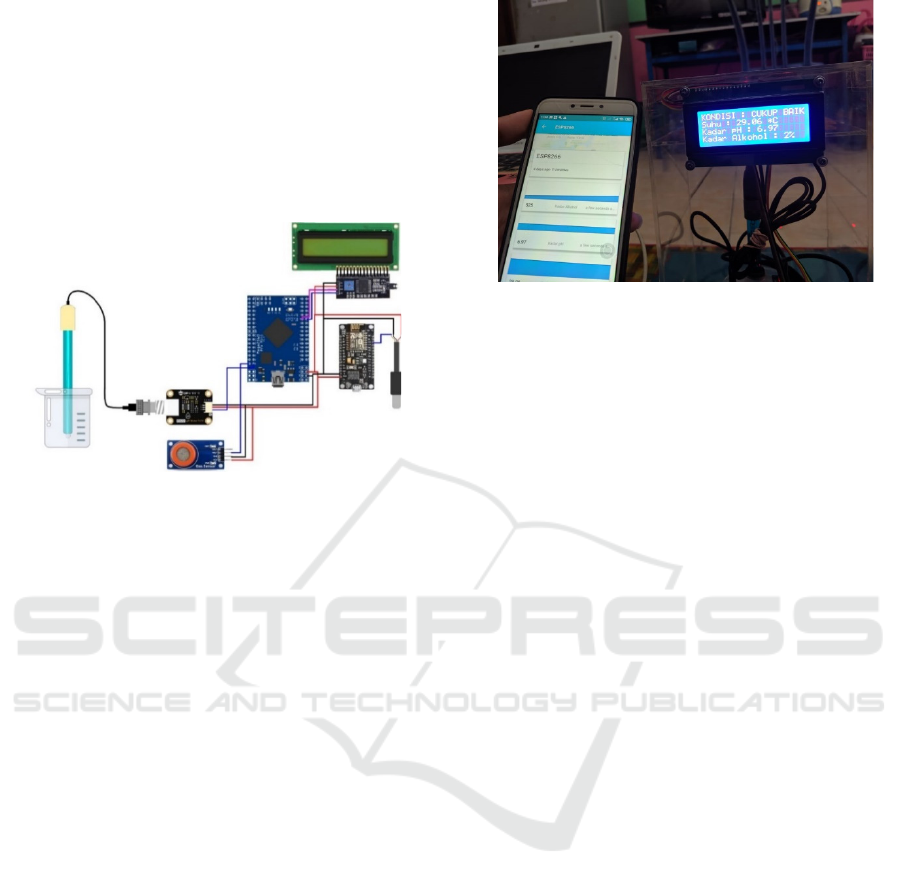
Figure 1: system design
2 METHOD
2.1 System Design
In order to detect and classify of alcohol content we
use Arduino as microcontroller. For the classification
process use 3 (three) conditions, namely "good",
"good enough", "dangerous". ATmega2560
microcontroller get the power supply from the
battery/power and used as supply. The MQ-3 Sensor,
used to detect ethanol (alcohol) content in the form of
Analog To Digital Converter (ADC) signals(Alkohol
& Fermentasi, n.d.). PH Probe electrode and pH
modules are used to detect and relating tools from
sensor to the micro. DS18B20 serves as a limitation
of the temperature parameters that the sample testing
can perform. NodeMCU used to be a transmitter or
data sender from the Arduino to the server and as the
media viewer that read the ADC voltage output of the
MQ-3 sensors which will be displayed on the LCD as
a percentage of content, temperature magnitudes, pH
content, sample conditions and forecasting samples in
real time.
2.2 Testing
By using the Naïve Bayes method, the learning
methods that use probability calculations, we test this
system. The algorithm utilizes simple probability and
statistical calculations, thinking that inter-class
classes with other classes can stand alone on the other
classes. Naïve Bayes is a method that has no rules,
using a branch of mathematics known for probability
theory to find the greatest opportunity of the
classification possible by looking at the frequency of
each classification on the training data. Naïve Bayes
is a popular classification method and is included in
the top ten algorithms in data mining, the algorithm is
also known as Idiot's Bayes, Simple Bayes an
Independence Bayes (Lubis & Pinem, 2014)(Profile,
2018)(Raschka, 2014) of Bayes ' classification based
on Bayes ' theorem, taken from the name of a
mathematician who was also the British minister of
Prebysterian, Thomas Bayes (1702-1761) (Profile,
2018)Here's the equation of the Naïve Bayes
theorem:
P ( X | Y ) = …………………………… .. (1)
Information:
Y: data with unknown classes
X: hypothesis data y is a specific class
P (x|y): hypothesis probability x based on condition y
(posteriori probability)
P (x): hypothesis probability x (prior probability)
P (y|x): probability y based on the conditions in
hypothesis
x p (y): probability to y
The largest probability value belongs to the
appropriate class. As a classify data, it only requires
all the possibilities that occur. Naïve Bayes is an
algorithm that is included in supervised learning so
the initial learning process is needed to make
decisions. The classification process with Naïve
Bayes is done using the training data that was
previously divided using K-fold cross validation. In
order to conduct the learning or testing the character
data will be taken one by one from the previously
existing features. At this stage of classification there
are two processes: Learning level using existing data,
the second is estimate the parameters of the
distribution of the opportunity with the assumption
that the independence of each class (data with the
same characteristics). In this stage is estimated in the
parameters with Maximum Likelihood (ML), and the
predictive stage is the process of using the model that
has been built to conduct data tests to
estimate/measure the accuracy of the rules formed in
the model by calculating the opportunity posterior
Design of Alcohol Detection and Classification Devices in Traditional Legen / Tuak Drinks using an IoT-based MQ-3 Sensor
279
then classify into the largest opportunity posterior
MAPH (Maximum A Posteriori Hypothesis)
(Manalu, Sianturi, & Manalu, 2017).
3 IMPLEMENTATION
3.1 System Implementation
Figure 2. system implementation
Figure 2 shows the schematic wiring circuit from
sensors and the output to micro with the following
details:
a. Sensor Ph: V +, G (GND), Po (A1)
b. MQ alcohol Sensors-3: VCC (5v), GND,
Ao
c. Temperature Sensor DHT11: Black
(GND), Red (5v), yellow (D2)
d. LCD: VCC (5v), GND, SDA, SCL
e. Node MCU ESP 8266: Vin (5v), GND,
D6 (serial communication)
3.2 Hardware Implementation
Hardware implementation, in this study used 3
sensors, MQ-3 sensors for alcohol content detection,
DS18B20 temperature sensors, pH Module E201-
CBNC for pH levels detection. The Micro
ATmega2560, NodeMCU ESP-8266 as the data
sender to the server. At the end of the results testing
process will be displayed on the LCD (Lyquid crystal
Display) and for realtime data can be observed using
IoT devices connected to the device.
Figure 3. hardware
3.3 IoT (Internet of Things)
As described in the previous section, IoT is used as a
data viewer for processing results from detection and
classification on the smartphones. IoT (Internet of
Things) is the latest communication device, where
electronic devices can be integrated with each other
with microcontroller, wave transmitter for
communication, and good protocol stacks (Ikegami,
1997).
In making the IoT system (Internet of Things)
requires device conection (device connection) and
data Sensing (data sensing). IoT can be said as a
package of things that are interconnected over the
internet consisting of sensors, tags, and others. IoT is
used to collect information and data that can then be
processed. IoT can be applied in the field, such as in
health, agriculture, smart building, transportation,
Smart grid, Automation and others (Winasis,
Nugraha, Rosyadi, & Nugroho, 2016)(Rahmawati,
2019) (Rao, Ajit, & Kumar, 2018)(Bhagwat, Hulloli,
Patil, Khan, & Kamble, 2018).
For the IoT platform in this study using ubidots as
a data receiver server and displaying the results of all
sensors (Hidayatullah, Fat, & Andriani, 2018).
Testing with a serial monitor, Testing a web server
and Testing on Android is well connected.
3.4 Research Results
3.4.1 Using Naïve Bayes Method
Testing by method, Navie Bayes method is a simple
testing process, which less formulation but very
precision. At the test this time begins with
temperature detection, then pH testing and alcohol
testing. Once the ADC voltage reads will be
processed for conversion, the next displays the
percentage or content of each readable on the sensor.
This method begins with collecting the training data.
HIMBEP 2020 - International Conference on Health Informatics, Medical, Biological Engineering, and Pharmaceutical
280
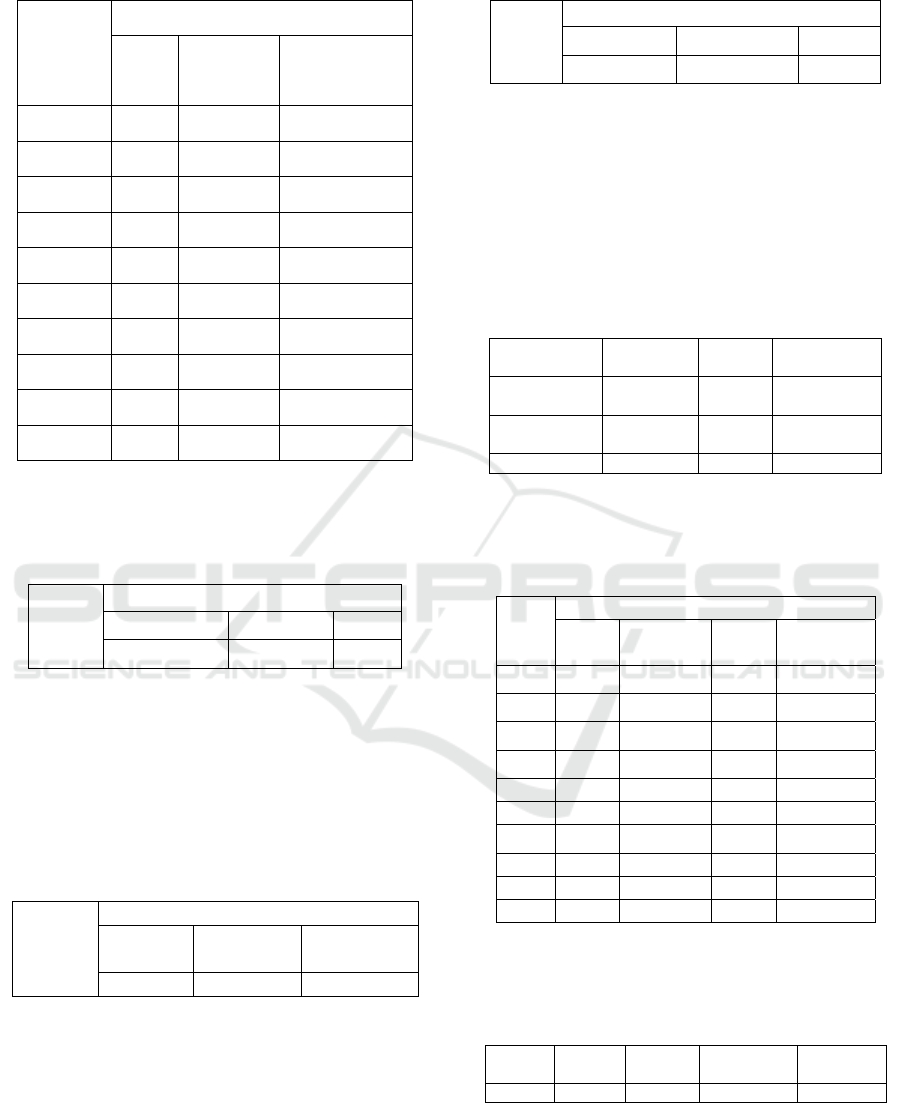
Table 1. Sample Training Data
type of
sample
lab test results
pH
Alkohol
(%)
temperature
(°C)
1A 6,5 1 29-30
1B 6,7 3 29-30
1C 6,7 3 29-30
1D 3,5 4 29-30
1E 3,5 5 29-30
2A 6,8 1 29-30
2B 5,6 4 29-30
2C 3,4 6 29-30
2D 3,3 6 29-30
2E 3,0 6 29-30
The data can be done to the next process of converting
the value. By making the average in the data group.
Table 2. Temperature classification on samples
tempe
rature
(°C)
Classification
cold Medium Hot
<20 >20, <30 >30
Temperature classification is based on the number
of temperature percentages in degrees Celsius (°c),
"cold" for temperatures below or less than 20 °c,
"moderate" classifications for temperatures greater
than 20 °c and less than 30 °c and "heat" for
temperatures over 30 ° C. Temperature classification
is required to know.
Table 2. Classification of alcohol on samples
Alcohol
(%)
Classification
good Good
enou
g
h
Dangerous
<1 >1,<5 >5
Classification on alcohol content is done based on
the number of percentage of alcohol has been read,
the alcohol content is read in percentages (%) If the
alcohol level in the sample is read below 1% then the
condition can be said "good" in the sense of well
worth the consumption, for a percentage above 1%
and less than 5% then the condition "good enough ".
Table 3. pH Classification on samples
pH Classification
sour Normal Wet
4,00 >5,86 <9,18
Classification on pH content, in general, the drink
is considered worthy to be consumed ie that has a
magnitude of pH > 6.86 and < 9.18 but different for
the sample used this time for the condition "Normal"
content on the pH must be in the range of < 9.18 and
> 6.86 + 1% tolerances so the sample can be said to
Normal until pH 5.86 for the condition "sour" pH < 4
or < 5.86.
Table 4. Conversion of classification values
Information Alcohol
(%)
pH temperature
(°C)
GOOD <1 >5,86,
<9,18
>20,<30
GOOD
ENOUGH
>1, <5 4.00 <20
DANGEROUS >5 <9,18 >30
From the table then the training data can be
narrated or classified as follows:
Table 5. Data Trining Classification
Sample
Type
lab test results
pH Alkohol temperat
ure
Information
1A Normal GOOD Medium GOOD
1B Normal Good Enough Medium GOOD
ENOUGH
1C Normal Good Enough Medium GOOD
ENOUGH
1D Sour Good Enough Medium GOOD
ENOUGH
1E Sour Dangerous Medium DANGEROUS
2A Normal Good Medium GOOD
2B Sour Good Enough Medium GOOD
ENOUGH
2C Sour Dangerous Medium DANGEROUS
2D Sour Dangerous Medium DANGEROUS
2E Sour Dangerous Medium DANGEROUS
For data testing can be written with "Data 11" as
in the following data:
Table 6. Data testing
Sampel Ph Alkohol
(%)
temperature
(°C)
Information
3A Normal Goo
d
Medium ?
In data 11, this data testing obtained Normal pH
result, alcohol content is still good and with moderate
temperature. Results on the caption will be searched
using Navie Bayes:
Design of Alcohol Detection and Classification Devices in Traditional Legen / Tuak Drinks using an IoT-based MQ-3 Sensor
281
Step 1
The appearance of "GOOD" in the description
data is 2 items
The appearance of "GOOD ENOUGH" in the
description data is 4 items
Occurrence "DANGEROUS" in the description
data is 4 items
Then,
P
|
C “GOOD” = 2/10
P|C “GOOD ENOUGH” = 4/10
P
|
C “DANGEROUS” = 4/10
Step 2
The second step is data collection where data
collection is the calculation of each other's
information.
Calculate the pH of "Normal" which has the
description "GOOD", "GOOD ENOUGH",
"DANGEROUS".
N
ormal
|
GOOD =2/2
N
ormal
|
GOOD ENOUGH =2/4
N
ormal|DANGEROUS =0/4
Calculate alcohol "Good" which has the
description "GOOD", "GOOD ENOUGH",
"DANGEROUS".
Good|GOOD =2/2
Good|GOOD ENOUGH =0/4
Good|DANGEROUS =0/4
Calculate the temperature "Medium" which has
the description "GOOD", "GOOD ENOUGH",
"DANGEROUS".
Medium
|
GOOD =2/2
Medium|GOOD ENOUGH =2/4
Medium
|
DANGEROUS =4/4
Step 3
The third step is data collection, where data
collection is classified into the calculation of
information from each.
"GOOD" classification
P|C “GOOD” =2/10
N
ormal|GOOD =2/2
Good|GOOD =2/2
Medium|GOOD =2/2
Then, P | GOOD = 2/10 * 2/2 * 2/2 * 2/2
P | GOOD = 0.2
The "GOOD ENOUGH" classification
P
|
C “GOOD ENOUGH” =4/10
N
ormal
|
GOOD ENOUGH =2/4
Good|GOOD ENOUGH =0/4
Medium
|
GOOD ENOUGH =2/4
Then, P | ENOUGH GOOD = 4/10 * 2/4 * 0/4
* 2/4
P | GOOD ENOUGH = 0
"DANGEROUS" classification
P
|
C “DANGEROUS” =4/10
N
ormal|DANGEROUS =0/4
Good
|
DANGEROUS =0/4
Medium
|
DANGEROUS =4/4
Then, P | DANGEROUS = 4/10 * 0/4 * 0/4 *
4/4
P | DANGEROUS = 0
3.4.2 Classification Results
In this final result a comparison of GOOD, GOOD
ENOUGH, and DANGER results from the
calculations done in step 1, step 2 and step 3. The final
result is determined from the magnitude of the
comparison value of the three (3) classifications,
which results are greater:
P
|
GOOD = 0,2
N
ormal|GOOD ENOUGH = 0
Good
|
DANGEROUS = 0
So it can be concluded from the data above, the data
which is rated greater is "GOOD" then the results for
the answer to the test data (data11) in search are
"GOOD".
Table 7. Testing data results
Sample Ph
Alkohol
(%)
temperature
(°C)
Keterang
an
3A Normal Good Medium GOOD
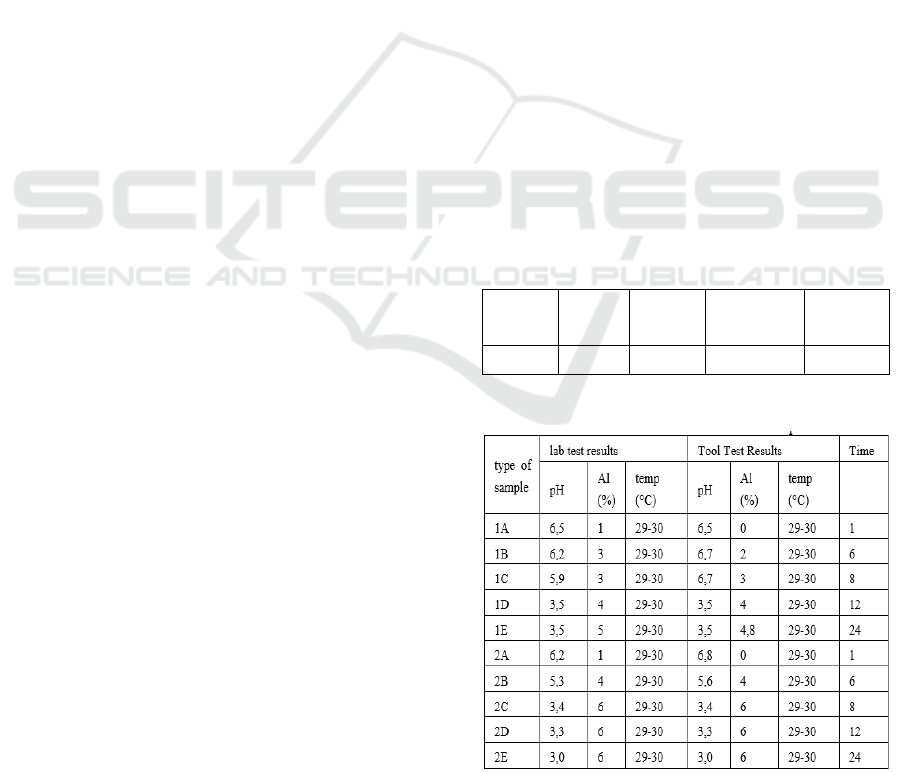
Table 8. Trial Results for the entire sample
HIMBEP 2020 - International Conference on Health Informatics, Medical, Biological Engineering, and Pharmaceutical
282
From the test results in table 9. it can be seen the
contribution of success / accuracy by the Navie Bayes
method using data classification.
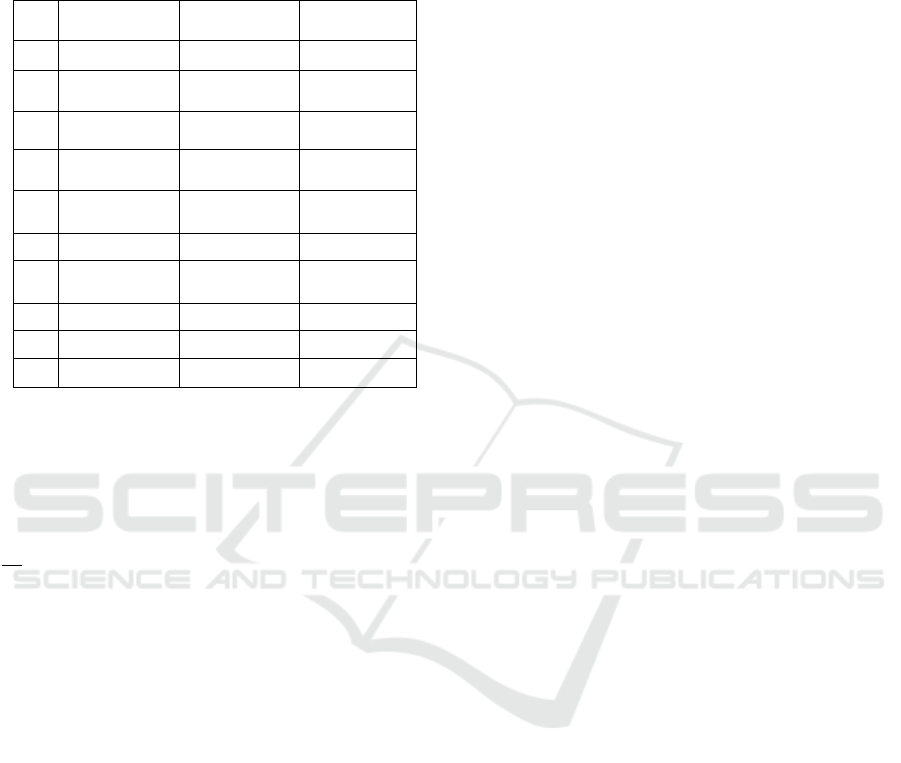
Table 9. Classification of data captions
NO Naïve Bayes
results
Tool Test
Results
information
1 GOOD GOOD Corresponding
2 GOOD
ENOUGH
GOOD
ENOUGH
Corresponding
3 GOOD
ENOUGH
GOOD
ENOUGH
Corresponding
4 GOOD
ENOUGH
GOOD
ENOUGH
Corresponding
5 DANGEROUS GOOD
ENOUGH
Not
Corresponding
6 GOOD GOOD Corresponding
7 GOOD
ENOUGH
GOOD
ENOUGH
Corresponding
8 DANGEROUS DANGEROUS Corresponding
9 DANGEROUS DANGEROUS Corresponding
10 DANGEROUS DANGEROUS Corresponding
Of the 10 data that are owned, which have
information that does not match one (1) data and that
has information according to as many as nine (9) data,
the level of accuracy of tool testing using this method
is very good.
9
10
100% 90%
The level of accuracy is 90% from 100%.
4 CONCLUSION
The authenticity of a Legen sample/Tuak (90-100%)
Can be known using this tool. For Legen testing/Tuak
that is not genuine gas alcohol properties in the
Legen/Tuak only large on the gas is not on the drink
is proven when the long left in the air the alcohol
content that reads very minimal is different from the
original it is compared.
The Navie Bayes method used as a sample
classification method is very well proven by
achieving a 90% success rate on tool testing. The
connected IoT system is excellent showing the work
of each sensor in realtime.
REFERENCES
Alkohol, U. J. I., & Fermentasi, P. (n.d.). Uji alkohol pada
fermentasi tuak. 148–156.
Artikel, I. (2018). Jurnal Litbang Industri. 23–30.
Ayu, I. G., Dhyanaputri, S., & Jirna, I. N. (2017). KAJIAN
KARAKTERISTIK OBJEKTIF DAN SUBJEKTIF
TUAK AREN ( Arenga pinnata ) BERDASARKAN
LAMA WAKTU PENYIMPANAN. 5(2).
Ayu, I., Pranayanti, P., & Sutrisno, A. (2015).
PEMBUATAN MINUMAN PROBIOTIK AIR
KELAPA MUDA ( Cocos nucifera L . ) DENGAN
STARTER Lactobacillus casei strain Shirota The
Making of Coconut Water ( Cocos nucifera L .)
Probiotic Drink with Starter Lactobacillus casei Shirota
strain. 3(2), 763–772.
Bhagwat, S. D., Hulloli, A. I., Patil, S. B., Khan, A. A., &
Kamble, A. S. (2018). Smart Green House using IOT
and Cloud Computing. 2330–2333.
Bhuta, P., Desai, K., & Keni, A. (2015). Alcohol Detection
and Vehicle Controlling. 2015 International Journal of
Enginering Trends and Applications (IJETA), 2(2), 92–
97.
Fatmawati, F. (2016). Perbandingan Algoritma Klasifikasi
Data Mining Model C4.5 Dan Naive Bayes Untuk
Prediksi Penyakit Diabetes. None, 13(1), 50–59.
Hidayatullah, M., Fat, J., & Andriani, T. (2018). Prototype
Sistem Telemetri Pemantauan Kualitas Air Pada Kolam
Ikan Air Tawar Berbasis Mikrokontroler. Positron,
8(2), 43. https://doi.org/10.26418/positron.v8i2.27367
Ikegami, S. (1997). Tuak dalam Masyarakat Batak Toba:
Laporan Singkat tentang Aspek Sosial-budaya
Penggunaan Nira Tuak in the Toba Batak Society: A
Preliminary Report on the Socio-cultural Aspect of
Palm Wine Consumption. (11), 1–8.
Ilmu, D., & Dalam, P. (2019). Fermentasi: Metode untuk
Meningkatkan Nilai Nutrisi Jerami Padi Fermentation:
Methods to Improve Nutrition Value of Rice Straw
Yanuartono, S. Indarjulianto, H. Purnamaningsih, A.
Nururrozi, dan S. Raharjo. 14(1), 49–60.
Lubis, R. S., & Pinem, M. (2014). Analisis Quality of
Service (Qos) Jaringan Internet Di Smk Telkom
Medan. Singuda ENSIKOM, 7(3), 131–136.
Manalu, E., Sianturi, F. A., & Manalu, M. R. (2017).
Penerapan Algoritma Naive Bayes Untuk Memprediksi
Jumlah Produksi Barang Berdasarkan Data Persediaan
Dan Jumlah Pemesanan Pada Cv . Papadan Mama
Pastries. Effrida Manalu, Fricles Ariwisanto Sianturi,
Mamed Rofendy Manalu, 1(2), 16–21.
Moede, F. H., & Gonggo, S. T. (2017). PENGARUH
LAMA WAKTU FERMENTASI TERHADAP
KADAR BIOETANOL DARI PATI UBI JALAR
KUNING ( Ipomea batata L ) The Influence of A Long
Time Fermentation Againts bioethanol levels of Starch
Sweet Potato is Yellow ( Ipomea batatas L ). 6(May),
86–91.
Pamungkas, W., & Kompiang, M. (2006). Teknologi
fermentasi, alternatif solusi dalam upaya pemanfaatan
bahan pakan lokal. 43–48.
Design of Alcohol Detection and Classification Devices in Traditional Legen / Tuak Drinks using an IoT-based MQ-3 Sensor
283

Pangan, M. T., & Pelita, U. (2017). , R Montana 1 , NC
Putri 1. 3(2), 105–116.
Profile, S. E. E. (2018). Classification Using Naïve Bayes
and Decision Tree on Food Addiction Classification
Using Naïve Bayes and Decision Tree on Food
Addiction. (January 2016).
https://doi.org/10.14257/ijdta.2016.9.3.17
Rahmawati, D. (2019). Pengujian Monitoring On-Line
Rumah Kaca Cerdas Berbasis Android. Cyclotron, 2(1).
https://doi.org/10.30651/cl.v2i1.2529
Rao, M. N., Ajit, K. C., & Kumar, G. P. (2018). Smart
Green House Based on IOT. 7, 258–261.
Raschka, S. (2014). Introduction and Theory. 1–20.
Rizal, S., Erna, M., Nurainy, F., & Tambunan, R. (2016).
Karakteristik Probiotik Minuman Fermentasi Laktat
Sari Buah Nanas dengan Variasi Jenis Bakteri Asam
Laktat Probiotic Characteristic of Lactic Fermentation
Beverage of Pineapple Juice with Variation of Lactic
Acid Bacteria ( LAB ) Types mengonsumsi minuman.
18(June), 63–71.
Winasis, W., Nugraha, A. W. W., Rosyadi, I., & Nugroho,
F. S. T. (2016). Desain Sistem Monitoring Sistem
Photovoltaic Berbasis Internet of Things (IoT). Jurnal
Nasional Teknik Elektro Dan Teknologi Informasi
(JNTETI), 5(4), 328–333.
https://doi.org/10.22146/jnteti.v5i4.281
HIMBEP 2020 - International Conference on Health Informatics, Medical, Biological Engineering, and Pharmaceutical
284
