
Elongation Optimization of Bioplastic using Response Surface
Methodology
Trisita Novianti, Issa Dyah Utami
and Heri Awalul Ilhamsah
Department of Industrial Engineering, University of Trunojoyo, Jl. Raya Telang Kamal, Bangkalan, Indonesia
Keywords: bioplastic, corn starch, elongation, optimization, response surface
Abstract: Bio plastics are derived from plant sources such as corn starch, cassava, sugarcane, soybean, banana peel. Bio plastics are
environmental friendly and biodegradable, which is a material that can return to its natural state when buried in the ground
or soaked in the water. Microorganisms will break down into carbon dioxide and water. The aim of this study was
measuring elongation optimization in bio plastic, which made of glycerin and cornstarch as the base material.
For calculation, this study was using the surface response method with experimental design with 2 factors
(22), and experimental design were 13 experiments. Based on the calculation results, the desirability value
for elongation was 18.4. Moreover, the combination of the optimal parameters produced was 0.5 ml glycerin
and 3.81 g starch with the optimum elongation was 17.3%. The elongation of commercial plastic bag is
222.5%. The elongation of bioplastic sample in this research were below this number. Moreover, the bioplastic
sample, which was made of corn starch, cannot be used as commercial plastic bag. However, it can be used
in food packaging, pharmacy, and cosmetic which do not need high elongation, which is around 20%.
1 INTRODUCTION
Bioplastics are derived from plant sources such as corn
starch, cassava, sugarcane, soybean, banana peel. Bio
plastics are environmental friendly and biodegradable,
which is a material, returns to its natural state when buried
in the ground or soaked in the water (Ghayebzadeh et al.,
2020). Microorganisms will break down into carbon
dioxide and water. Bags are made of bio plastic can be
thrown away and buried (Zhang et al., 2020). This can
reduce plastic waste in the world, especially in the ocean
(Andrady, 2017). The fact, Indonesia has the second rank
for plastic waste in the ocean after China. This condition
can cause animal death, which is accidentally eat plastic
waste (Lestari and Trihadiningrum, 2019). Bio plastics can
be used for shopping bag, food packaging, gardening,
sanitary products, medical product (Jambeck et al., 2015).
Urbanization and industrialization combined an
increasing in the population has led to the
accumulation of boundless quantities of non-
biodegradable waste in the environment. Plastics
have turned to be an expected part of day-to-day life.
Deceleration in accessibility of petrochemical
residues has led to the dependence and development
of eco-friendly and biodegradable plastics of
commercial stuff, with improved worldly properties
than their synthetic (Umesh et al., 2018). Using non-
renewable packaging make a serious ecological
problem caused by their non-biodegradability. The
development of biodegradable edible film can replace
synthetic materials, thus protecting environment and
improving product quality (Araújo et al., 2018a).
Biodegradable films may be made of natural
polymers, for instance proteins, polysaccharides,
lipids, or a combination of these compounds (Abbas
et al., 2017).
In this study was used cornstarch for basic
material, because of its large availability, easily
available in Indonesia, and the price is cheap. For
making bio plastic, first this study had to assess the
mechanical properties of the bio plastic. This can be
indicated by measuring elongation which is one of
indicators of the flexibility of the material (Domene-
López et al., 2019). In accordance to Japanese
Industrial Standard, the percent extension or
flexibility is categorized as good if above 10% and
will be categorized very well if it exceeds 50%
(Miyamoto et al., 1984). The surface response
methodology was used to measure the optimum
composition for glycerine and corn starch to form bio
plastic material which has maximum elongation. This
response surface method is an optimization method
448
Novianti, T., Utami, I. and Ilhamsah, H.
Elongation Optimization of Bioplastic using Response Surface Methodology.
DOI: 10.5220/0010313300003051
In Proceedings of the International Conference on Culture Heritage, Education, Sustainable Tourism, and Innovation Technologies (CESIT 2020), pages 448-453
ISBN: 978-989-758-501-2
Copyright
c
2022 by SCITEPRESS – Science and Technology Publications, Lda. All rights reserved
that is devoted to research using experiments
(Gaspersz, 1992, Akinoso et al., 2012).
2 METHODOLOGY
2.1 The Process of Making Bioplastics
The concentration of cornstarch and glycerin was
used in accordance pre-determined coding. Added 0.8
g carrageenan, then distilled r with 100 ml water. The
next process was heated using a hotplate with a
temperature of 95
o
C while stirring for 30 minutes.
Next step was preparing a mold made of square glass
with a size of 10 cm x 10 cm, after going through the
stirring process for 30 minutes, the bio plastic was
taken 15 ml and printed in the mold. Then the mixture
was dried in an oven at 65
o
C for 8 hours.
Furthermore, observations were made by forming
bio plastics which be tested using a Texture Analyzer
(de Azêvedo et al., 2020). A bio plastics sample,
which was analysed, was 1cm x 5 cm. The
measurement process by clamping the bio plastic
sample with the tool and stretch it until broke up.
When the biopassicator was broke, the tool
automatically stops pulling (Novianti et al., 2019)
2.2 Data Retrieval
Data retrieval process was carried out using the
Texture Analyzer tool. The tool can be used to
measure the elongation of bio plastics. The process of
retrieving data for elongation is as follows:
a. Making bio plastic sample, the size is 1 cm x 5
cm;
b. make initial settings with distance around 4 cm
between clamp 4 cm;
c. clamping the two ends of the bio plastic on the
clamp in the Texture Analyzer tool;
d. do the Running Texture Analyzer Tool
e. the tool will automatically stop when the object
(bio plastic) will be disconnected;
f. the results are the output peak force.
2.3 Elongation Assessment
Cornstarch has a level of elasticity in bio plastics.
Starch has amylase content and high plasticize in
glycerin which cause bio plastics are having a high
flexibility. The levels of amylopectin have an effect
to make bio plastic stable in flexibility (Ibrahim et al.,
2019, Reyes et al., 2020). Elongation testing in this
study by taking bio plastic samples by cutting 1 cm x
5 cm x 0.1 cm. Then it was tested and obtained the
maximum pull until the bio plastics break up. For
calculating elongation using a formula as follows:
Elongation=
100%
(1)
where are:
Elongation = Bio plastics elasticity (%)
b = additional length of sample when torn (cm)
a = sample length before it is pulled out (cm)
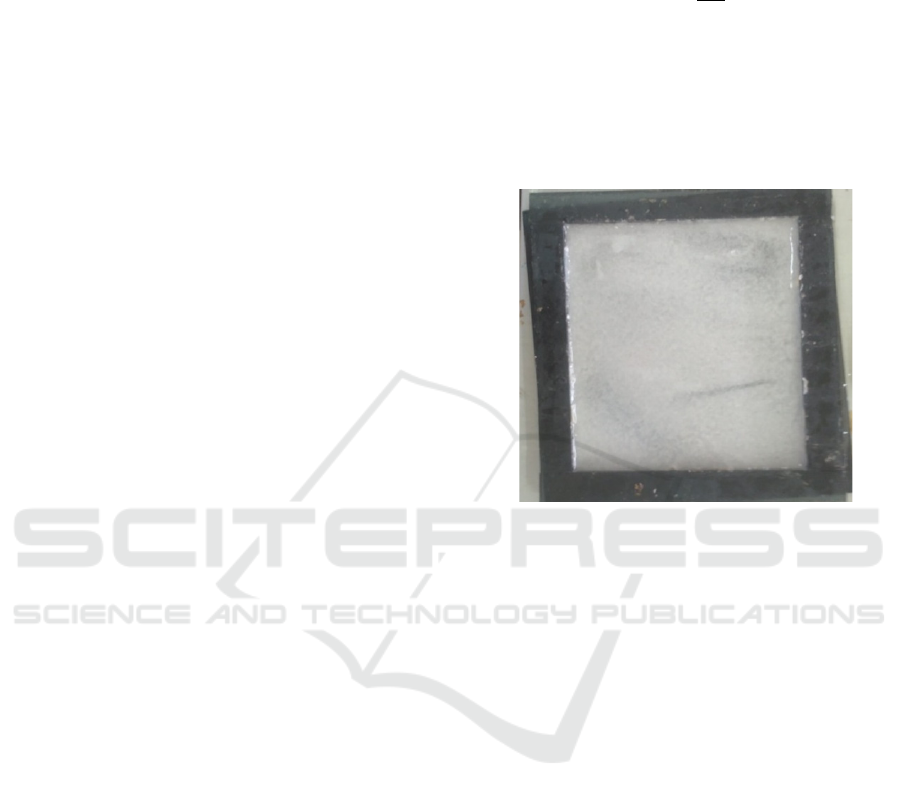
The following is a sample size of the bio plastic to
be tested using a texture analyzer:
Figure 1: Bioplastic sample.
The completion method that will be used is the
surface response method, which is a collection of
statistical and mathematical techniques that are useful
for analyzing problems about several independent
variables that affect non-independent variables
(Montgomery, 2017). The response surface method
has the goal of finding the optimum response (Biglari
et al., 2018). In this study identified the optimum
response from bio plastics to the concentration of
cornstarch.
The response surface method has the advantage of
the other methods, which is the number of
experiments is less so that the experimental costs can
be reduced, and can be used for multiple responses.
Then the output produced is an equation which will
be used to predict the response with different
independent variable values (Mäkelä and
Management, 2017).
The results of the response surface method are
countur plot and surface plot. Both will show the
optimal area and can determine the level of influence
of the independent variable on the response variable
(Dean et al., 2017). Next is the D-Otimaly Response
curve, which is a curve that will show the value of
desbirability from optimal conditions for both
responses. The equation as follows:
Elongation Optimization of Bioplastic using Response Surface Methodology
449

Y = B
0
+B
1
X
1
B
2
X
2
+B
3
𝑋
𝐵
𝑋
𝐵
X
1
X
2
(2)
From the data that has been obtained from the
experimental results, the data will be processed with
the calculation of the matrix, so that the coefficients
from the above equation will be obtained. The steps
of the response surface method to be carried out are
as follows (Sarabia et al., 2019):
a. Look for response surface coefficients by doing
matrix calculations (in this study was used
minitab for calculation);
b. assess model significance (ANOVA);
c. if the result is a significant, then the test will
continue to determine the optimal parameters
The following hypothesis on a significant test that
was conducted:
H
0
= Significant Model is proven
H
1
= Significant Model is not proven
If F
count
> F
table
and Sig < 0.05, then accept H
0
.
Furthermore, the test can be continued to next step
which is optimal parameter assessment. The next step
is to determine the optimum parameters by using the
response optimizer in the Minitab application. The
output of the process is calculated plot, surface plots
and D-Optimal Response curves (Myers et al., 2016).
To determine the optimum area, it can be seen
from the contour of the plot, while the surface plot
will show the parameters that most influence to the
response (Baş and Boyacı, 2007). D-Optimaly
response can show its optimum point. In this study
will show bio plastic parameters from the
composition of glycerin and cornstarch (Yolmeh et
al., 2017). Experimental design as follows:
Table 1: Experimental design.
Experimental
Design
Factors (k)
2 3 4 5
Factorial Design 2
2
2
3
2
4
2
5
α (2
(k/4)
) 1.414 1.682 2 2.378
Number of
central
repetition
5 6 7 10
α value can be derived as follow:
𝑎2
/
(3)
Whereas:
k = Number of factors
α = Error
Table 2: Treatment code of glycerin and starch.
Treatments Treatments Codes
-1.414 -1 0 1 1.414
Glycerin
(ml)
1 0.5 1 1.5 2
Starch (g) 2 2 3 4 5
The research was conducted using response which
was elongation optimal solution and using two
factors. By using the Central Composite Design
method, the number of experiments were 13 with the
following details.
N = 2
n
+ 2n + m
N = 2
2
+ 2(2) + 5
N = 4 + 4 + 5
N
= 13
(4)
Whereas:
N : Number of experiments
n : Number of factors
m : number of centre point repetition
The experimental data were generated using the
response surface method. The independent variable
used in this experiment were glycerine and corn
starch composition. While the dependent variables
was elongation. The complete experimental design is
as follows.
1. Factor:
a) X
1
for glycerin experimental code
b) X2 for cornstarch experimental code
c) G for glycerin real composition from 0.5 ml
to 2 ml
d) T for cornstarch real composition from 2 g to
5 g
2. Response:
Y for bio plastic elongation code
The values of T and G for α and - α which were
used as follows:
a. Value of cornstarch for α code (1.414)
T = x
i
(Δx
+1,-1
/ 2) + x
original
T = 1,414 ((4-2) / 2 ) + 3
T = 1,414 (1) + 3
T = 4,414 5 gram
b. Value of cornstarch for -α code (-1.414)
-T = x
i
(Δx
+1,-1
/ 2) + x
original
-T = -1,414 ((4-2) / 2 ) + 3
-T = -1,414 (1) + 3
-T = -2,414 2 gram
c. Value of glycerin for α code (1.414)
G = x
i
(Δx
+1,-1
/ 2) + x
original
G = 1,414 ((1,5-0,5) / 2 ) + 1
G = 1,414 (0.5) + 1
G = 1,707 2 ml
CESIT 2020 - International Conference on Culture Heritage, Education, Sustainable Tourism, and Innovation Technologies
450
d. Value of glycerin for -α code (-1.414)
-G = x
i
(Δx
+1,-1
/ 2) + x
original
-G = -1,414 ((1,5-0,5) / 2 ) + 1
-G = -1,414 (0,5) + 1
-G = 0,293 1 ml
3 RESULT AND DISCUSSION
The higher of elongation, the elasticity of the bio
plastics will have more elastic and not easily broken
(Araújo et al., 2018b). The following was a
recapitulation of the elongation test:
Table 3: Elongation assessment.
No Factor
Code Composition Response
X
1
X
2
G
(ml)
T (g) Y (%)
1 0 0 1 3 10
2 0 0 1 3 12
3 0 0 1 3 14
4 0 0 1 3 11
5 0 0 1 3 9
6 -1,414 0 1 3 7
7 1,414 0 2 3 11
8 0 -1,414 1 2 7
9 0 1,414 1 5 6
10 -1 -1 0,5 2 8
11 1 -1 1,5 2 10
12 -1 1 0,5 4 9
13 1 1 1,5 4 9
Whereas:
X
1
= Treatment code for glycerin
X
2
= Treatment code for corn starch
G = Composition of glycerine (ml)
T = Composition of corn starch (g)
Y
= Bio plastic elongation (%)
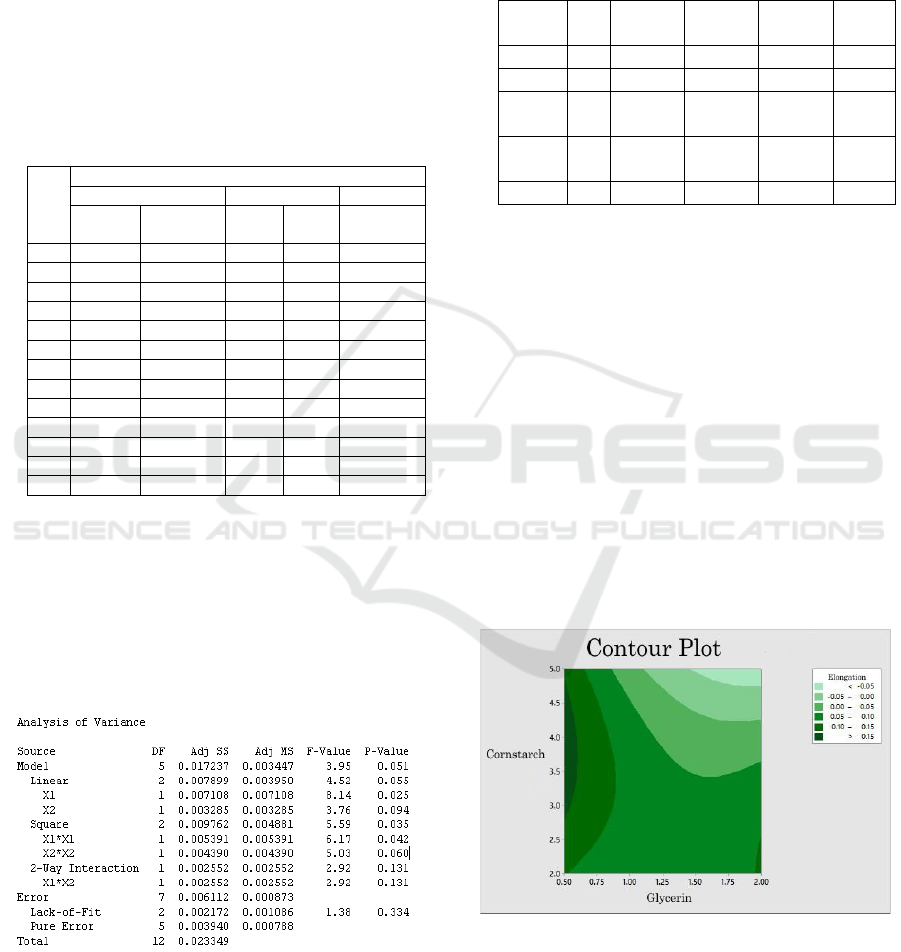
The following were the results of the coefficient
model output from the calculation of Minitab:
Figure 2: The calculation result.
Y = -0,084 - 0,141 X
1
+ 0,1845 X
2
+ 0,0974X
-
0,02085X
- 0,0505 X
1
X
2
(5)
Whereas:
Y = Maximum optimal solution for elongation
bioplastic
X
1
= Glycerin
X
2
= Cornstarch
Table 4: The result of Analysis of Varian (ANOVA).
Source DF Adj SS Adj
MS
F-
Value
P-
Value
Model 5 22.1318 4.43 8.7 0.006
Error 7 3.5613 0.508
Lack
of fit
3 2.5842 0.8614 3.53 0.127
Pure
error
4 0.9771 0.2443
Total 12 25.69
Based on the table, an elongation test of
cornstarch model, obtained F count was 8.7 then F
table obtained by the distribution table F with df
model was 5 and df error was 7. From the lack of fit,
test obtained p value = 0.127 which is greater than the
significance level α = 0.05, then the model accept H
0
. It can be interpreted that the regression model was
suitable and can be continued with the next model.
The next step was the optimal parameter
determination stage. The optimal area was derived by
using contour plots, surface plots on elongation tests,
and then the optimal combination of parameters for
elongation test using D-Otimaly Response, where the
two plots will show the range of parameters and
response. In this study there were two factors. The
following were plot contours and surface plots for
elongation test:
Figure 3: Elongation contour plot.
It can be shown in figure 3 that optimal solution is
between 2.0 g to 5.0 g of corn starch and 0.5 ml to
2.00 ml glycerine.
Elongation Optimization of Bioplastic using Response Surface Methodology
451
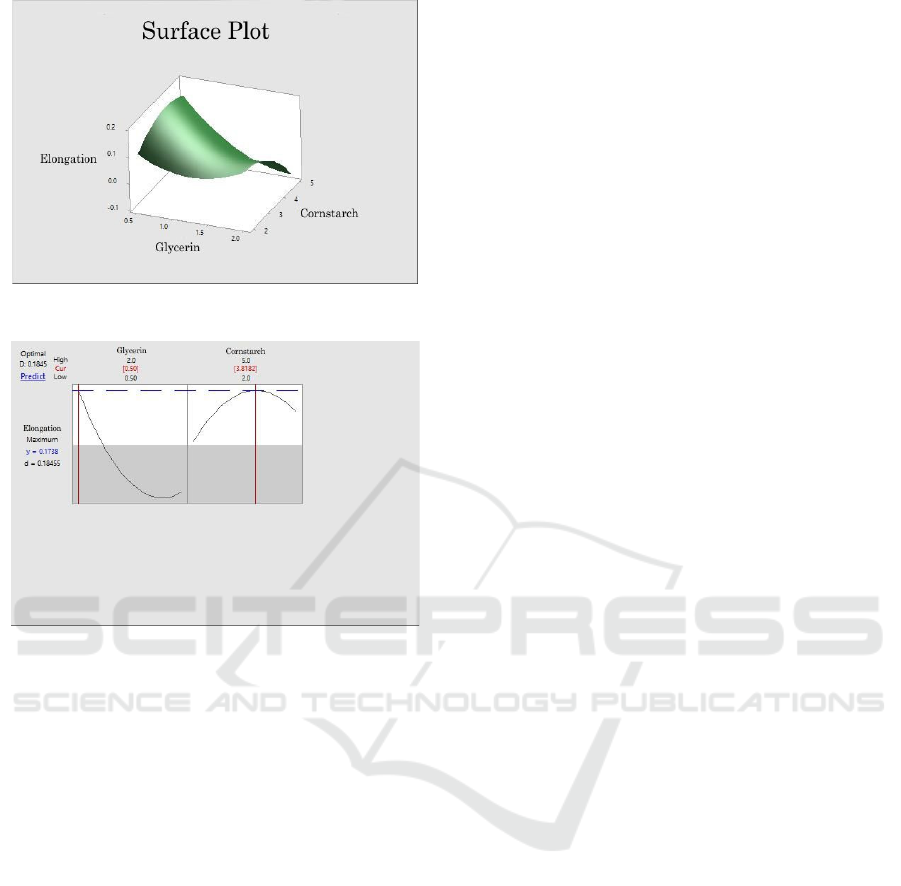
Figure 4: Elongation surface plot.
Figure 5: Elongation optimal solution area.
Based on the figure, elongation D-Optimaly
response was obtained by the value of the
desibrability function. Desirability value for
elongation was 18.4, then the combination of the
optimal parameters were 0.5 ml glycerin and 3.81 g
cornstarch along with the optimum elongation result
was 17.3%.
Elongation of this study also has met the standard,
according to the Japanese Industrial Standard,
elongation is categorized as good if above 10% and
will be categorized very well if it exceeds 50%. The
elongation of commercial plastic bag is 222.5%. The
elongation of bioplastic sample in this research were
below this number. Moreover, the bioplastic sample,
which was made of corn starch, cannot be used as
commercial plastic bag. However, it can be used in
food packaging, pharmacy, and cosmetic which do
not need high elongation, which is around 20%
(Gozan and Noviasari, 2018). Moreover, using
biodegradable packaging in the commercial or daily
usage can protect ecological system and save habitat
in the environment.
4 CONCLUSIONS
The optimal solution was derived by using the surface
response methodology which had 2 factors (2
2
) of
experimental design. Moreover, the study design was
using 13 experiments. Based on the figure, elongation
D-Optimaly response was obtained by the value of
the desibrability function. Desirability value for
elongation was 18.4, then the combination of the
optimal parameters were 0.5 ml glycerin and 3.81 g
cornstarch along with the optimum elongation result
was 17.3%. Elongation of this study also has met the
standard, according to the Japanese Industrial
Standard, elongation is categorized as good if above
10% and will be categorized very well if it exceeds
50% (Rudnik, 2019). The elongation of commercial
plastic bag is 222.5%. The elongation of bioplastic
sample in this research were below this number.
Moreover, the bioplastic sample, which was made of
corn starch, cannot be used as commercial plastic bag.
However, it can be used in food packaging,
pharmacy, and cosmetic which do not need high
elongation, which is around 20%. The combination
responses of tensile strength, elongation, modulus
young optimizing can be done in the future research
for improving edible film properties. Using
biodegradable packaging in the commercial or daily
usage can protect ecological system and save habitat
in the environment.
ACKNOWLEDGEMENTS
This publication was financed by University of
Trunojoyo.
REFERENCES
Abbas, H. K., Accinelli, C. & Shier, W. T., 2017. Biological
control of aflatoxin contamination in US crops and the
use of bioplastic formulations of Aspergillus flavus
biocontrol strains to optimize application strategies,
Journal of agricultural and food chemistry, 65, 7081-
7087.
Akinoso, R., Adeyanju, J. A. J. F. & Technology, B., 2012.
Optimization of edible oil extraction from ofada rice
bran using response surface methodology. 5, 1372-
1378.
Andrady, A. L. J. M. P. B., 2017. The plastic in
microplastics: A review. 119, 12-22.
Araújo, C., Rodrigues, A., Joele, M. P., Araújo, E. &
Lourenço, L., 2018a. Optimizing process parameters to
obtain a bioplastic using proteins from fish byproducts
CESIT 2020 - International Conference on Culture Heritage, Education, Sustainable Tourism, and Innovation Technologies
452

through the response surface methodology, Food
packaging and shelf life, 16, 23-30.
Araújo, C., Rodrigues, A., Joele, M. P., Araújo, E.,
Lourenço, L. J. F. P. & Life, S., 2018b. Optimizing
process parameters to obtain a bioplastic using proteins
from fish byproducts through the response surface
methodology. 16, 23-30.
Baş, D. & Boyacı, I. H. J. J. O. F. E., 2007. Modeling and
optimization I: Usability of response surface
methodology. 78, 836-845.
Biglari, N., Dashti, M. G., Abdeshahian, P., Orita, I., Fukui,
T. & Sudesh, K. J. B., 2018. Enhancement of bioplastic
polyhydroxybutyrate P (3HB) production from glucose
by newly engineered strain Cupriavidus necator
NSDG-GG using response surface methodology. 8,
330.
De Azêvedo, L. C., Rovani, S., Santos, J. J., Dias, D. B.,
Nascimento, S. S., Oliveira, F. F., Silva, L. G., Fungaro,
D. A. J. J. O. P. & Environment, T., 2020. Study of
Renewable Silica Powder Influence in the Preparation
of Bioplastics from Corn and Potato Starch. 1-14.
Dean, A., Voss, D. & Draguljić, D., 2017. Response surface
methodology. Design and analysis of experiments.
Springer.
Domene-López, D., Delgado-Marín, J. J., Martin-Gullon,
I., García-Quesada, J. C. & Montalbán, M. G. J. I. J. O.
B. M., 2019. Comparative study on properties of starch
films obtained from potato, corn and wheat using 1-
ethyl-3-methylimidazolium acetate as plasticizer. 135,
845-854.
Gaspersz, P. J. T. B., 1992. Teknik Analisis dalam
Perancangan Percobaan. 719.
Ghayebzadeh, M., Aslani, H., Taghipour, H. & Mousavi, S.
J. M. P. B., 2020. Estimation of plastic waste inputs
from land into the Caspian Sea: A significant unseen
marine pollution. 151, 110871.
Gozan, M. & Noviasari, C. The effect of glycerol addition
as plasticizer in Spirulina platensis based bioplastic.
E3S Web of Conferences., 2018. EDP Sciences, 03048.
Ibrahim, M., Sapuan, S., Zainudin, E. & Zuhri, M. J. I. J. O.
B. M., 2019. Potential of using multiscale corn husk
fiber as reinforcing filler in cornstarch-based
biocomposites. 139, 596-604.
Jambeck, J. R., Geyer, R., Wilcox, C., Siegler, T. R.,
Perryman, M., Andrady, A., Narayan, R. & Law, K. L.
J. S., 2015. Plastic waste inputs from land into the
ocean. 347, 768-771.
Lestari, P. & Trihadiningrum, Y. J. M. P. B., 2019. The
impact of improper solid waste management to plastic
pollution in Indonesian coast and marine environment.
149, 110505.
Mäkelä, M. J. E. C. & Management 2017. Experimental
design and response surface methodology in energy
applications: A tutorial review. 151, 630-640.
Miyamoto, H., Kobayashi, H. & Ohtsuka, N., 1984.
Standard method of test for elastic-plastic fracture
toughness JIC recommended in Japan. Mechanical
Behaviour of Materials. Elsevier.
Montgomery, D. C., 2017. Design and analysis of
experiments, John wiley & sons.
Myers, R. H., Montgomery, D. C. & Anderson-Cook, C.
M., 2016.
Response surface methodology: process and
product optimization using designed experiments, John
Wiley & Sons.
Novianti, T., Anna, I. & Cahyadi, I. Optimization of
bioplastic’s tensile strength. Journal of Physics:
Conference Series., 2019. IOP Publishing, 012048.
Reyes, J. D. C., Tungol, J. M., Musngi, P. P., Magarro, A.
S., Guevarra, K. F., Santos, J. S. J. J. O. H. &
Development, E., 2020. Three Experimental Phases of
Cornstarch-Based Biodegradable Plastic. 2, 81-89.
Rudnik, E., 2019. Compostable polymer materials,
Newnes.
Sarabia, L. A., Ortiz, M. C. & Sánchez, M. S., 2019.
Response surface methodology.
Umesh, M., Mani, V. M., Thazeem, B. & Preethi, K., 2018.
Statistical Optimization of Process Parameters for
Bioplastic (PHA) Production by Bacillus subtilis
NCDC0671 Using Orange Peel-Based Medium.
Iranian Journal of Science and Technology,
Transactions A: Science, 42, 1947-1955.
Yolmeh, M., Jafari, S. M. J. F. & Technology, B., 2017.
Applications of response surface methodology in the
food industry processes. 10, 413-433.
Zhang, C., Wang, C., Cao, G., Wang, D. & Ho, S.-H. J. J.
O. H. M. 2020. A sustainable solution to plastics
pollution: An eco-friendly bioplastic film production
from high-salt contained Spirulina sp. residues. 388,
121773.
Elongation Optimization of Bioplastic using Response Surface Methodology
453
