
Analysis of Mental Workload and Musculoskeletal Disorders among
IT Workers
Clara Theresia
1
and Yasmin Nabilla
2
1
Department of Industrial Engineering, Faculty of Industrial Technology, Universitas Katolik Parahyangan, Bandung,
Indonesia
2
Department of Industrial Engineering, Faculty of Industrial Technology, Institut Teknologi Bandung, Bandung, Indonesia
Keywords: NASA TLX, Nordic Musculoskeletal Questionnaire, mental demand.
Abstract: Interaction between human and computer for long periods has the potential impact of discomfort and
musculoskeletal disorders. The purpose of this study was to analyze subjective mental workload and its
correlation with musculoskeletal disorders among Information Technology (IT) workers in Bandung,
Indonesia. This research consisted of eighty-seven IT workers, with an average of 25 years (21 to 34 years).
Participants were asked to fill out questionnaires about demographic data, NASA Task Load Index (TLX)
and Nordic Musculoskeletal Questionnaire (NMQ). Generally, IT workers have experienced pain in the
neck (35%), shoulder (29%), and upper back (24%). The result of mental workload assessment using
NASA-TLX concluded that mental demands with 84% rating score and temporal demands with 64%
contributed most of the total NASA-TLX score (69.5% ± 10.24). Pearson correlation result showed a
significant correlation between NASA-TLX score and one of NMQ dimension (lower back) with value r
(87) = 0.216 (p<0.05).
1 INTRODUCTION
Your paper will be part of the conference
proceedings therefore we ask that authors follow the
guidelines explained in this example and in the file
«FormatContentsForAuthors.pdf» also on the zip
file, in order to achieve the highest quality possible
(Smith, 1998).
Human-computer interaction between workers
and computers had the risk of causing physical and
mental discomfort and injury. About 70% of
professional IT workers experienced muscle injuries
due to using a computer in the long-term (Sharan et
al, 2011). Mehta and Parijat's research reported that
about 25% of IT employees suffered muscle
injuries to the neck and back (Mehta.and Parijat,
2012). Injuries and discomfort are also experienced
by bank employees in Iran where a total of 78.5%
complained of musculoskeletal disorders in the neck
and back (Darvishi et al, 2016). In addition,
complaints and injuries are experienced by workers
who usually interact with computers. The results
showed that 73% of workers had complaints in the
back and 71% had complaints in the neck of a total
of 254 respondents using the Musculoskeletal
Symptoms of the Questionnaire (Cho et al, 2012).
Jafari and colleagues have been proved that 56.9%
of Bank employees in Yazd-Iran had
musculoskeletal complaints, especially in the neck
and lower back [6]. Similar findings were found that
bank employees had a musculoskeletal disorder
highly distributed to parts of the body namely 48%
in the neck, 44% in the lower back and 36% in the
upper back (Darvishi et al, 2016). Musculoskeletal
disorder can be assessed using the NORDIC
questionnaire, consisting of 11 rating scales from 0
to 10 where scale 0 means no pain until scale 10
means feels very painful or injured (Kuorinka et al,
1987).
There are two classifications of workload,
namely physical and mental workload. Physical
workload is commonly defined as a workload that
required physical activity and often results in long-
term musculoskeletal disorder. Meanwhile, mental
workload is a load that arises due to work activities
related to cognitive processes such as attention,
planning, logical reasoning, and decision making
(Toomingas et al, 2012). Several approaches can be
used in evaluating and predicting mental workload
include subjective approaches, assessment of
340
Theresia, C. and Nabilla, Y.
Analysis of Mental Workload and Musculoskeletal Disorders among IT Workers.
DOI: 10.5220/0010311200003051
In Proceedings of the International Conference on Culture Heritage, Education, Sustainable Tourism, and Innovation Technologies (CESIT 2020), pages 340-345
ISBN: 978-989-758-501-2
Copyright
c
2022 by SCITEPRESS – Science and Technology Publications, Lda. All rights reserved

performance and physiological measurements.
Subjective assessment is important in evaluating
workloads because it has practical advantages, easy
implementation and non-intrusiveness. The
interaction between human-machine systems in the
activities of IT companies was very complex so
evaluating employee workloads will become more
difficult. In this case, subjective workload
assessment will greatly useful to assess mental
workload effectively (Toomingas et al, 2012; Rubio
et al, 2004).
Subjective mental workload is an assessment of
mental workload based on the perceptions of each
individual. There are several commonly used
approaches namely Cooper Harper Scale, NASA
Task Load Index (TLX), Subjective Workload
Assessment Technique (SWAT), Rating Scale
Mental Effort (RSME) and Workload Profile [8-9].
NASA-TLX is one of the most widely used multi-
dimensional tools because it was practical with great
validity and reliability.
NASA TLX can be used to measure mental
workload which pioneered by Sandra G. H. and
continues to be developed by Human Performance
Group NASA's Ames Research Center. In the
NASA-TLX, six dimensions are used to measure
workload including mental demand, physical
demand, temporal demand, performance, effort, and
frustration. Each dimensions of NASA-TLX is
assessed by individual perceptions on a scale of 0-
100 (Hart and Staveland, 1988).
NASA-TLX can be used in various research such
as the following studies. Ning et al. tested the
activity of using a touch screen device with NASA-
TLX. Some findings from the experiment that typing
was an activity with the highest mental workload,
followed by reading and playing games
(Ning et al , 2015)The use of NASA-TLX in the
field of aviation has been done to air traffic
controllers, the test results showed that the NASA-
TLX rating is getting higher along with the
increasing number of aircraft (Collet et al, 2009).
Research on emergency medical services also
showed that the hardest task is evacuated casualties
who fall into the mud on steep surfaces with the
condition of patients already very fragile due to the
effects of chemotherapy. In this task, almost all
dimensions had very high ratings except the
performance and frustration dimensions that tend to
be moderate. The smallest mental workload score
from medical personnel’s emergency was on the
activity of testing blood sugar samples (Reuter and
Camba, 2017). NASA-TLX has been used to
examine workers who do physical work such as
lifting, lowering, pushing, and pulling. The worker is
also suffered from pain in the lower back. The
highest rating was mental demand dimensions which
reached 67.12% and followed by effort (62.8%) and
temporal demand (60.8%), while the other
dimensions included a rather high category
(Darvishi et al, 2017) In the nuclear industry, the
user interface layout affected the mental workload of
the operator. Regardless of the good or bad design,
mental demand, temporal demand, and frustration
are contributed significantly to the mental workload
by workers, while the other three dimensions were in
the medium level category (Yan et al, 2017).
Mental workload investigation using NASA-
TLX was used to analyze Bank employee’s
workload in Iran. Major findings from this research
that effort had the highest score (72.8%) and
followed by mental workload (62.7%). Other
findings suggest that subjective mental workload
had a strong correlation with working experience
and marital status (Darvishi et al, 2016). According
to Darvishi et.al, there was a correlation between
mental workload and demographic aspect. There has
been limited research that analyzes about mental
workload and musculoskeletal disorder assessment
using NASA-TLX and Nordic Musculoskeletal
Questionnaire (NMQ) in Indonesia. This study
sought to investigate mental workload and its
correlation to the prevalence of musculoskeletal
disorders among IT workers in Indonesia.
2 METHODS
Eighty-seven respondents (72 male and 15 female)
volunteered to respond to several questionnaires in
this research. The subjects were between the ages of
21 and 34 years (M= 24.8, SD= 2.55). All of the
respondents were IT workers at Bandung, Indonesia.
The subjects must fill a questionnaire about
demographics such as age, education, gender, and
working experience. Subjective mental workload
was assessed using the NASA-TLX (Table 1) (Hart
and Staveland, 1988). Participants also completed
Nordic Musculoskeletal Questionnaire (NMQ)
which is slightly modified by Indonesian
Ergonomics Society in Indonesian version (Fig. 1)
(Perhimpunan Ergonomi Indonesia or Indonesian
Ergonomic Society, 22 July 2019).
Analysis of Mental Workload and Musculoskeletal Disorders among IT Workers
341
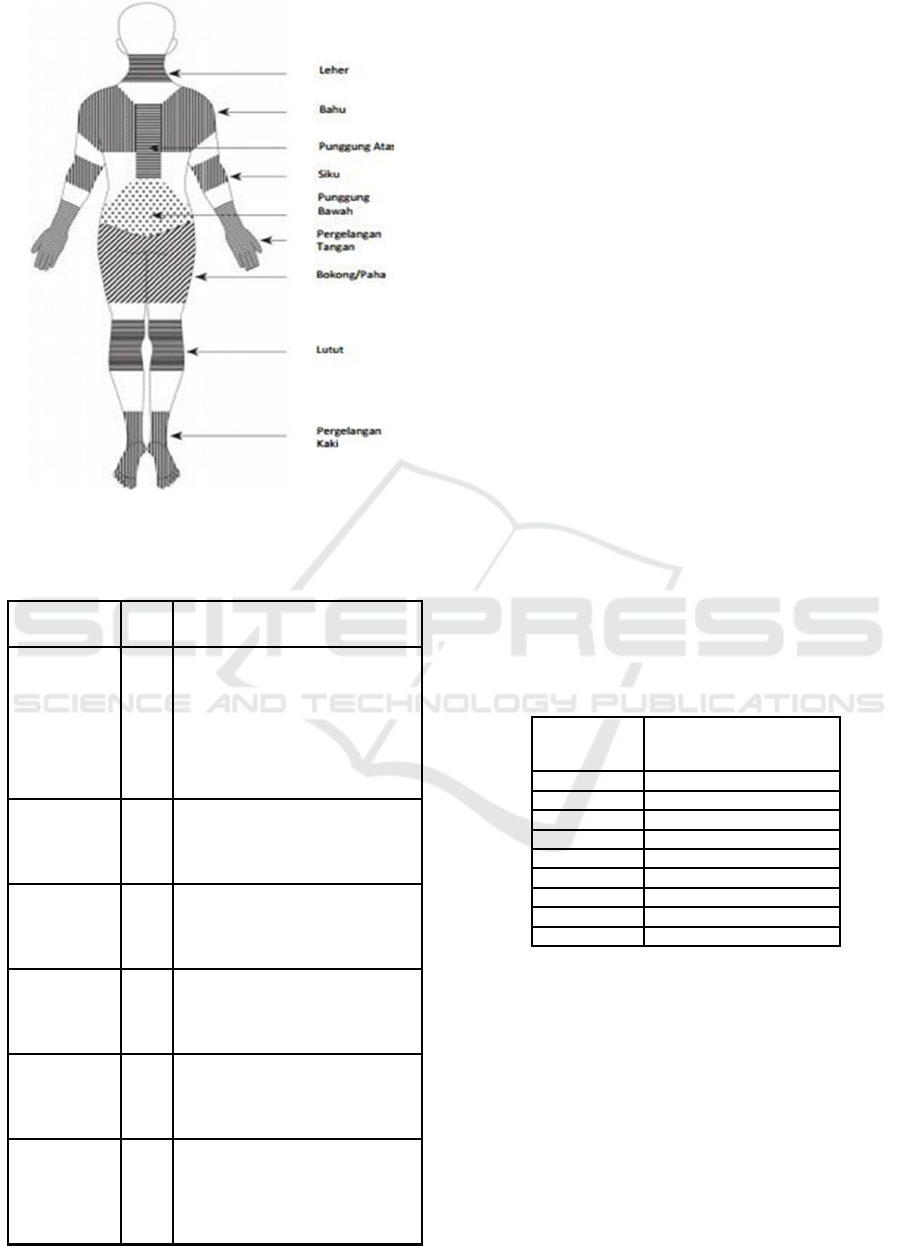
Figure 1: Body Sketch used in the Nordic Questionnaire
(Indonesian version).
Table 1: NASA-TLX questionnaire.
Title Scale Descriptions
Mental
Demand
Low/
High
How much mental and
perceptual activity was
required?
(e.g.thinking,
calculating, the task
easy
or
remembering)
Was
demanding,
simple or complex, exacting or
forgiving?
Physical
Demand
Low/
High
How much physical activity was
required?
(e.g. pushing, pulling, turning,
controlling)
Temporal
Deman
d
Low/
Hi
g
h
How much time pressure did
you feel due to
Date or pace at which the
tasks
o
r
task elements occurred?
Effort
Low/
High
How hard did you have to work
(
mentall
y
o
r
physically) to accomplish your
p
erformance?
Performance
Good
/
Poor
How successful do you think
you were in
accomplishing the goals of the
task set by the experimenter?
Frustration
Low/
High
How insecure, discouraged,
irritated, stressed, and annoyed
versus secure, gratified, content,
relaxed and complacent did you
feel during the task?
3 RESULTS AND DISCUSSIONS
3.1 Demographic Data
Eighty-seven participants were conducted to fill a
questionnaire about demographic data such as age,
gender, working experience, and education
background. Working experience of employees was
1.2 years with the shortest time being 0.5 months
and a maximum of 6.1 years at the time this research
was conducted. In a day, employees worked with an
average of 8.6 ± 1.1 hours excluding 1 hour of free
rest at any time. Mostly, IT workers had
undergraduate education (79.3%) and 18 others had
higher or lower education than undergraduate
(20.7%).
3.2 The Prevalence of Musculoskeletal
Disorders
According to NMQ questionnaire, it was found that
94.25% of respondents had felt pain at least in one
of the nine musculoskeletal body parts. This finding
was in line with Darvishi and colleague’s research
that there was 78.5% of employees who experienced
musculoskeletal complaints during the last 12
months (Darvishi et al, 2016).
Table 2: The prevalence of musculoskeletal disorders of it.
WORKERS
Parts of
Body
Prevalence of
Musculoskeletal
Disorder
(%)
Nec
k
35.2
Shoulde
r
29.2
Upper Bac
k
23.8
Elbow
7.7
Lower Back 23.9
Wris
t
15.4
Hip/thigh
10.6
Knee
5.5
Ankle
3.2
Table 2 shows the prevalence of musculoskeletal
disorders of IT workers during they worked for the
company. Neck had the highest prevalence of 35.2%
followed by shoulder with 29.2%. The upper back
and lower back also had a high prevalence with
almost the same values of 23.8% and 23.9%
respectively. This was slightly different from Cho
and colleague’s research where the shoulder had the
highest prevalence of 73% followed by 71% neck
and upper back by 60% (Cho et al, 2012). The
characteristics of work mostly sat in front of a laptop
or computer, this was a very common thing if the
CESIT 2020 - International Conference on Culture Heritage, Education, Sustainable Tourism, and Innovation Technologies
342
position or placement of the monitor, keyboard,
mouse, and table was discomfort. Another
possibility that was the condition of the seat was not
in accordance with anthropometry’s size.
Table 3: Correlation test between demographic and
prevalence of musculoskeletal disorders (%).
Correlatio
nTest
Educatio
n
Gender
Age
Working
Experienc
e
N
ec
k
-0.052 -0.059 0.13 0.082
Shoulde
r
-0.03 -0.127 0.74 0.211*
Upper
b
ac
k
-0.114 -0.036 0.045 -0.027
Elbow
-0.107 -0.007 0.01 0.023
Lower
b
ac
k
-0.12 -0.054 0.05 0.054
Wrist 0.232* -0.203 -0.019 0.088
Hip
-0.041 -0.121 -0.019 0.088
Knee -0.005 -0.215* -0.068 0.023
Ankle -0.11 -0.243* -0.025 -0.091
Correlation test using Pearson between
demographic data and the prevalence of
musculoskeletal disorder showed a significant
correlation with p ≤ 0.05 (Table 3). The correlation
between work experience with shoulder pain was r
(87) = 0.211, education level with wrist pain with a
correlation r (87) = 0.232, and gender with pain in
the knee and ankle with a correlation value of r (87)
= -0.215 and r (87) = - 0.243 (Table 4). Others
attribute had a non-significant correlation. This was
in line with Darvishi’s research which concluded
that there was a significant correlation between
subjective workload assessment of marital status and
employee work experience (p <0.001) [4].
3.3 NASA-TLX Score
NASA-TLX rating showed that mental demand was
a greatly factor influencing worker’s workload.
Mostly, employees gave a rating of 84.05 out of 100
on mental demand. The smallest workload was
physical demand with a rating of 21.67. The
physical demand rating was very small because the
employees felt comfortable while sitting at the
computer without doing heavy physical activity.
Other dimensions such as performance, temporal
demand, effort, and frustration have almost the same
range of values, namely between range 59.44 and
69.50. The results of this study suggested that
mental demand had the greatest influence on the
assessment of the mental workload of IT workers.
This was different from the findings obtained by
Darvishi and colleagues where the parameter effort
had the highest weighting value 72.8% (Darvishi et
al, 2016) This could happen because of the different
job characteristics of Bank employees and IT
employees. Weight values are calculated based on
participant answers about which dimensions are the
more influential increasing mental workload. The
overall rating of subjective mental demand can be
calculated by entering the weight into the rating. The
result is concluded that the average employee felt a
subjective mental workload with rating reached 69.5
(SD=10.24). This value showed that the mental
workload of employees on a rather high scale (30-
49) is experienced by 2 people, high (50-79) is
experienced by 68 people and very high ≥80 by 17
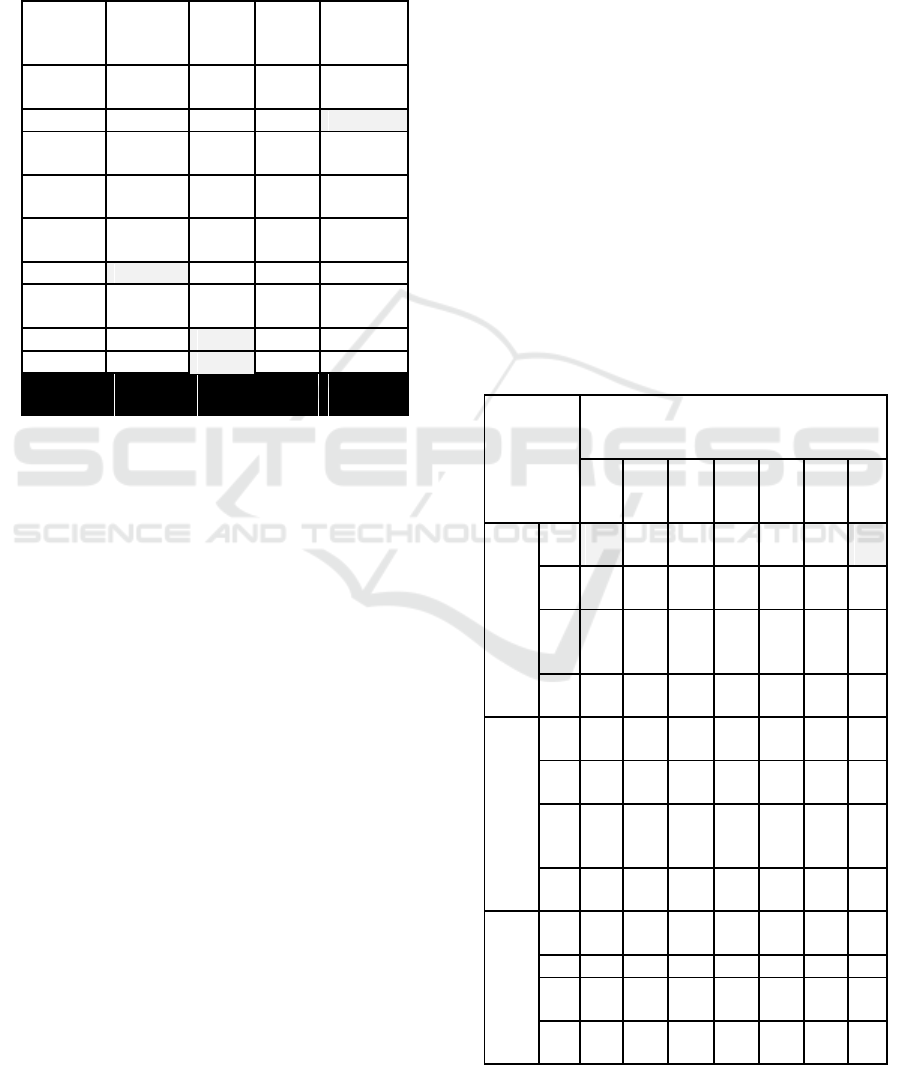
people. Table 4 shows complete information about
the assessment of the mental workload using NASA-
TLX.
Table 4: NASA-TLX score.
Statistics
Scale
s
MD PD P TD E Fr O
Rating
M
84.
05
21.67 69.03 66.71 59.44 67.09
69
.5
SD
11.56 17.9 18.62 15.64 21.65 12.54 10.2
Min
52 2 22 18 12 34 42.7
Max
98 77 99 88 98 97 88.8
Weigh
t
M
0.20 0.02 0.21 0.21 0.15 0.20
-
SD
0.08 0.05 0.08 0.09 0.12 0.08
-
Min
0.07 0 0 0 0 0
-
Max
0.33 0.27 0.33 0.33 0.33 0.33
-
Tall
y
M
3.03 0.32 3.10 3.18 2.32 3.03
-
SD
1.16 0.80 1.26 1.29 1.75 1.20
-
Min
1 0 0 0 0 0
-
Max
5 4 5 5 5 5
-
Analysis of Mental Workload and Musculoskeletal Disorders among IT Workers
343
3.4 Correlation Test between SMWL
and Musculoskeletal Disorders
Correlation test is conducted using Pearson product-
moment to investigate the relationship between
subjective mental workload and prevalence of
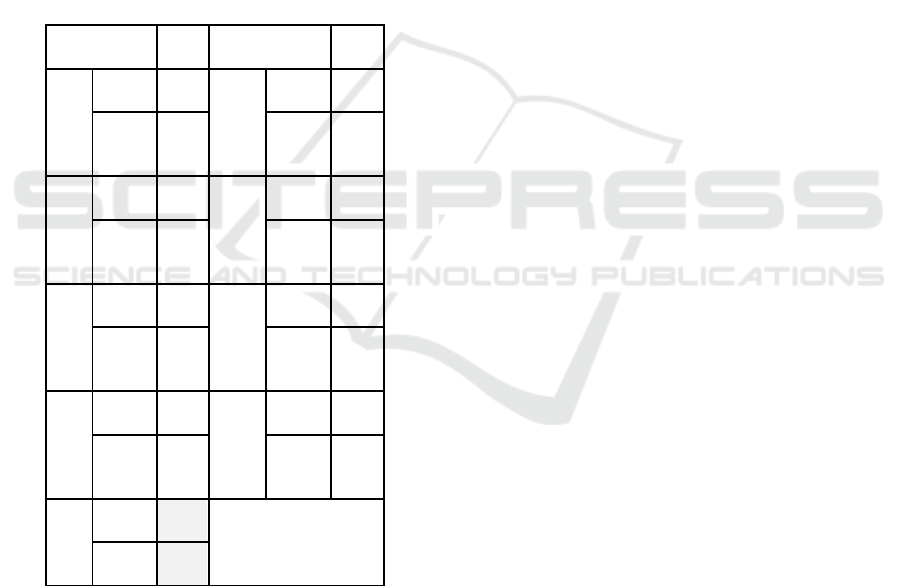
musculoskeletal disorders. Table 5 shows that there
was a significant correlation between the Subjective
Mental Workload (SMWL) score and the prevalence
of lower back pain with r(87)= 0.216 (p <0.05).This
result explained that complaints on the lower back
can represent 21.6% of the subjective mental
workload. The eight other body parts did not show a
significant correlation, it was possible because the
working experience of the employees was still
relatively short with an average of 1.2 years.
Table 2: Correlation test between SMWL and prevalence
of musculoskeletal disorder.
Correlation
Test
SMW
L
Correlation
Test
SMW
L
N
ec
k
Pearson
0.109
Wrist
Pearson
Co
r
0.015Co
r
Sig (2
0.315 Sig (2
tailed) 0.889
tailed)
Shoul
de
r
Pearson
0.123
Hi
p
Pearson
Co
r
0.07Co
r
Sig (2
0.255
Sig (2
tailed
)
0.518tailed
)
Uppe
r
Bac
k
Pearson
0.068
Knee
Pearson
-0.038Co
r
Co
r
Sig (2
0.534 Sig (2
tailed
)
0.728tailed
)
Elbo
w
Pearson
0.084
Ankle
Pearson
-0.105
Co
r
Co
r
Sig (2
0.44 Sig (2
tailed
)
0.335tailed
)
Lowe
r
Bac
k
Pearson
Co
r
0.216*
Sig (2
tailed
)
0.045
3.5 Ergonomic Design for Office
Workstation
The issue of musculoskeletal disorders and mental
workload among office workers are important to
investigate. Office workstation design should match
with the user-centered requirements or ergonomics
principles to reduce the negative effect of
discomfort, for example, design of space and
furniture need to be associated with specific tasks
and anthropometry’s size (Kroemer and Kroemer,
2017). IT workers had been struggling with some
degree of pain and discomfort especially at neck
(Based on NMQ’s results, neck had the highest
prevalence of disorders with 35.2%). According to
Kroemer and Kroemer (2017), there were several
activities that workers must do to solve this problem.
Firstly, IT workers must avoid sitting over long
periods of time and take 30 minutes of break
(standing, walking and stretching). Secondly,
employees need to change their body position often
to avoid continued compression of tissue, especially
at spinal and muscular fatigue. Finally, workers need
to improve their body movement and posture, for
instance, their trunk, neck, and head erect with only
slight bending, hands-on keyboard and eyes position
on PC/laptop’s screen ((Kroemer and Kroemer,
2017)). Not only workstation components like
computers, furniture, and environment but also other
factor-like job tasks, social activities and the
organizational task should fit IT workers to support
her or his job.
4 CONCLUSIONS
Musculoskeletal disorders and high mental workload
were common problems impact discomfort and
stress among IT workers. This study demonstrated
that almost all IT workers have experienced
complaints at least in one part of the musculoskeletal
body. The greatest prevalence is experienced in the
neck, shoulders, upper back and lower back reached
35%. Complaints in this section are thought to be
due to the characteristics of work that sit more at the
computer and do work that requires high mental
activity so that the body parts are exposed to
unnatural postures. The subjective mental workload
felt by employees is at a rather high to a very high
interval, reached 84% of the score which indicated
the need for re-analysis of the workload received by
employees. The relationship between the value of
the total subjective mental workload and
musculoskeletal disorders can be seen from
CESIT 2020 - International Conference on Culture Heritage, Education, Sustainable Tourism, and Innovation Technologies
344

complaints on the lower back. This research
provides evidence of a link between musculoskeletal
disorder and mental workload. The prevalence of
musculoskeletal disorders at lower back had a
significant correlation with the employee’s mental
workload.
ACKNOWLEDGEMENTS
The author wishes to express their gratitude to
Center for Ergonomic at Department of Industrial
Engineering Universitas Katolik Parahyangan and
Department of Industrial Engineering Institut
Teknologi Bandung.
REFERENCES
Kemenperin-Ministry of Industry Indonesia, “Growth
10 Percent,Millennials generation encourage digital
industry in Indonesia,” Download from
http://www.kemenperin.go.id/artikel/18581/Tumbuh-
10-Persen,-Generasi-Milineal-Dongkrak-Industri-
Digital (22 July 2019).
Sharan, D., Parijat, P., Shasidaran, A.P., et.al., 2011.
Workstyle risk factor for work related musculoskeletal
symptoms among computer professionals in Indian,"
Journal of Occupational Rehabilitation, 21 (4), pp.
520-525.
Mehta, R.K., and Parijat, P., 2012. Associations between
psychosocial risk factors and musculoskeletal
disorders: application to IT profession in India,”
Work. 41, pp. 2438-2444.
Darvishi, E., Maleki, A., Giahi, O., Akbarzadeh, A., 2016.
Subjective mental workload and its correlation with
musculoskeletal disorders in bank staff,” Journal of
manipulative and physiological therapeutics. 39(6),pp.
420-426.
Cho, C., Hwang. Y., Chen, R., 2012. Musculoskeletal
disorder among office workers with high workload
computer use,” Journal of Manipulative Physiology
Therapeutic. 35(7), pp. 534-540.
Jaafari, R., Halvani. G.H., 2012. Assessment of
musculoskeletal disorders Bank staff in the city of
Yazd,” Occupational Medical Q Journal, 3, pp. 1-7.
Kuorinka, I., Jonsson, B., Kilbom, A., Vinterberg, H., et.al
1987. Standardised Nordic questionnaire for analysis
of musculoskeletal symptoms.” Applied Ergonomic,
18 (3), pp. 233-237.
Toomingas, A., Mathiassen, S.E., Tornqist, E.W., 2012.
Occupational Physiology,” CRC Press Taylor and
Francis Group University of Gavle: Sweden, 209-210.
Rubio, S., Diaz, E., Martin, J., Puente, J.M.,2004.
Evaluations of subjective mental workload comparison
SWAT, NASA-TLX, workload profile methods,”
Journal of Applied psychology. 53(1), pp. 61-86.
Hart, S.G., Staveland, L.E., 1988. Development of NASA-
TLX (Task load index): result of empirical and
theoretical research,” Human mental workload. pp.
139-183.
Ning, X., Hwang, Y., Hu, B., Nimbarte, A.D., 2015. Neck
kinematics and muscle activity during mobile device
operations,” International Journal of Industrial
Ergonomics. 48, pp. 10-15.
Collet, C., Averty, P., Dittmar. A., 2009. Autonomic
nervous system and subjective ratings of strain in air-
traffic control, Applied Ergonomics. 40, pp. 23-32.
Reuter, E., Camba, J. D., 2017. Understanding emergency
workers' behavior and perspectives on design and
safety in the workplace,” Applied Ergonomics. 59, pp.
73-83.
Darvishi, E., Khotanlou, H., Khoubi, J., Giahi O., and
Mahdavi, N., 2017. Prediction effects of personal,
psychosocial, and occupational risk factors on low
back pain severity using artificial neural networks
approach in industrial workers,” Journal of
manipulative and physiological therapeutics. 40 (7),
pp. 47-54.
Yan, S., Tran, C.C., Chen, Y., Tan, K., and Habiyaremye,
J. L.,2017. Effect of user interface layout on the
operators’ mental workload in emergency operating
procedures in nuclear power plants,” Nuclear
Engineering and Design. 322, pp. 266–276.
Perhimpunan Ergonomi Indonesia or Indonesian
Ergonomic Society, (Instrument of Musculoskeletal
disorders assessment Indonesian version) Download
from www.pei.or.id/images/dokumen/instrumen-
survei-keluhan.pdf (22 July 2019).
Kroemer, K.H.E., Kroemer, A.D., 2017. S Office
ergonomics ease and efficiency at work. Second
edition. CRC Press Tailor and Francis Group. pp 110-
119.
Analysis of Mental Workload and Musculoskeletal Disorders among IT Workers
345
