
iBlurDetect: Image Blur Detection Techniques Assessment and
Evaluation Study
Roxanne A. Pagaduan, Ma. Christina R. Aragon and Ruji P. Medina
Technological Institute of the Philippines, Information Technology Department Quezon City, Philippines
Keywords: computer vision, image processing, blur detection, blur measure operators, blur identification.
Abstract: The quality of images is essential in computer vision, image processing, and other related fields. Image
restoration is one of the categories in image processing, where the quality of an image plays a vital role in
the process. Blur detection is a pre-processing stage in image restoration. Using different blur detection
techniques, the quality of an image can identify if blurry or not. This study aims to provide a comparative
performance of the available state-of-the-art blur measure operators or blur detection techniques. Python 6.3
was used for testing and evaluating the blur detection techniques. Providing the confusion matrix, precision,
recall, f-measure, accuracy, and execution time were used to compare blur detection techniques. In testing,
the Gaussian kernel and threshold value were set to measure the performance of each technique. Provided
on the evaluation results, in terms of accuracy rate, HWT leads the best result. Based on the computed
scores, FFT got the highest precision score, while LAP got the highest recall score, and HWT got the
highest f-measure score. In terms of the execution time, MLAP performs the fastest processing time among
them all. Likewise, results of this study can use as resources before performing the image restoration.
1 INTRODUCTION
Image perform a significant role in technology as
well as in the research domain. These images can
applied in computer vision and image processing
such as image representation (Cruz-Roa et al, 2013),
object recognition and matching (Yadav and Singh,
2016), 3D scene reconstruction (Yang, Zhou and
Bai, 2013; Fang, Tao and Jia-Lin, 2017), and motion
tracking (Chen and Liu, 2018; Ancheta et al, 2018)
to name a few. Images are produced to record or
display important information.
The quality of an image contributes to the
success of determining certain information that can
used in different fields of research. In feature
detection, for example, the recognition rate depends
on the image quality(Dharavath et al, 2014).
Image quality can be degraded due to distortion
during acquisition and processing. Some common
factors may affect the quality of an image are
contrast, noise, artifacts, and blurring (Su, Lu, and
Tan, 2018). To address this issue, image recognition
techniques are continuously being performed and
improved (Sprawls, 1995).
Image blurring is a form of bandwidth reduction
on an ideal image caused by an imperfect image
construction procedure(Bovik and Gibson, 2000).
Blur is the typical image downfall problem when
capturing the photos. Image blur occurs in most
cases of image deterioration resulting from
defocusing or handshaking (Yang, Lin and Chuang,
2017).The reasons behind the output of blurry
images are camera shaking due to dynamic
movement of the lens during the process of capture,
object movement, out-of-focus due to camera lens
could not set a proper angle and focus, out-of-focus,
and low-quality cameras (Dharavath et al, 2014) and
(Su, Lu, and Tan, 2018).
Since image blur is a common issue, and it is, at
times difficult to remove in many situations. Due to
this problem, many researchers are working on
finding the best way to de-blur the image and restore
the blurred image (Bansal et al, 2017; Huang et al,
2019). Study (Bansal et al, 2017) stated that to
maintain the quality of the image it is vital to detect
and eliminate the blur from images.
Image processing techniques can use in the
modificationof digital data for refining the image
qualities with the aid of a computer system (Bansal
et al, 2017).
286
Pagaduan, R., R. Aragon, M. and Medina, R.
iBlurDetect: Image Blur Detection Techniques Assessment and Evaluation Study.
DOI: 10.5220/0010307700003051
In Proceedings of the International Conference on Culture Heritage, Education, Sustainable Tourism, and Innovation Technologies (CESIT 2020), pages 286-291
ISBN: 978-989-758-501-2
Copyright
c
2022 by SCITEPRESS – Science and Technology Publications, Lda. All rights reserved
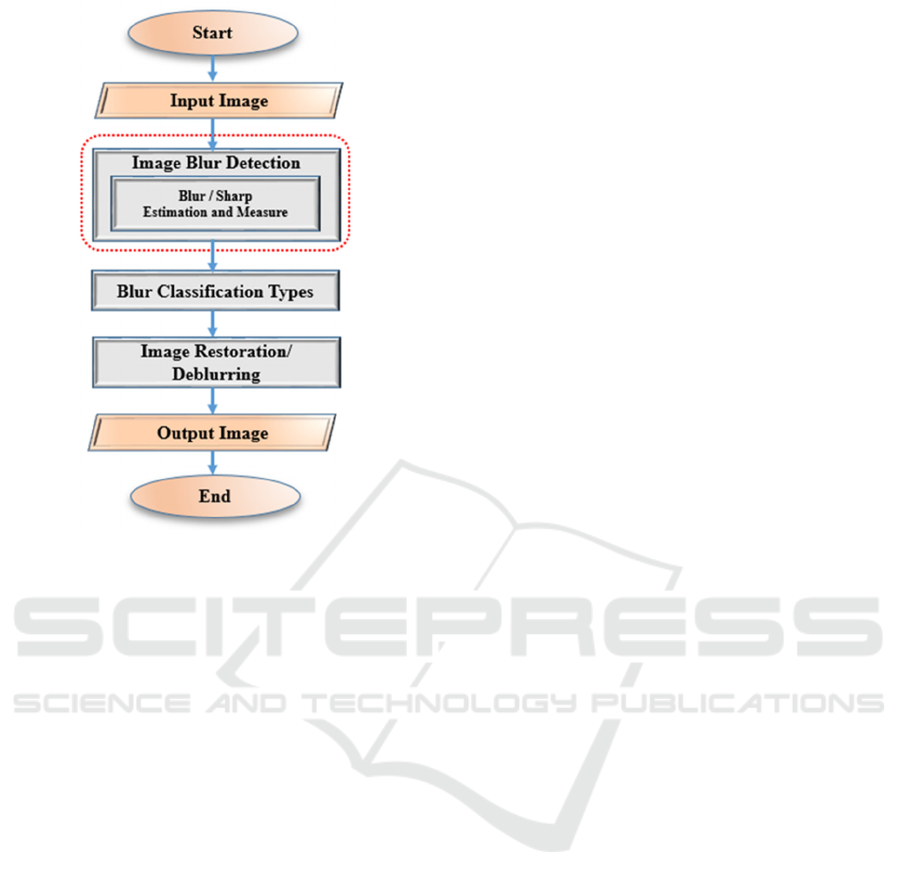
Figure 1: Flowchart of Image Blur Detection Framework.
Figure 1 shows the flowchart of image blur
detection framework. The study of (Koik and
Ibrahim, 2014), narrow down the researches
available in public domain about blur images into
three major processes: a) image blur detection, the
initial process in improving the quality of the image
that suffers from blur, b) blur classification, the
second process of the research related to blur
images. The goal of this process is to classify the
blur areas according to their characteristics or types,
and 3) image restoration, the third process, perform
deblurring process based on their characteristics.
This paper concentrates only on the stage of image
blur detection that consider the blur/sharp estimation
and measure which is enclosed in red-dotted lines in
figure 1.
This paper focuses on the different blur detection
techniques and aims to compare the performance of
each one in terms of accuracy rate and execution
time. Also, compare and analyze the existing
techniques in identifying if the input image is
blurred or sharp to achieve the best possible results.
The project’s long term goal aims to maintain a
comparable number of extracted feature points with
a sharp image and to increase the number of
correctly matched feature points of inputted blur
image. The project groundwork lays on computer
vision, and image processing notably features point
detector. Blur detection techniques are useful in
image blur detection because it is used as the
preliminary process to detect specific regions that
need for image restoration or deblurring process. As
the primary step towards the goal of the project, we
conducted a review and analysis of the different blur
measure operators or state-of-the-art of image blur
detector techniques.
This paper has been organized as follows.
Section 2. Blur detection techniques. Section 3.
Experimental methodology. Section 4. Deals with
the results and discussions and the last Section is the
conclusion of the study.
2 BLUR DETECTION
TECHNIQUES
Blur detection is one of the interesting research areas
in computer vision and image processing like in
(Cruz-Roa et al, 2013; Yang, Zhou and Bai, 2013;
Fang, Tao and Jia-Lin, 2017), and (Ancheta et al,
2018). Most of the captured images usually contain
two types of regions: blurred and sharp. Blur can be
categorized into two types: a) defocus blur or also
known as out-of-focus blur, which is caused by the
visual imaging system and b) motion blur or also
known as camera-shake blur, which is caused by the
relative motion between camera and scene objects
(Ali and Mahmood, 2018).
Study (Pertuz et al, 2013), reviews 36 different
techniques or focus measure operators to compute
the blurriness metric of an image, some of them are
simple and straight forward using just grayscale
pixel intensity statistics, other are more advanced
and feature-based that evaluate the local binary
patterns of an image.
A total of 32 different blur measure operators
was reviews for single image blur segmentation in
(Ali and Mahmood, 2018). Some number of measure
operators reviews included are originally developed
for autofocus and shape from focus (SFF) techniques
by (Abdel-Qader et al, 2003).
While in (Bansal et al, 2017), reviews 3 different
blur detection techniques such as laplacian operator,
fast fourier transform, and haar wavelet transform.
In their study, Laplacian operator was selected for
testing and successfully identify if the image is
blurred or sharp.
In other literature, Tenengrad technique is used
to extract the degradation degree of each target part
in the image. Tenengrad technique was used in
(Gao, Han, and Cheng, 2018) as operator used to
evaluate the iris image’s definition.
iBlurDetect: Image Blur Detection Techniques Assessment and Evaluation Study
287
With the help of the related research papers
available in public domain, conducting about blur
detection techniques, we consider some related
image blur detection techniques in our study and test
the performance of each technique.
There are many image blur detection techniques
to detect whether an image is blurred or sharp. Some
of them are:
2.1 Fast Fourier Transform (FFT)
In Fourier transform, this method calculates the
frequencies in the image at different points and
based on the set level of frequencies it decides
whether the image is blurred or sharp. When there is
a low amount of frequency based on the set level of
frequencies then it declares that the image is blurred
otherwise, if the computed frequencies is high then
the image is sharp. The decision that will be the
value of low and high frequencies is based on the
programmer. (Pertuz et al, 2013).
2.2 HaarWavelet Transform (HWT)
In this method, the images are split into NxN by
iterating on each tile of the 2Dimensional HWT, and
grouping diagonally, vertically, or horizontally
connected tiles into clusters containing images are
then declared blurred (Tong, Li, Zhang, and Zhang,
2004).
2.3 Laplacian Operator (LAP)
This method is implemented to discover edges in a
picture. It is additionally a derivative operator but
the basic contrast between different operators like
Sobel, Kirsch and Laplacian operator is that all other
derivatives are first order derivative mask. Laplacian
operator is further separated into two classification
which are the positive Laplacian operator and
negative Laplacian operator.
2.4 Modified Laplacian (MLAP)
The modified laplacian is developed to compute
local measures of the quality of image focus. By
getting the absolute values of the second derivatives
in x and y directions (Pech-Pacheco et al, 2000).
2.5 Tenengrad (TEN)
The well-celebrated focus measure based on image
gradients obtained by the convolving the image with
sobel operator that can also be considered as blur
measure operator (Pech-Pacheco et al, 2000).
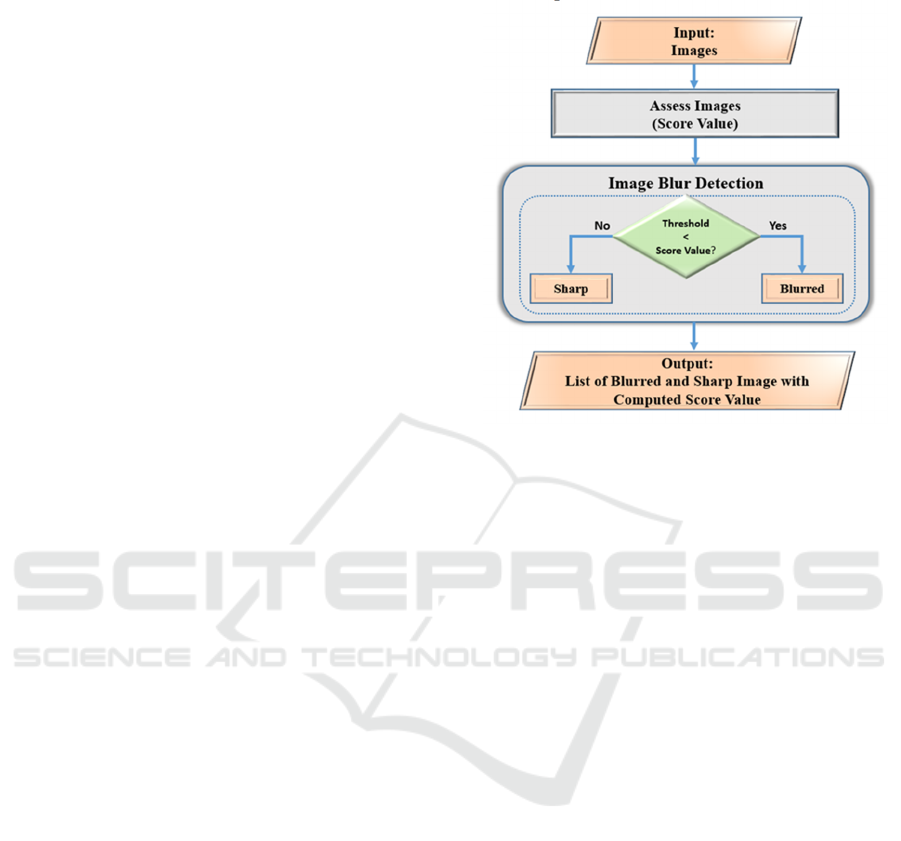
Figure 2: Flowchart of Image Blur Detection Techniques
Processes.
Figure 2 shows the processes performed by the
different blur detection techniques for testing. The
user should input the value for threshold and
Gaussian kernel for assessing and computing the
score values of the inputted image. Based on the set
threshold and Gaussian kernel, the calculated score
value will be the basis of the image input is blurred
or sharp.
3 EXPERIMENTAL
METHODOLOGY
In this section, we describe the methodology we
followed to perform a comparative analysis of image
blur detection techniques. This study was
programmed and tested in Python 3.6, using
notebook computer, which has Intel Core i7-8750H
CPU @ 2.20GHz and 8.0 GB RAM with the
Windows 10, 64bit operating system.
3.1 Dataset
To quantitatively evaluate the performance of the
different blur detection techniques, we randomly
selected 200 blur and sharp images from the dataset
provided in the study of [23]. The RGB image is 640
x 480 pixels. The blur images may have motion blur,
out-of-focus blur, and synthetic blur.
CESIT 2020 - International Conference on Culture Heritage, Education, Sustainable Tourism, and Innovation Technologies
288

Selecting proper threshold value totally depends
on the domain. If the selected threshold is too high
or too low then the images would be marked falsely,
for example, if an image is sharp and the threshold is
too high then the image will be marked blurry.
3.2 Evaluation Measures
Table 1 shows the confusion matrix model used to
evaluate the accuracy of the different blur detection
techniques.
Table 1: Confusion Matrix.
Predicted Value
Negative (N) Positive (P)
Actual
Value
Negative
(N)
True Negative
(TN)
False Positive
(FP)
Positive
(P)
False Negative
(FN)
True Positive
(TP)
where:
• Positive (P): Observation is positive (image is
blurred)
• Negative (N): Observation is not positive
(image is not blurred (sharp))
• True Positive (TP): Observation is positive,
and is predicted to be positive (image is
blurred and predicted as blurred)
• False Negative (FN): Observation is positive,
but is predicted as negative (image is blurred
and predicted as sharp)
• True Negative (TN): Observation is negative,
and is predicted to be negative (image is sharp
and is predicted to be sharp)
• False Positive (FP): Observation is negative,
but is predicted positive (image is sharp, but is
predicted as blurred)
This different blur detection techniques are
also measure based on the following criteria:
1) Precision: a measure of relevance between the
retrieved result and the observation. It refers
to the fraction of the detected blurred (sharp)
pixels which are actually blurred (sharp).
Precision, P =
(24)
Where 𝑇
means that the blurred (sharp) pixel
has been correctly detected as blurred (sharp) pixel
and 𝐹
expresses that a pixel has been inaccurately
detected as blurred (sharp) but it was sharp (blurred)
actually.
2) Recall: also called as sensitivity in binary
classification, it is a measure of the ability to
retrieve the relevant results. It depicts the
fraction of the actual blurred (sharp) pixels
which are detected.
Recall, R =
(25)
Where Fnnmeans that a pixel has been
inaccurately detected as sharp (blurred) but it was
blurred (sharp) actually.
3) F-measure: is a measure of a test’s accuracy
and is defined as the weighted harmonic mean
(average) of the precision and recall of the
test.
F-measure, F =2 x
(26)
4) Accuracy: the ratio between the number of
blurred (sharp) images correctly classified.
Accuracy, A =
(27)
5) Execution Time: total number of run-time
during the execution of images
These quantitative measures provide an
appropriate tool for analysis and evaluation of
dataset.
4 RESULTS AND DISCUSSIONS
In this section, we discussed the results conducted
during experimentation to be able to analyze the
comparative performance of the different image blur
detection techniques. Figure 3 shows a sample result
of blur image after using blur detection techniques.
While, figure 4 shows a sample result of sharp
image after using blur detection techniques when
evaluated and tested using Python 6.3. The Gaussian
kernel of all techniques was set to three (3) and set
the proper threshold value.
Figure 3: Result of BlurImages using Blur Detection
Techniques; Result of (a) Fast Fourier Transform; (b)
Laplacian Operator; (c) Modified Laplacian;
(d)Tenengrad; and (e) HaarWavelett Transform.
iBlurDetect: Image Blur Detection Techniques Assessment and Evaluation Study
289
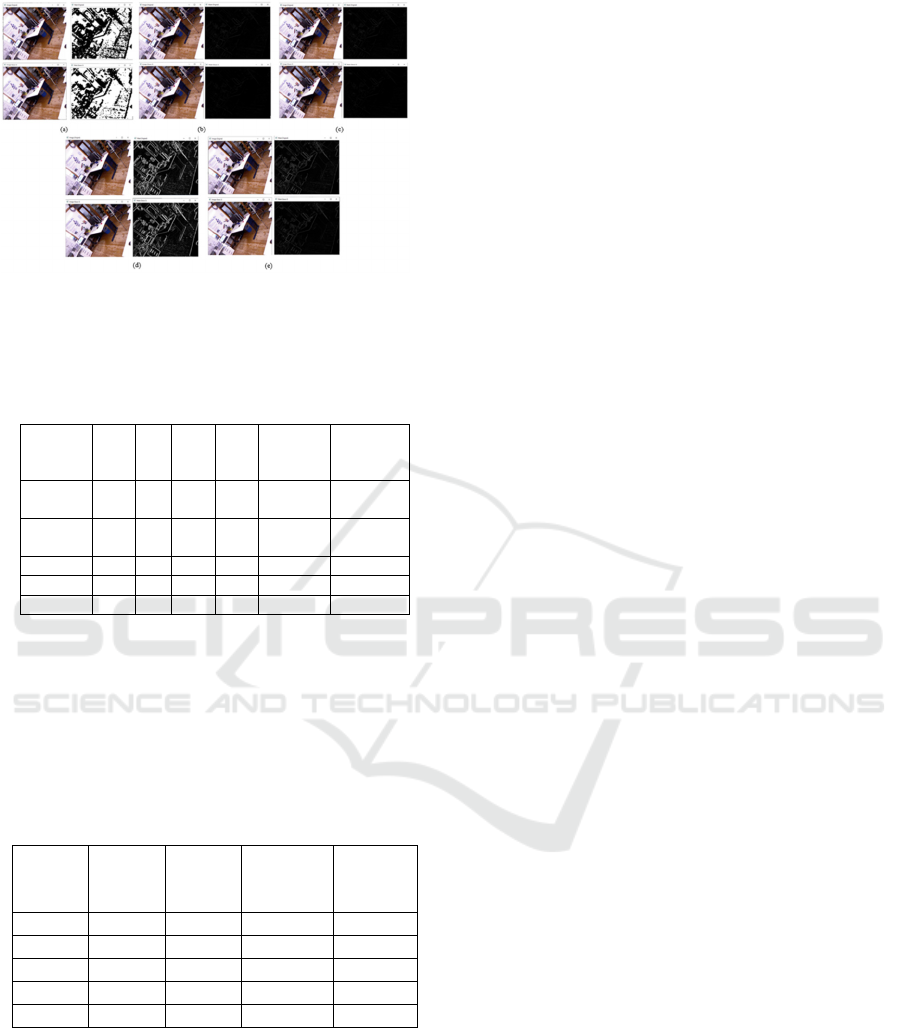
Figure 4 Result of Sharp Images using Blur Detection
Techniques; Result of (a) Fast Fourier Transform; (b)
Laplacian Operator; (c) Modified Laplacian;
(d)Tenengrad; and (e) HaarWavelett Transform.
Table 2: This caption has one line so it is centered.
Blur
Detecti
on
T
N
F
P
FN TP Accura
cy (%)
Total
Time
(sec)
FFT 10
0
0 13 87 93.5% 6.2001
LAP 73 2
7
2 98 85.5% 1.1482
MLAP 95 5 27 73 84% 0.8951
TEN 94 6 6 94 94% 5.6921
HWT 99 1 5 95 97% 6.0370
Table 2 shows the confusion matrix results of the
performance comparison of different blur detection
techniques. Provided the assessment results, in terms
of accuracy rate, HWT leads the best results follows
by TEN, FFT, LAP, and MLAP sequentially. In
terms of execution time, MLAP leads the best results
follows by LAP, TEN, HWT, and FFT sequentially.
Table 3: Comparison of Blur Detection Techniques.
Blur
Detecti
on
Precisio
n Score
(%)
Recall
Score
(%)
F-
Measure
Score (%)
Total
Time
(sec)
FFT 1.0 0.87 0.93048 6.2001
LAP 0.784 0.98 0.87111 1.1482
MLAP 0.9358 0.73 0.82022 0.8951
TEN 0.94 0.94 0.94 5.6921
HWT 0.9895 0.95 0.96938 6.0370
Table 3 shows the summary results of the
performance comparison of different blur detection
techniques. Provided the assessment results to
measure the scores are the precision score, recall
score, and F-measure score. Also, we considered the
total processing time (execution time) of each
technique. FFT got the highest precision score, while
LAP got the highest recall score, and HWT got the
highest f-measure score. In terms of execution time,
MLAP performs the fastest processing time.
5 CONCLUSIONS
The study aims to conduct comparative analysis
about the different image blur detection techniques.
Based on the results, in terms of accuracy rate, HWT
leads the best result. Based on the computed scores,
FFT got the highest precision score, while LAP got
the highest recall score, and HWT got the highest f-
measure score. In terms of execution time, MLAP
performs the fastest processing time among them all.
The next stage, as part of our long term project
goal, we planned to conduct a comparative analysis
of the different image restoration or deblurring
techniques that can be used in our long term goal.
REFERENCES
Cruz-Roa, A.A., Arevalo Ovalle, J. E., Madabhushi,, A.,
González Osorio, F. A., 2013 A deep learning
architecture for image representation, visual
interpretability and automated basal-cell carcinoma
cancer detection,” in Lecture Notes in Computer
Science (including subseries Lecture Notes in
Artificial Intelligence and Lecture Notes in
Bioinformatics).
Yadav, S., Singh, A., 2016. An image matching and object
recognition system using webcam robot,” in 2016 4th
International Conference on Parallel, Distributed and
Grid Computing, PDGC 2016.
Yang, C., Zhou, F., Bai, X., 2013. 3D Reconstruction
through Measure Based Image Selection, 2013 Ninth
International Conference on Computational
Intelligence and Security, Leshan.
Fang, L., Tao, J., Jia-Lin, G., 2017. Analysis of 3D
Reconstruction of Large-Scale Architectural Scene
Based on Virtual Reality, 2017 International
Conference on Computer Systems, Electronics and
Control (ICCSEC), Dalian.
Chen, G., Liu, Y., 2018. The study on motion message of
rotational motion with eye tracking, 2018 IEEE
International Conference on Applied System Invention
(ICASI), Chiba.
Ancheta, R. A., Reyes, F. C., Caliwag, J. A., Castillo, R.
E., 2018.FEDSecurity: Implementation of computer
vision thru face and eye detection, Int. J. Mach. Learn.
Comput.
Dharavath Amarnath, G., Talukdar, F. A., Laskar, R. H.,
2013. Impact of image preprocessing on face
recognition: A comparative analysis, in International
Conference on Communication and Signal Processing,
ICCSP 2014 - Proceedings.
CESIT 2020 - International Conference on Culture Heritage, Education, Sustainable Tourism, and Innovation Technologies
290

Su, B., Lu, S., Tan, C. L., 2011. Blurred image region
detection and classification, in MM’11 - Proceedings
of the 2011 ACM Multimedia Conference and Co-
Located Workshops.
Sprawls, P, 1995. Physical principles of medical imaging.
Bovik, A., Gibson, J., 2000. Handbook of Image and
Video Processing, Academic Press, Inc. Orlando, FL,
USA.
Yang, F., Lin, H. J., Chuang, H., 2017. Image deblurring,
2017 IEEE SmartWorld, Ubiquitous Intelligence &
Computing, Advanced & Trusted Computed, Scalable
Computing & Communications, Cloud & Big Data
Computing, Internet of People and Smart City
Innovation(SmartWorld/SCALCOM/UIC/ATC/CBDC
om/IOP/SCI), San Francisco, CA.
Bansal, R., Raj, G., Choudhury T., 2017. Blur image
detection using Laplacian operator and Open-CV,
Proc. 5th Int. Conf. Syst. Model. Adv. Res. Trends,
SMART 2016, pp. 63–67.
Huang, R., Fan, M., Xing, Y., Zou, Y., 2019. Image Blur
Classification and Unintentional Blur Removal, IEEE
Access.
Koik, B. T., Ibrahim, H., 2014. A literature survey on blur
detection algorithms for digital imaging, Proc. - 1st
Int. Conf. Artif. Intell. Model. Simulation, AIMS
2013, pp. 272–277.
Ali, U., Mahmood, M. T., 2018. Analysis of Blur Measure
Operators for Single Image Blur Segmentation.
Pertuz, S., Puig, D., Garcia, M. A., 2013. Analysis of
focus measure operators for shape-from-focus, Pattern
Recognit., vol. 46, no. 5, pp. 1415–1432.
Abdel-Qader, I., Abudayyeh, O., Kelly, M. E., 2003.
Analysis of edge-detection techniques for crack
identification in bridges, J. Comput. Civ. Eng.
Gao, S., Han, M., Cheng, X., 2018. The fast iris image
clarity evaluation based on Tenengrad and ROI
selection.
Tong, H., Li, M., Zhang, H., Zhang, C., 2004. Blur
detection for digital images using wavelet transform,
in 2004 IEEE International Conference on Multimedia
and Expo (ICME).
Pech-Pacheco, P. L., Cristöbal, G., Chamorro-Martínez, J.,
Fernândez-Valdivia, J., 2000. Diatom autofocusing in
brightfield microscopy: A comparative study, Proc. -
Int. Conf. Pattern Recognit.
Liu, Y., Zhang, H., Guo, H., Xiong, N. N., 2018. A FAST-
BRISK feature detector with depth information,
Sensors (Switzerland).
Lin, J., Ji, X., Xu, W., Dai, Q., 2013. Absolute depth
estimation from a single defocused image, IEEE
Trans. Image Process.
Tang, C., Hou, C., Song, Z., 2013. Defocus map
estimation from a single image via spectrum contrast,
Opt. Lett.
Chen, D. J., Chen, H. T., Chang, L. W., 2016. Fast defocus
map estimation, in Proceedings - International
Conference on Image Processing, ICIP.
iBlurDetect: Image Blur Detection Techniques Assessment and Evaluation Study
291
