
Development Strategy for the Master Plan of Maize Commodities
Supply Chain Network Infrastructure in Madura, Indonesia
Abdul Azis Jakfar
1
, Muhammad Syarif
2
, Rachmad Hidayat
3
, Sabarudin Akhmad
4
, Kukuh Winarso
3
,
and Anis Arendra
4
1
Departement of Agro-industrial Technology, Faculty of Agriculture,, University of Trunojoyo Madura, Indonesia
2
Departement of Management, Faculty of Economics and Business,, University of Trunojoyo Madura, Indonesia
3
Industrial Engineering Departement, University of Trunojoyo Madura, Indonesia
4
Mechanical Engineering Departement, University of Trunojoyo Madura, Indonesia
kukuhutm@gmail.com, anis.arendra@trunojoyo.ac.id
Keywords: Food Supply Chain Network, Greenfield Analysis Method, Maize Farmer.
Abstract: The problems faced by maize farmers in Madura are (1) Poor handling of maize post-harvest; (2)
Transportation operating costs are expensive; (3) Delay in delivery time. All of these problems can be resolved
using the Food Supply Chain Network (FSCN) method. Therefore, it is necessary to develop the FSCN model
for maize harvest in Madura. Supply chain performance is measured to determine how optimal marketing
activities are carried out by members of the supply chain. The Food Supply Chain Network consists of four
elements, which include Network Structure, Chain Business Processes, Chain Management and Chain
Resources. This study aims to develop the distribution model for the maize supply chain in Madura, East-Java
using the FSCN framework, developing the performance model for the maize supply chain network in
Madura. The results can be used as a recommendation to develop an optimal maize supply chain master plan
in Madura. The development of a maize supply chain model can be assessed using the FSCN framework
which consists of supply chain targets, supply chain structures, supply chain management, supply chain
resources, supply chain business processes, and supply chain performance. Meanwhile, the optimization
model is solved using the Greenfield Analysis method.
1 INTRODUCTION
The logistics of the food supply chain plays an
important role in the continuity of business
performance in the food sector. After several periods,
the food business sector prioritizing responsiveness,
they now experience vulnerability to supply chain
threats (Bloemhof et al., 2015). The food supply chain
network is a framework and tool for the food sector
to take steps to change its operational practices. The
food supply chain network provides a clear and
concise overview of the current state of performance
indicators for the food sector in corporate
sustainability strategies, supply chain reformulation
strategies currently applied in practice for continuous
improvement(Sembiring Meliala et al., 2019).
The food product industry still focuses on delivery
time to consumers, high quality products and low
production costs(Banasik et al., 2017). In order to
remain competitive, FSCN is expected to be able to
adopt new technologies that can improve the
performance of food product companies.
Performance improvement can be started with a
quantitative assessment of economic, selection of
alternative technologies, production options, and
environmental benefits(Ferreira and Arantes, 2015).
Meanwhile, the adoption of new technology is
expected to increase performance levels and facilitate
managerial decision making.
The agribusiness sector plays an important role in
the national economy, being one of the main
contributors to Gross Domestic Product (GDP) in
many developing countries including Indonesia, even
the share contribution of this sector in GDP reaches
as much as 50%(Wajszczuk, 2016). In contrast to the
other economic sectors, apart from the need for
efficient logistics, food distribution must ensure safe
delivery of food to end consumers(Akhmad et al.,
2019). In addition, the transportation of food
products, especially agricultural products, requires
Jakfar, A., Syarif, M., Hidayat, R., Akhmad, S., Winarso, K. and Arendra, A.
Development Strategy for the Master Plan of Maize Commodities Supply Chain Network Infrastructure in Madura, Indonesia.
DOI: 10.5220/0010307600003051
In Proceedings of the International Conference on Culture Heritage, Education, Sustainable Tourism, and Innovation Technologies (CESIT 2020), pages 277-285
ISBN: 978-989-758-501-2
Copyright
c
2022 by SCITEPRESS – Science and Technology Publications, Lda. All r ights reserved
277
the application of a special logistics infrastructure. To
overcome this problem, it is necessary to develop a
distribution system or special logistics for maize crop
commodity. This distribution network system is
commonly called the Food Supply Chain Network. It
is hoped that the Food Supply Chain Network
specifically for maize crop can increase National
Gross Domestic Product.
2 ACTUAL CONDITIONS OF
MAIZE FARMING IN MADURA
An initial survey of maize farming in Madura
revealed that maize farmers in Madura had several
problems: Harvested maize cannot be sold to the
maize processing mill because it does not meet the
requirements for the quality of moisture content and
levels of afla toxin. The feed processing mill also
demands sustainable large quantities while maize
production in Madura is only twice a year. Other
problems faced by maize farmers in Madura are (1)
Low human resource or farmer skills; (2) Low quality
of maize seeds; (2) Low productivity; (3) The
quantity of maize shipments not as expected; (4)
Inadequate agricultural equipment; (5) Poor handling
of maize post-harvest; (6) Transportation operating
costs are expensive; (7) Unclear payment system (8)
Delay in delivery.
The description above indicates the maize supply
chain operation in Madura was poor. It is necessary
to improve the supply chain in its implementation so
that the marketing supply chain is more optimal in
delivering products from producers to
consumers(Dellino et al., 2015), as well as consumers
more easily to get products from producers. Madurese
maize must have high competitiveness in order to
compete with imported maize. Competitiveness is
influenced by the effectiveness and efficiency of
supply chain performance(Berti and Mulligan, 2016).
So it can be concluded that the supply chain plays an
important role in winning the market competition for
agricultural products(Akhmad et al., 2020) and
(Winarso and Rohim, 2019). To win market
competition, it is necessary to optimize distribution
channels in the supply chain and added value to
institutions related to corn marketing. Therefore,
research on the development strategy of a Food
Supply Chain Network Model for optimizing Madura
maize distribution channels by using the
metaheuristic method is necessary.
3 RESEARCH PROBLEMS AND
THE OBJECTIVES
The problems faced in developing the Madura maize
business are as follows: (a) How is the mid-range
master plan for the Madura maize business? (b) How
to prepare supporting facilities, especially facilities
for the distribution of maize, from farmers to
consumers?
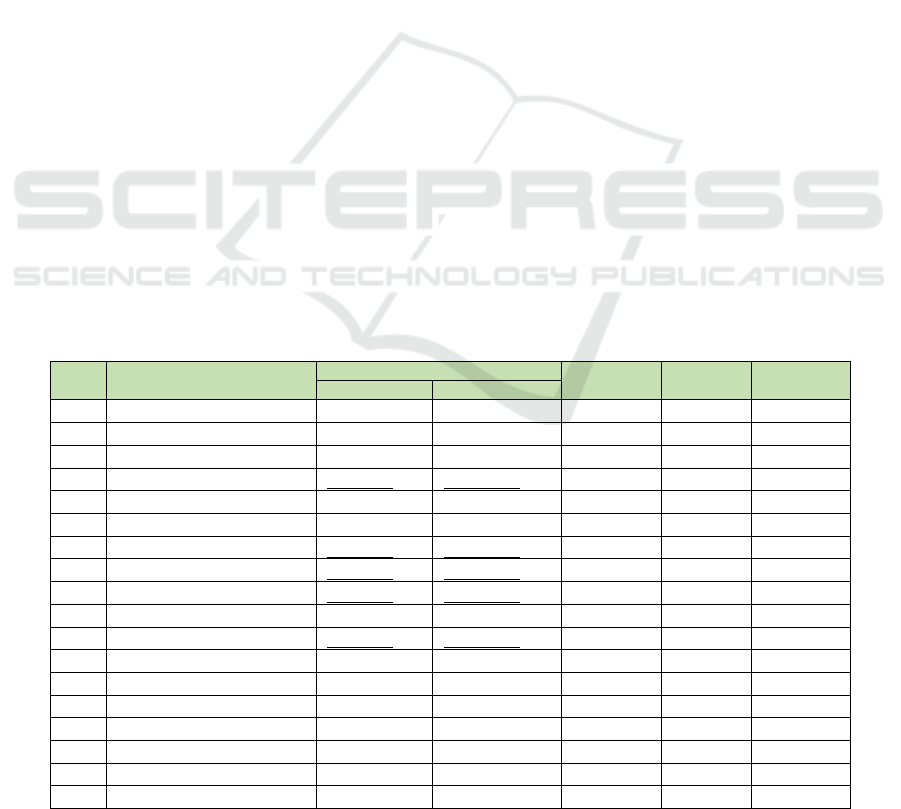
Table 1: The farmer’s location data snippets.
No
Farmer
Coordinate Village Sub-
District
District
Latitude Longitude
1
Tunas Muda -6.951992 112.847800
Arosbaya Arosbaya Bangkalan
2
Renggujeng Tani
-6.949366 112.837712
Arosbaya Arosbaya Bangkalan
3
Omber Ramah Luhur Manis
-6.979578 112.831809
Balung Arosbaya Bangkalan
4
Makmur I -7.003364
112.848950
Batonaong Arosbaya Bangkalan
5
Makmur II -7.007311 112.854367
Batonaong Arosbaya Bangkalan
6
Makmur III -7.015500 112.856059
Batonaong Arosbaya Bangkalan
7
Makmur IV -7.000672
112.847046
Batonaong Arosbaya Bangkalan
8
Tani Sejahtera
-7.003527
112.858652
Batonaong Arosbaya Bangkalan
9
Gerbung -7.005282
112.851820
Batonaong Arosbaya Bangkalan
10
Berbeluk Timu
r
-6.964212 112.852019
Berbeluk Arosbaya Bangkalan
11
Pancor Emas -6.957035
112.863154
Berbeluk Arosbaya Bangkalan
… … … … … … …
… … … … … … …
… … … … … … …
1628
Cinta Damai Nonggunong -7.116775 113.886881
Tanjung Pragaan Sumenep
1629
Indah Jaya Tanjung -7.126045 113.890709
Tanjung Pragaan Sumenep
1630
Sekar Wangi Tanjung -7.128898 113.890878
Tanjung Pragaan Sumenep
1631
Karya Usaha Nonggunong -7.120453 113.882070
Tanjung Pragaan Sumenep
CESIT 2020 - International Conference on Culture Heritage, Education, Sustainable Tourism, and Innovation Technologies
278

The general objectives of this study are to prepare
a master plan for the Madura maize business 2020-
2030, while the specific objectives are: (1) Develop a
Madura maize Supply Chain Network model. (2)
Determine the location of the Aggregation warehouse
in the Madura maize distribution line. (3) Determine
the minimum distribution channel for Madura maize.
4 RELATED WORK
Supply Chain Management (SCM) has been part of
the corporate management agenda since the 1990s,
especially in the retail industries and
manufacturing(Chopra and Meindl, 2013). More
recently, interest in SCM has also grown in the agri-
food industry, in developed and developing
countries(Bustos et al., 2017). Bloemhof et al., (2015)
and Banasik et al., (2017) state that agrifood company
executives realize that the successful coordination,
integration, and management of key business
processes in the supply chain network will determine
the success of their market competitiveness.
Sustainable Food Supply Chain Management
(SFSCM) refers to all forward processes in the food
chain, such as material procurement, production and
distribution, as well as reverse processes for
collecting and reprocessing used and unused
products.
Parallel or sequential processes can occur
simultaneously in the food supply chain so that more
than one business process in the food supply chain
network can be identified(Cruz and Rosado da Cruz,
2019). For example, the business process of maize for
animal feed is channeled from farmers to various
parties such as middleman traders and then forwarded
to the final consumer. In the flow process, the supply
chain members involved carry out the business
process as needed. Suppose a middleman trader
carries out a different process with regard to maize
being sent to the livestock industry and maize to be
sent to the food industry.
The diversity of supply chain structures can be
analyzed qualitatively, including in analyzing the
resulting performance. Qualitative supply chain
performance analysis needs to be supported by
quantitative performance measures in order to
produce more measurable and objective performance
results. As an integrated process between members
who are joined, supply chain performance
measurement needs to use a certain approach. Supply
chain performance is defined as the break event point
between consumers and stakeholders where both
requirements have been met with the relevance of the
attributes of performance indicators over time.
Increasing the added value of primary agricultural
commodities is one step in order to increase farmers'
income, especially in rural areas(Desiana and
Aprianingsih, 2018).
A supply chain that is incorporated in a complex
network is called the Food Supply Chain Network. To
analyze a complex supply chain, a term that can
describe the supply chain, the parties involved, the
process, the product, the resources, management, the
relationship between attributes and other things is
defined. Network and chain management is the
coordination of the network management structure
that facilitates related institutions in the supply chain
to make decisions using chain resources so that the
objectives of FSCN can be achieved(Taghikhah et al.,
2020).
Asmarantaka et al., (2018) stated that the
characteristics of agricultural products are broadly
large volume, take up large space, and perishable. It
can be concluded that the characteristics of
agricultural supply chains in particular are: perishable
products; short shelf life of products; production
depending on the season, harvest and famine; long
production time; need storage handlers; the quality
and quantity of production is affected by weather and
season, plant diseases and pests; and consumer
demand for food safety(Xue et al., 2019).
Characteristics like these need special handling in
Supply Chain Management (Dou et al., 2020).
5 RESEARCH METHODS
Supply chain management for agricultural products
represents the management of the entire production
process from plantation, processing activities, to
distribution, marketing, until the desired product
reaches consumers. Agricultural supply chain
management is different, more complex, probalistic
and dynamic compared to non-agricultural supply
chain management. The differences are in the
characteristics of perishable agricultural products and
varying product sizes, production processes that
depend on seasons and climate, and changes in
consumer behavior towards food safety.
As a description of the supply chain scheme, each
actor is in the network layer that has at least one
supply chain. Each supply chain usually has suppliers
and consumers at the same time and at different times.
Other actors in the network affect the performance of
the supply chain. Each actor may enforce different
rules in different chains and cooperate with different
chains which may become competitors in other
Development Strategy for the Master Plan of Maize Commodities Supply Chain Network Infrastructure in Madura, Indonesia
279
chains. Therefore, a supply chain analysis that is
evaluated in the context of a complex network in the
food supply chain is called the Food Supply Chain
Network (FSCN).
5.1 Research Time and Location
The research begins by identifying how the Madurese
maize distribution channels flow, through in-depth
interviews with the farmers and the stakeholders
involved in the Madura maize distribution channel.
The research was conducted in 4 Districts in Madura,
namely: Bangkalan, Sampang, Sumenep and
Pamekasan. The research was carried out in May -
December 2020. All the required data and
information are obtained through the following steps:
Observation, making direct observations of the
socio-economic conditions of the community
and maize farmer groups. So that we get an
overview of the patterns of life of the maize
farming community.
Interviews, conducting a series of in-depth
interviews with key informants. Interview
activities were carried out in depth by adhering
to the guidelines so that the information
obtained was focused on the research focus. The
interview activity was carried out in a friendly
atmosphere in order to obtain in-depth
information.
Focus Group Discussion, conduct a series of
discussions with related stakeholders, including
the local community, corn farmers, local
governments. This method was effective in
obtaining an overview of the problems faced
and leading to the formation of the Madura
FSCN model.
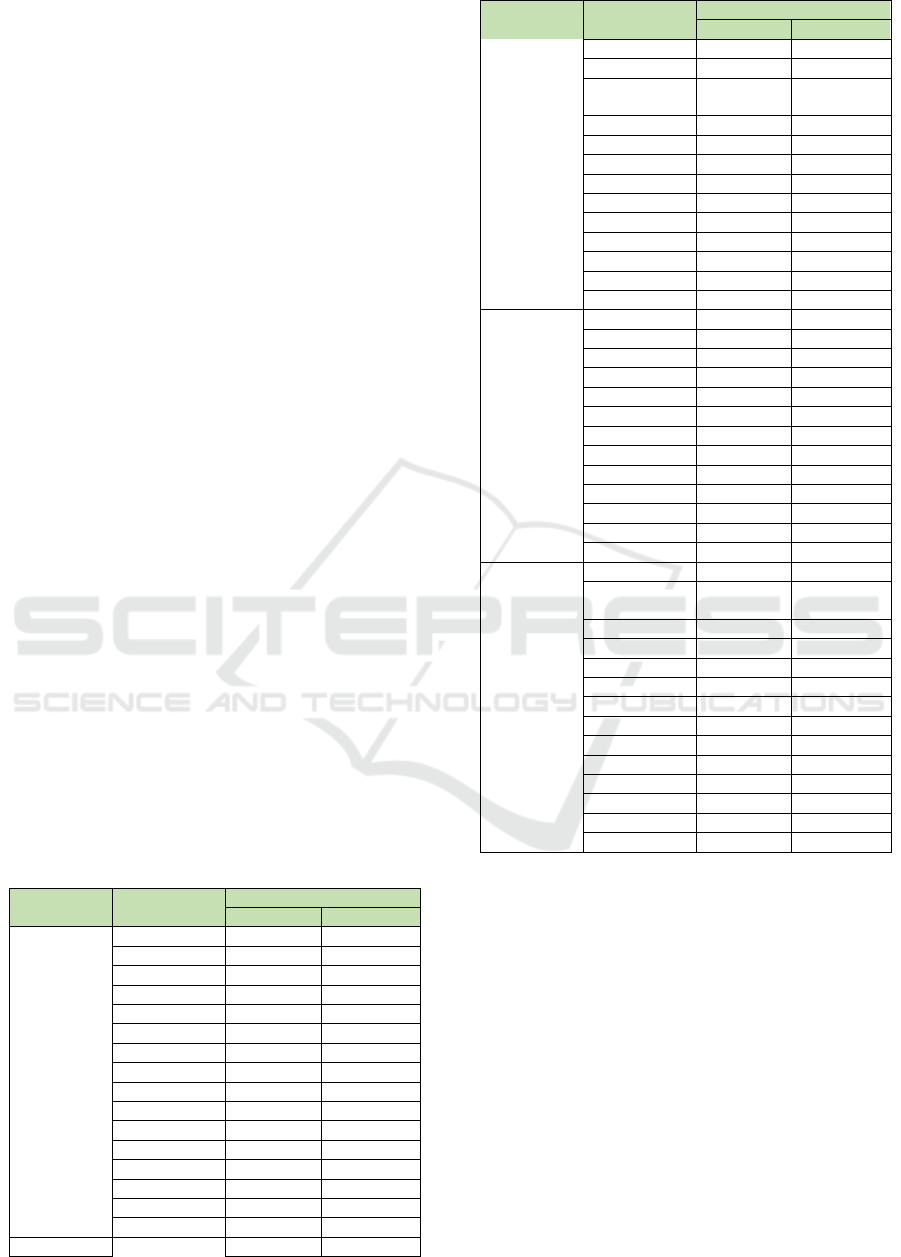
Table 2: The grouping location center of maize farmers.
District Sub-District
Coordinate
Latitude Longitude
Bangkalan
Arosbaya -6,980555 112,847817
Bangkalan -7,020299 112,749148
Blega -7,136924 113,035548
Burneh -7,021733 112,819757
Galis -7,085200 112,956128
Kamal -7,133042 112,727939
Klampis -6,929446 112,853194
Kokop -6,974531 113,042999
Konang -7,048266 113,063518
Labang -7,146231 112,815210
Modung -7,161283 112,989492
Sepul
u
-6,918702 112,976240
Socah -7,080662 112,715850
Tanah Merah -7,063186 112,877926
Tanjungbumi -6,902865 113,078371
Tragah -7,094972 112,827788
Sampang Sampang -7,203033 113,240466
District Sub-District
Coordinate
Latitude Longitude
Camplong -7,187072 113,342021
Omben -7,107241 113,340859
Karang
Penang
-7,028188 113,345422
Torjun -7,160078 113,205537
Pangarengan -7,203075 113,191925
Jrengi
k
-7,117839 113,140954
Sreseh -7,213517 113,096182
Tambelangan -7,038848 113,161989
Kedungdung -7,073639 113,228110
Robatal -6,996763 113,298816
Ketapang -6,918296 113,298476
Banyuates -6,912160 113,176141
Sokobanah -6,917964 113,427267
Pamekasan
Kadu
r
-7,086042 113,568466
Palengaan -7,083073 113,458160
Pagantenan -7,042138 113,473011
Pakong -7,042297 113,569862
Proppo -7,133964 113,416850
Pademawu -7,188069 113,508544
Pasean -6,919443 113,589822
Pamekasan -7,153247 113,467242
Galis -7,144900 113,537533
Larangan -7,119570 113,560821
Batumarma
r
-6,945935 113,494126
Tlanakan -7,188081 113,440215
Waru -6,963174 113,560993
Sumenep
Ambunten -6,910381 113,769384
Batang-
b
atang
-6,960218 114,018546
Batuan -7,019821 113,811711
Batuputih -6,902189 113,905390
Bluto -7,098494 113,788739
Dungke
k
-6,985624 114,057068
Ganding -7,062776 113,705115
Gapura -6,996853 113,945768
Gulu
k
-gulu
k
-7,028275 113,616856
Sumenep -7,019545 113,857827
Lenteng -7,039805 113,744712
Manding -6,958953 113,879039
Pasongsongan -6,983611 113,697441
Pragaan -7,096747 113,721167
5.2 Mapping the Location of Farmers
and Farmers Grouping
We obtained the initial data for maize farmers from
the Government of the Food Crops, Horticulture and
Plantation Service. Then, we completed data on
maize farmer land area, farmer annual production
tonnage, geotagging location for each farmer, by site
visiting each corn farmer's location. The total number
of farmer groups was 1631 farmer groups. A total of
1631 farmer groups are the research objects discussed
in this study. Mapping data snippets are shown in
table 1.
Farmer grouping designs to facilitate the supply
chain structure. Grouping is done to select a
communal warehouse point that represents farmer
CESIT 2020 - International Conference on Culture Heritage, Education, Sustainable Tourism, and Innovation Technologies
280
groups in each village. Grouping uses the Center of
Gravity method. The data required for grouping are:
(1) The volume of maize transported from the point
of the farmer group to the communal warehouse. (2)
Transportation costs. (3) Coordinate of maize farmer
and communal warehouse points. The calculation of
location coordinates uses the following
equation(Uitenbroek, 2003):
The coordinates of the selected communal
warehouse location.
x=
∑
∑
;y=
∑
∑
The distance between maize farmers location to
the candidate communal warehouse location.
Dn = Σ
𝑥𝑋
²
𝑦𝑌
The transport cost for maize aggregation
TC =
∑
𝑉
𝐷
𝐶
where
:
x = latitude of the selected location as the
communal warehouse.
y = longitude of the selected location as the
communal warehouse.
i = index of maize farmer members.
n = iteration index
X
i
= latitude of the i
th
maize farmer.
Y
i
= longitude of the i
th
maize farmer.
V
i
= Tonnage of the i
th
farmers' maize
production.
C
i
= Transportation rate of location I
D
n
= Distance of the i
th
farmer member to the
selected communal warehouse location in n
th
iteration.
TC = Total cost.
5.3 Determining the Location Point of
Aggregation Warehouse
The location point of aggregation warehouse is
determined using the Greenfield Analysis method,
then corrected using the Network Optimization
method. The data required for the Greenfield
Analysis method are:
The coordinates of the farmer groups
Maize crop tonnage for each farmer group
The number of aggregation warehouses
required
After obtaining the location of the aggregation
warehouse placement using the Greenfield Analysis
method, it is continued to improve the coordinate
points using the Network Optimization method. This
method is conducted by adding alternative
aggregation warehouses as a comparison to the initial
warehouse location, as well as additional maize
processing mill location data to be able to run this
method.
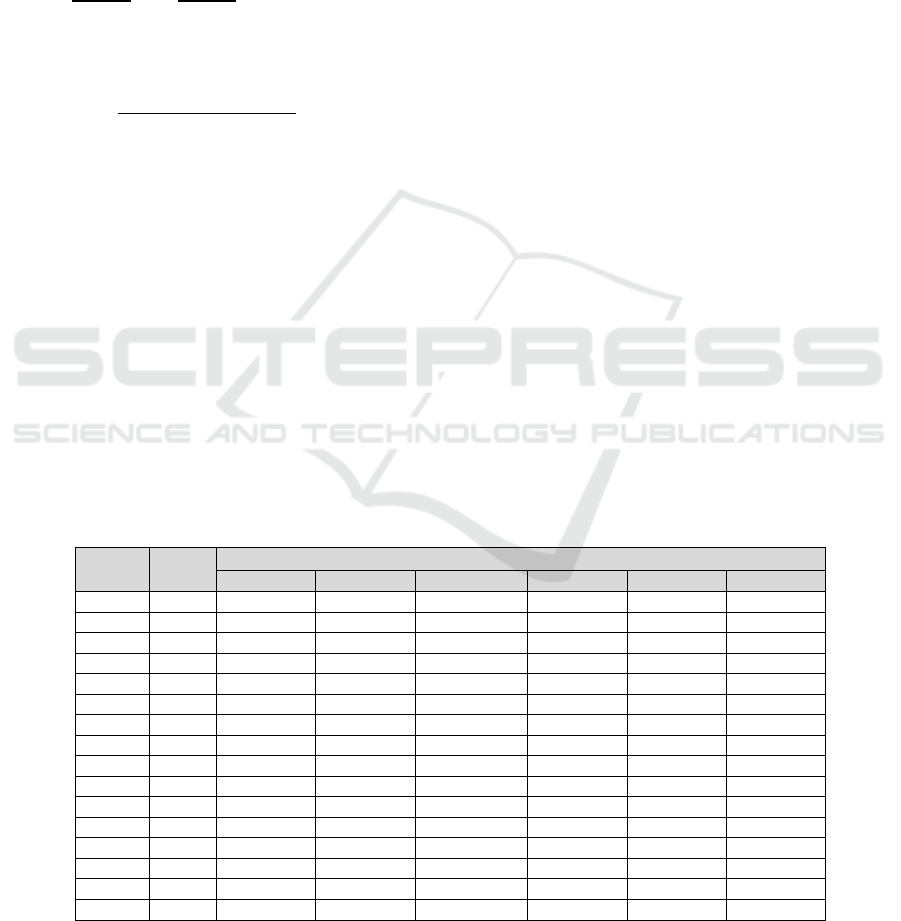
Table 3:The moving average forecast table for maize production.
Periode Year
MaizeProduction(Ton/year)
Bangkalan Sampang Pamekasan Sumenep Total Forecast
1 2007 140,984 141,679 76,339 298,880 657,882
2 2008 148,463 176,095 92,443 314,855 731,856
3 2009 151,933 116,462 114,856 353,022 736,273
4 2010 159,748 120,285 110,494 529,258 919,785 761,449
5 2011 174,455 113,265 147,192 310,056 744,968 783,221
6 2012 120,993 161,738 150,308 420,795 853,834 813,715
7 2013 127,527 108,645 95,338 359,689 691,199 802,447
8 2014 136,712 95,332 113,245 324,330 669,619 739,905
9 2015 132,884 98,332 93,793 396,067 721,076 733,932
10 2016 144,752 124,145 135,993 339,254 744,144 706,510
11 2017 132,586 149,219 187,672 325,384 794,861 732,425
12 2018 748,127
13 2019 754,889
14 2020 757,575
15 2021 748,254
16 2022 752,249
Development Strategy for the Master Plan of Maize Commodities Supply Chain Network Infrastructure in Madura, Indonesia
281
6 RESULTS AND DISCUSSION
The harvest of Madura maize by farmer groups is
usually sold to middlemen, farmers do not get a price
deal from the company but rather from the
middleman. The middlemen offer prices ranging from
3000 to 3500 IDR / kg for whole corn and IDR. 4000
- Rp. 4200 / kg for shelled corn. Middlemen sell corn
to producers in the form of shelled corn for around
5000 to 5500 IDR / kg. Farmers sell to middlemen,
because they give cash in cash.
6.1 Data on Maize Farmers in Madura
After conducting interviews with the Government of
the Food Crops, Horticulture and Plantation Service
in each four District. Data were obtained consisting
of farmer groups, cultivated land area and annual
production crop. The total number of farmer groups
was
1631 farmer groups.
6.2 Maize Farmer Grouping
We conducted site surveys in determining the point
of the maize farmer groups and recapitulated the
latitude and longitude coordinate data of each farmer
group. The determination of the coordinates of each
farmer group is conducted with the Google Maps
application on a Smartphone device. This data is
needed in the calculation of the Center of Gravity
using a mathematical model (1-3). The grouping
results of maize farmers can be seen in table 2.
6.3 Forecast of Maize Production
The maize production data that we have obtained was
only up to 2017. Meanwhile, the construction and the
use of aggregated warehouses is projected for 2022.
Therefore, forecasts of maize production are carried
out until 2022. Forecasts are carried out using the 4-
period moving average method. The moving average
forecast table for maize production is shown in Table
3. Based on the specified warehouse capacity and
maize corp, we set the warehouse capacity to be
200,000 tons/warehouse. Based on forecasting in
2022 of 752,249 tons/year with a warehouse capacity
of 200,000 tons, it can be determined that 4
aggregation warehouses will be needed.
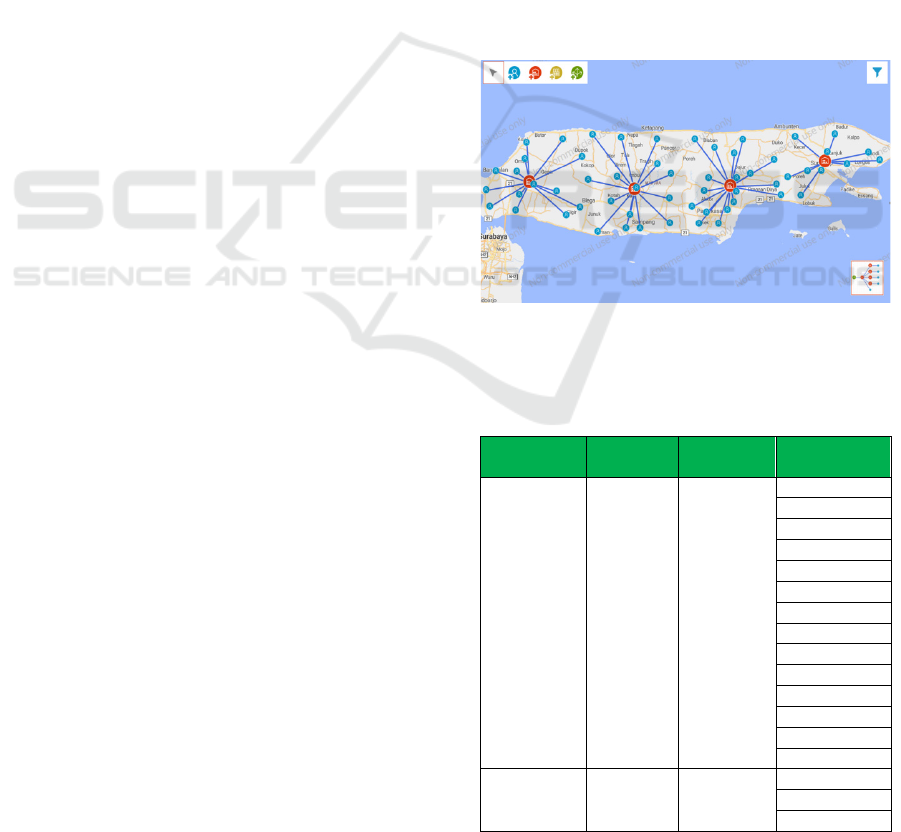
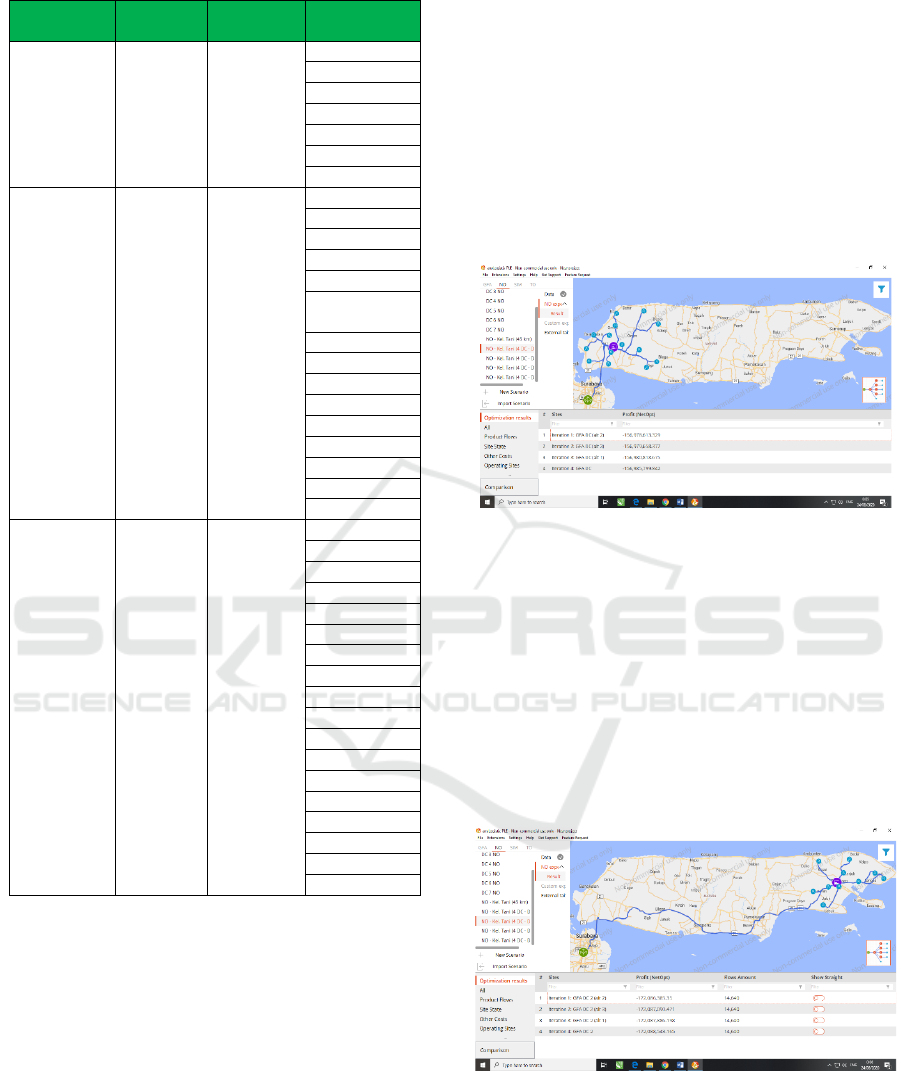
6.4 Location Point of Aggregation
Warehouse
Based on the GFA method using Anylogistix
software, the coordinates of each aggregation
warehouse were found, along with the coverage area
of the maize farmer groups. A summary of the
aggregation warehouse contained in the table 4.
Based on the forecast that has been done, it is
estimated that in 2022 the Madura maize corp will be
752,249 tons/year. It has been determined the number
of warehouses of 4 with a capacity of 200 tons each.
After determining the number of aggregation
warehouses and the center point of farmers in 57
farmer groups, then the next step is to determine the
coordinates of the aggregation warehouse. Here we
use Anylogistix software with the Greenfield
Analysis (GFA) method. A summary of the
aggregation warehouse contained in the table 4 and
figure 1.
Figure 1: The location of each aggregation warehouse and
the coverage area.
Table 4: The coordinates of each aggregation warehouse
and the coverage area.
Aggregation
Warehouse
Latitude Longitude
Warehouse
Coverage
GFA DC 1 -7,055735 112,862790
Blega
Tragah
Arosbaya
Tanah Merah
Sepulu
Kamal
Labang
Bangkalan
Burneh
Galis
Klampis
Kokop
Socah
Modung
GFA DC 2 -6,989219 113,870459
Batuan
Sumenep
Ambunten
CESIT 2020 - International Conference on Culture Heritage, Education, Sustainable Tourism, and Innovation Technologies
282
Aggregation
Warehouse
Latitude Longitude
Warehouse
Coverage
Batang-batang
Gapura
Lenteng
Manding
Dungkek
Bluto
Batuputih
GFA DC 3 -7,078855 113,220558
Banyuates
Tambelangan
Robatal
Tanjungbumi
Omben
Karang
Penang
Camplong
Kedungdung
Pangarengan
Jrengik
Konang
Sampang
Torjun
Sreseh
Ketapang
GFA DC 4 -7,068322 113,548234
Galis
Ganding
Waru
Sokobanah
Guluk-guluk
Batumarmar
Proppo
Pasean
Pagantenan
Pasongsongan
Tlanakan
Palengaan
Pamekasan
Pakong
Pademawu
Larangan
Pragaan
Kadur
6.5 Correction of Aggregation
Warehouse Location
The GFA method provides coordinate location for
aggregation warehouses along with the coverage of
farmer groups, where the resulting coordinate was the
optimal point based on maize crop tonnage and the
distance between aggregation warehouse coordinates
to farmer groups. The calculated distance was the
euclidian distance between coordinates, not based on
the actual distance. Therefore it is necessary to
improve using the Network Optimization (NO)
method using the same software, Anylogistix.
Improvement is done by providing alternative
warehouse points which are then compared with
warehouse points generated by the GFA method. The
NO method requires the coordinates of the maize
processing mill as the final destination for the maize
to be distributed. We set the maize processing mill
PT. Charoen Pokphand Indonesia Tbk. In improving
the placement of aggregation warehouse points with
the NO method, we set 3 alternative warehouses for
each initial warehouse as a comparison to the
determination of 4 warehouses.
Figure 2: The location of GFA DC1 (alt2) aggregation
warehouse and the coverage area.
The coordinates of the GFA DC 1 warehouse were
obtained by the GFA method at -7.056, 112.863. As
candidates, alternative warehouse 1 was assigned at
coordinates -7.084, 112.876; alternative warehouse 2
at coordinates -7.073, 112.84; alternative warehouse
3 at coordinates -7.079, 112.855. The results of the
NO method show that the best warehouse location is
in alternative warehouse 2, namely GFA DC 1 (alt 2)
at the coordinate point -7.073, 112.84. The warehouse
location on the map can be seen in the figure 2.
Figure 3: The location of GFA DC2 (alt2) aggregation
warehouse and the coverage area.
The coordinates of the GFA DC 2 warehouse were
obtained by the GFA method at -6.989, 113.87. As
candidates, alternative warehouse 1 was assigned at
coordinates -7.001, 113.871; alternative warehouse 2
Development Strategy for the Master Plan of Maize Commodities Supply Chain Network Infrastructure in Madura, Indonesia
283
at coordinates -7.003, 113.849; alternative warehouse
3 at coordinates -7.013, 113.859. The results of the
NO method show that the best warehouse location is
in alternative warehouse 2, namely GFA DC 2 (alt 2)
at the coordinate point -7.003, 113.849. The
warehouse location on the map can be seen in the
figure 3.
Figure 4: The location of GFA DC3 (alt3) aggregation
warehouse and the coverage area.
The coordinates of the GFA DC 3 warehouse were
obtained by the GFA method at -7.079, 113.221. As
candidates, alternative warehouse 1 was assigned at
coordinates -7.08, 113.208; alternative warehouse 2
at coordinates -7.09, 113.253; alternative warehouse
3 at coordinates -7.072, 113.184. The results of the
NO method show that the best warehouse location is
in alternative warehouse 3, namely GFA DC 3 (alt 3)
at the coordinate point -7.072, 113.184. The
warehouse location on the map can be seen in the
figure 4.
Figure 5: The location of GFA DC4 aggregation warehouse
and the coverage area
The coordinates of the GFA DC 4 warehouse were
obtained by the GFA method at -7.068, 113.548. As
candidates, alternative warehouse 1 was assigned at
coordinates -7.045, 113.59; alternative warehouse 2
at coordinates -7.046, 113.57; alternative warehouse
3 at coordinates -7.045, 113.59. The results of the NO
method show that the best warehouse location is in
initial GFA DC 4 warehouse at the coordinate point
-7.068, 113.548. The warehouse location on the map
can be seen in the figure 5.
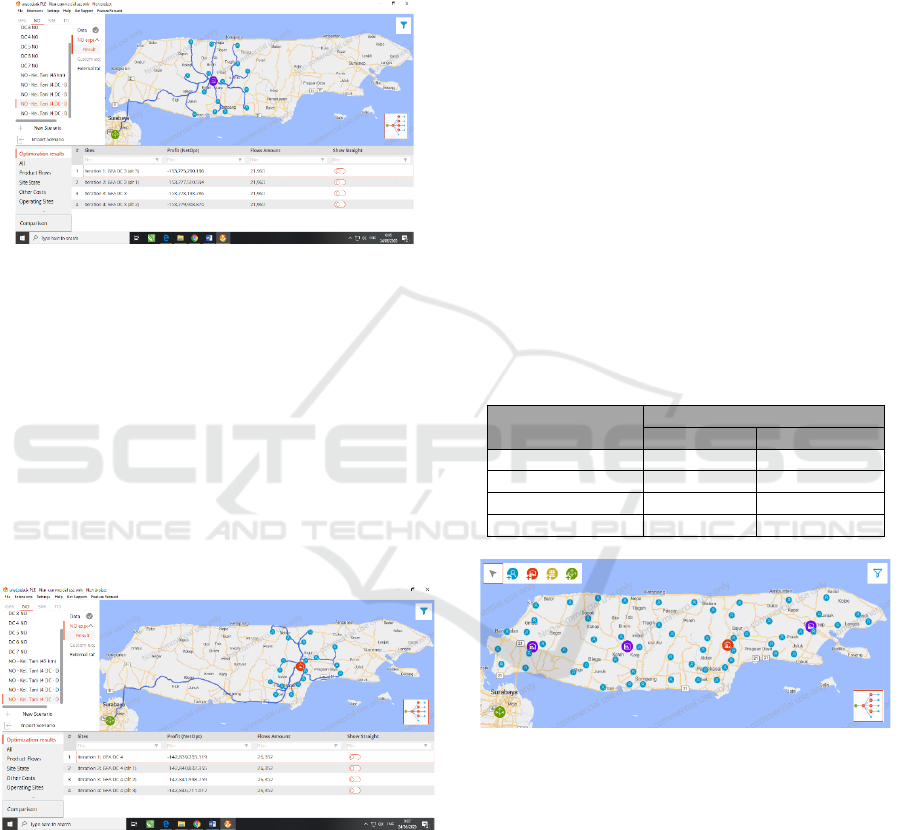
7 CONCLUSION AND THE
FUTURE WORK
It has been determined the coordinates of the
aggregation warehouse using the GFA method and
corrections to find the optimal point using the NO
method. Based on the calculation using these two
methods, the coordinates of the proposed aggregation
warehouse locations are obtained. Following in table
5 and figure 6, a summary of the coordinates location
of aggregation warehouse. The location of the
aggregation warehouse is located in the highlands. In
fact, this location makes transportation difficult.
Further research can be carried out by adding priority
constraints for coastal areas for the location of
aggregation warehouses.
Table 5: The coordinates of the proposed aggregation
warehouse locations.
Aggregation
Warehouse
Coordinate Location
Latitude lon
g
itude
GFA DC1
(
alt2
)
-7.073 112.840
GFA DC2 (alt2) -7.003 113.846
GFA DC3 (alt3) -7.072 113.184
GFA DC4 -7.068 113.548
Figure 6: The coordinates of the proposed aggregation
warehouse locations.
REFERENCES
Akhmad, S., Arendra, A., Mu’alim, Hidayat, R., 2020. The
communal salt farmer ventures grouping strategy in
Sumenep District using the P-Median method to
minimize transport distance in food supply chain
network. J. Phys. 1477.
Akhmad, S., M, M., Suprajitno, H., 2019. Interval Model of
Food Supply Chain Network At the Multi Stage
Distribution Systems. Int. J. GEOMATE 16, 125–130.
CESIT 2020 - International Conference on Culture Heritage, Education, Sustainable Tourism, and Innovation Technologies
284

Asmarantaka, R.W., Atmakusuma, J., Muflikh, Y.N.,
Rosiana, N., 2018. Konsep Pemasaran Agribisnis :
Pendekatan Ekonomi Dan Manajemen. J. Agribisnis
Indones. 5, 151.
Banasik, A., Kanellopoulos, A., Claassen, G.D.H.,
Bloemhof-Ruwaard, J.M., van der Vorst, J.G.A.J.,
2017. Assessing alternative production options for eco-
efficient food supply chains using multi-objective
optimization. Ann. Oper. Res. 250, 341–362.
Berti, G., Mulligan, C., 2016. Competitiveness of small
farms and innovative food supply chains: The role of
food hubs in creating sustainable regional and local
food systems. Sustain. (United States) 8.
Bloemhof, J.M., van der Vorst, J.G.A.J., Bastl, M., Allaoui,
H., 2015. Sustainability assessment of food chain
logistics. Int. J. Logist. Res. Appl. 18, 101–117.
Bustos, J.A., Olavarría, S.H., Albornoz, V.M., Rodríguez,
S. V., Jiménez-Lizárraga, M., 2017. A stackelberg
game model between manufacturer and wholesaler in a
food supply chain. In: ICORES 2017 - Proceedings of
the 6th International Conference on Operations
Research and Enterprise Systems. SCITEPRESS –
Science and Technology Publications, Lda., pp. 409–
415.
Chopra, S., Meindl, P., 2013. Supply Chain Management,
5th Edition, Fifth Edit. ed. PEARSON, Delhi.
Cruz, E.F., Rosado da Cruz, A.M., 2019. A food value chain
integrated business process and domain models for
product traceability and quality monitoring: Pattern
models for food traceability platforms. In: ICEIS 2019
- Proceedings of the 21st International Conference on
Enterprise Information Systems. SCITEPRESS –
Science and Technology Publications, Lda, pp. 285–
294.
Dellino, G., Laudadio, T., Mari, R., Mastronardi, N.,
Meloni, C., 2015. Sales forecasting models in the fresh
food supply chain. In: ICORES 2015 - 4th International
Conference on Operations Research and Enterprise
Systems, Proceedings. SCITEPRESS (Science and
Technology Publications, Lda.), pp. 419–426.
Desiana, N., Aprianingsih, A., 2018. Improving Income
through Farmers’ Group Empowerment Strategy. Asian
J. Technol. Manag. 10, 41–47.
Dou, S., Liu, G., Yang, Y., 2020. A New Hybrid Algorithm
for Cold Chain Logistics Distribution Center Location
Problem. IEEE Access 8, 88769–88776.
Ferreira, L.M.D.F., Arantes, A.J., 2015. Proposal of a
framework to assess the supply chain performance in
the agri-food sector. In: ICORES 2015 - 4th
International Conference on Operations Research and
Enterprise Systems, Proceedings. SCITEPRESS
(Science and Technology Publications, Lda.), pp. 401–
406.
Sembiring Meliala, J., Hubeis, M., Jahroh, S., Maulana, A.,
2019. Aggregator Business as an Intermediary in
Agriculture: A Literature Review. In: The 4th Sriwijaya
Economics, Accounting, and Business Conference
(SEABC 2018). SCITEPRESS – Science and
Technology Publications, Palembang, pp. 56–64.
Taghikhah, F., Voinov, A., Shukla, N., Filatova, T.,
Anufriev, M., 2020. Integrated modeling of extended
agro-food supply chains: A systems approach. Eur. J.
Oper. Res. 1–17.
Uitenbroek, H., 2003. The Accuracy of the Center‐of‐
Gravity Method for Measuring Velocity and Magnetic
Field Strength in the Solar Photosphere. Astrophys. J.
592, 1225–1233.
Wajszczuk, K., 2016. The Role and Importance of Logistics
in Agri-Food Supply Chains: An Overview of
Empirical Findings. Logist. Transp. 30, 47–56.
Winarso, K., Rohim, M.I.A., 2019. Comparation of P-
Median , P-Center , and Maximal Coverage on Facility
Location Problem of Bokabo Tobacco Supply Chain ,
Sumenep District 203, 183–190.
Xue, N., Landa-Silva, D., Figueredo, G.P., Triguero, I.,
2019. A simulation-based optimisation approach for
inventory management of highly perishable food. In:
ICORES 2019 - Proceedings of the 8th International
Conference on Operations Research and Enterprise
Systems. SCITEPRESS – Science and Technology
Publications, Lda, pp. 406–413.
Development Strategy for the Master Plan of Maize Commodities Supply Chain Network Infrastructure in Madura, Indonesia
285
