
Post-processing for Three Class of Tool Wear Prognosis using Two
Class ANN Classifier based on Vibration of CNC Milling
Anis Arendra
1
,Sabarudin Akhmad
2
, Herianto
3
, and Kukuh Winarso
2
1
Mechanical Engineering Departement, University of Trunojoyo Madura, Indonesia
2
Industrial Engineering Departement, University of Trunojoyo Madura, Indonesia
3
Deptement of Mechanical and Industrial Engineering, Universitas Gadjah Mada, Indonesia
Keywords: Tool Wear Prognosis,MultiLayer Perceptron, Vibration, Multilevel Classifier.
Abstract: This research propose a novel method of utilizing bi-levels tool wear classifiers to prognose three levels of
tool wear through additional post-processing stages. The classifier uses a multi-layer perceptron (MLP),
single hidden layer, trained using the resilient backpropagation method. The original classifier output range
-1 to 1 and threshold 0.0 for the separator of two classes, has been able to achieve 100% classification
accuracy of two CNC tool conditions, severe wear and normal one, based on vibration features in the time
domain and order domain. This classifier was tried to classify three levels of tool wear: normal, moderate
wear, severe wear, according to ISO 8688 standard. Output of existing MLP classifier is passed through a
moving average filter with period 4 and using threshold of -0.8 and +0.8 for three level separation, normal
tool, moderate wear, severe wear. The proposed method is proven to achieve 89.98% accuracy from 459
tests. Fail safe missclassification occurred from 153 test cases which were supposed to be moderate wear,
46 of them were incorrectly indicated as severe wear. For the severe wear test case and normal tool test
case, no prediction errors were found. The 100% accuracy for both test case prediction.
1 INTRODUCTION
The CNC machining role has wide spread and
increasingly important in the manufacturing industry
(Cheng et al., 2019) and (Teti et al., 2010), as well
as tool condition monitoring technology (Huang et
al., 2019) and (Zhou et al., 2019). Tool Condition
Monitoring (TCM) technology is constantly being
developed to ensure the quality and efficiency of
machining(Ahmad and Kamaruddin, 2012). The
TCM method is generally divided into: qualitative-
based method, model-based method, data-based
method(Cheng et al., 2019). Model-based methods
analytically build the mathematical models to
explain the phenomenon of machining tool wear,
like the method used by Mishra, (2015), Rmili et al.,
(2016), Liu et al., (2010), and Mei et al., (2018). But
this is not an easy build, given the complexity of the
mechanical machining system(Yau et al., 2014) and
(Huang et al., 2019). While the data-based method
does not require analytical knowledge, it only
requires empirical knowledge about the relationship
of tool wear with physical phenomenon of the
machining (Jemielniak et al., 2012), so this method
is more practical to use (Wei and Wang, 2019).
2 PREVIOUS WORK
Sensors commonly used in tool wear detection are
acoustic emission sensors and accelerometer(Murat
et al., 2017). Lembke, (2019) and Casoli,
(2019)sated, data-based methods of TCM require
classifiers that are supervisically trained as used in
research by Zhou et al., (2019), Casoli et al., (2019)
and Pappachan et al., (2017), or unsupervisically-
trained based on databases as used in research by
Barraza, (2017), Sakthivel et al., (2014) and
Benkedjouh et al., (2017). Commonly used
classifiers are Support Vector Machine (SVM) as
used by Zhou et al., (2019), Artificial Neural
Network (ANN) used by Arendra and Herianto,
(2020), Arendra et al., (2020), and Prasetyo et al.,
(2018), K-Nearest Neighborhood (KNN) used by
Junior et al., (2018), Genetic Algorithm used by Goti
et al., (2019), and Bayesian Network used by Tobon-
Mejia et al., (2012). The supervised training method
Arendra, A., Akhmad, S., Herianto, . and Winarso, K.
Post-Processing for Three Class of Tool Wear Prognosis using Two Class ANN Classifier based on Vibration of CNC Milling.
DOI: 10.5220/0010307500003051
In Proceedings of the International Conference on Culture Heritage, Education, Sustainable Tourism, and Innovation Technologies (CESIT 2020), pages 269-276
ISBN: 978-989-758-501-2
Copyright
c
2022 by SCITEPRESS – Science and Technology Publications, Lda. All rights reserved
269
for classifier requires a database for training,
validation and testing(Leturiondo et al., 2016). The
number of database subsets for this classifier is the
same as the number of classes to be
grouped(Wiharto et al., 2016).
Multiclass SVM classifier has been used by
Wiharto et al., (2015) and Cheng et al., (2019)for the
classification of five levels of heart disease cases
and the classification of three levels of of CNC tool
wear, respectively. Wiharto et al., (2015)used five
subsets of data at healthy, sick-low, sick-medium,
sick-high, sick-serious levels. Cheng et al.,
(2019)use three subset data at healthy state level,
degradation state level, and failure state level. As
expected, for n class classifiers a number of n
training data sub-sets are required. Yiqian He et al.,
(2019)uses a different approach, exploring the
correlation between the mahalanobis distance of
vector features to the wear level, then setting two
thresholds to separate the three wear levels of tool.
The approach taken by Tobon-Mejia et al., (2012)is
constructing the model behavior of tool degradation
phenomena with a set of mathematical models for
predicting the evolution of tool degradation. This
paper proposes a new approach to classifying three
levels of tool wear using a classifier that is trained
with twower classes, then followed by post-
processing.
3 EXPERIMENT SETUP AND
METHODS
The sensors used to collect data are MEMS
Accelerometer MMA7361 and DT-SENSE Tracking
SFH-300. MMA7361 sensor sensitivity is 800mV /
g in the range of 0g - 1.5g. The sensor output is
analog voltage 0 - 3.3V for X, Y, and Z channels.
This sensor is installed in the workpiece fixture. The
DT-SENSE Line Tracking Sensor SFH-300 is used
as an optical proximity sensor to detect the spindle
rotation phase that has been marked with a white
reflector strip. This sensor works on a 5VDC voltage
power supply, has four channel voltage outputs from
0 to 4.9V, the rise and fall response time is 10µs.
Data acquisition equipment uses DAQ NI USB-
6008 with NI-DAQmx 9.9 device driver. The DAQ
works on USB interface, input voltage range of ±
10V, the maximum aggregate sampling rate for
multichannel is 10kS/s. In this study, DAQ NI USB-
6008 is set in differential analog input mode with a
resolution of 12bits and a maximum of 4 input
channels. Channels 1,2,3, respectively measure the
vibration of the milling machine table in the X, Y, Z
axis. Channel 4 for detection of spindle rotation
phase.
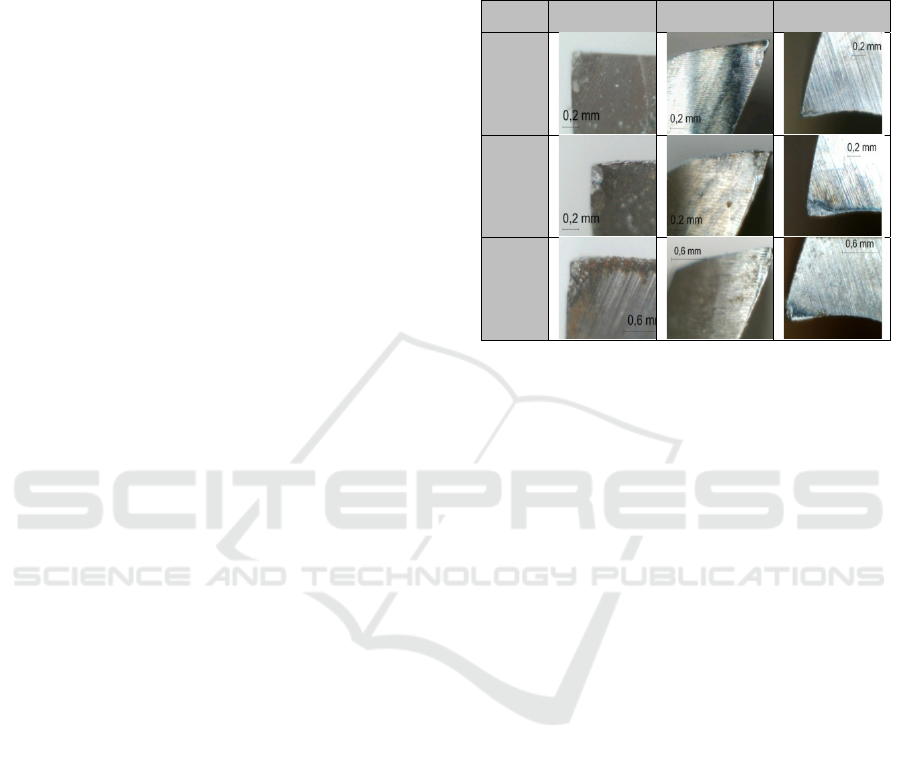
Table 1:Micro photo of end mill tool wear gradation.
Tool Face Major Flank Minor Flank
Norm
al
Wear
Mode
rate
Wear
Sever
e
Wear
The experimental treatment used a 4SE-
LIST6210 10X25X75X10 HSS-Co RA26 nachi end-
mill, a four flute end mill tool with a diameter of
10mm. This tool is used for up-milling machining of
mild steel with depth of cut 0.2 mm and 5 mm
cutting width, without coolant. Parameters of
machining spindle speed vary from 550rpm,
650rpm, 750rpm, and feed per tooth varies from
0.02mm, 0.05mm, 0.08mm. The first row and third
row of table 1 show the appearance of normal toll
and severe wear that were used for classifier training
in this study. While the second row of table 1 shows
the appearance of moderate tool wear, for testing
three level classifier alongside with normal tool and
severe wear tool.
4 RESULT AND DISCUSSION
Data acquisition of four channels with a sampling
size of 1024 datapoints was carried out at a sampling
frequency of 2.5 kHz for 409.6 ms. The four
channels consist of X Y Z axis vibrations and
spindle rpm. Feature extraction is performed to get
features represent 3 × 1024 time-domain datasets
and 3 × 513 order-domain datasets. The time-
domain vibration feature is represented by statistical
measure of data distribution, std, skewness, kurtosis,
range for each XYZ axis. Whereas the order-domain
feature is represented by the magnitudes of
acceleration in 1st order to 90th order. Feature
selection is based on correlation analysis, ten
CESIT 2020 - International Conference on Culture Heritage, Education, Sustainable Tourism, and Innovation Technologies
270
features are selected: stdz, rangey, stdy, rangex,
stdy, rangez, X2nd, Y13th, Z13th, Y2nd.
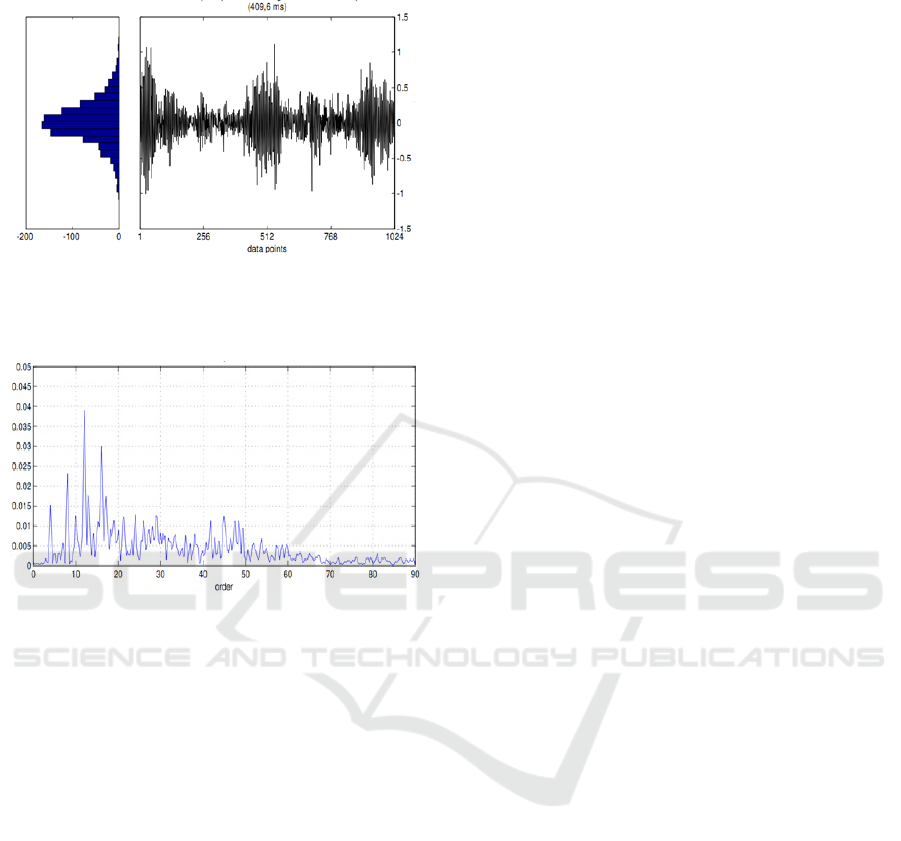
Figure 1: Discrete waveforms of 1024 time-domain
datapoints, 409.6ms, represented by a statistical measure
of data distribution for the extraction of time-domain
features.
Figure 2: The vibration order spectrum as a result of Fast
Fourier Transform and normalization to the spindle rpm,
for the use of order-domain features extraction.
4.1 MLP Training using Two Level of
Tool Wear
The artificial neural network used for the classifier is
MultiLayerPreceptron (MLP) with a single hidden
layer. In the context of MLP learning and
discovering the general pattern of training data, the
MLP training process is stopped when the training
process begins to show symptoms of overfitting. In
this study, the symptoms of overfitting were
monitored from the MSE of validation sub-set data.
The database of vibration features is divided into
three parts; training data subset to train the classifier,
test data subset to assess the training progress and
validation data subset for early stopping use. During
in the training progress, if the MSE training data
subset decreases but the MSE validation data subset
does not goes down and occurs in 4 epochs
consecutively, then this shows the MLP begins to
learn the specific characteristics of the training data
subset and ignores the generality of the whole data
pattern so that the training process must be stopped.
This MLP training is carried out by setting the
max_fail training parameter by 4 and separate the
dataset in three groups randomly at8: 1: 1 proportion
for the training data subset, the test data subset and
the validation data subset.
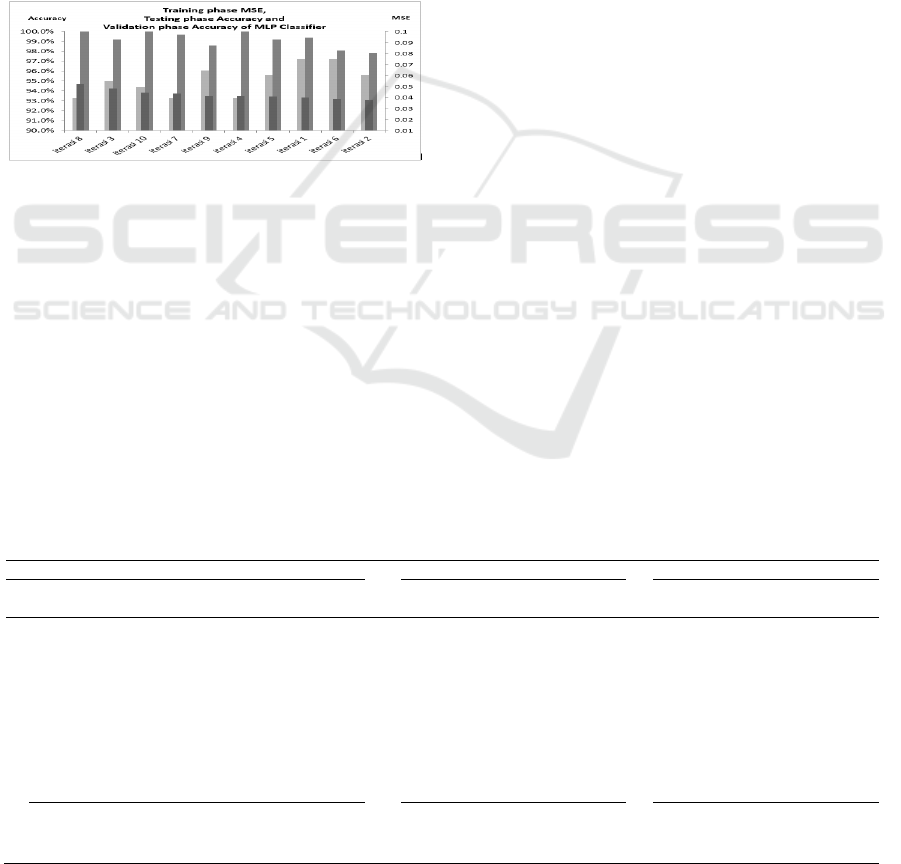
A summary of training, testing and validation of
ten MLP is tabulated in Table 2. A performance
comparison of the ten MLP iteration is shown in
Figure 9, in the MSE order of the largest to the
smallest. MLP training with resilient
backpropagation can achieve MSE in the range of
0.0524 to 0.0376. None of the test accuracy in the
group reached 100% accuracy, the highest accuracy
that can be achieved is 97.2%. But the validation
results show the opposite, 3 out of 10 iterations are
able to achieve 100% accuracy. The lowest MSE
training data in the 2nd iteration provides the worst
accuracy in this test group validation. Validation of
100% accuracy is achieved by MLP with MSE
ranging from 0.0524 to 0.0411. The best MLP case
chosen for the classifier is the result of 4th iteration
neuron weighting. The TCM system used in this
study is able to perform the tool wear detection
based on vibration measurements of the CNC
machine.
The detailed output of TCM prediction for severe
tool wear detection with an output target at value of
positive one, is shown in Figure 3. While Figure 5
displays the detailed output of TCM prediction for
normal tool with the target output at value of
negative one. Both images displays 20 predicted
conditions of tool wear for 9 treatment machining
parameter. The first row, second row, third row of
the plot data consecutively are the spindle speed of
750 rpm, 650 rpm, 550 rpm treatment. The first
column, the second column, the third column of the
data plot consecutively are cutting depth parameter
of 0.08; 0.05; 0.02 mm/tooth.
Generally speaking, the MLP predictions have
reached the target, especially on parameters
machining of spindle speeds at 750 rpm and 650
rpm. In the parameters machining of spindle speed at
550 rpm, there are some MLP predictions that are
less close to the target even though they are included
in the right classification. This incidents occurred in
the machining parameter of 0.08 mm/tooth cutting
thickness of severe tool wear condition. MLP
prediction uses a threshold value of 0, then the
positive numbers output of MLP will be concluded
that the tool condition is severe wear, and vice versa.
The negative numbers output of MLP will be
concluded as a normal tool condition. MLP accuracy
for the validation of these 2 classes attain 100%
accuracy for the 360 test cases.
Post-Processing for Three Class of Tool Wear Prognosis using Two Class ANN Classifier based on Vibration of CNC Milling
271
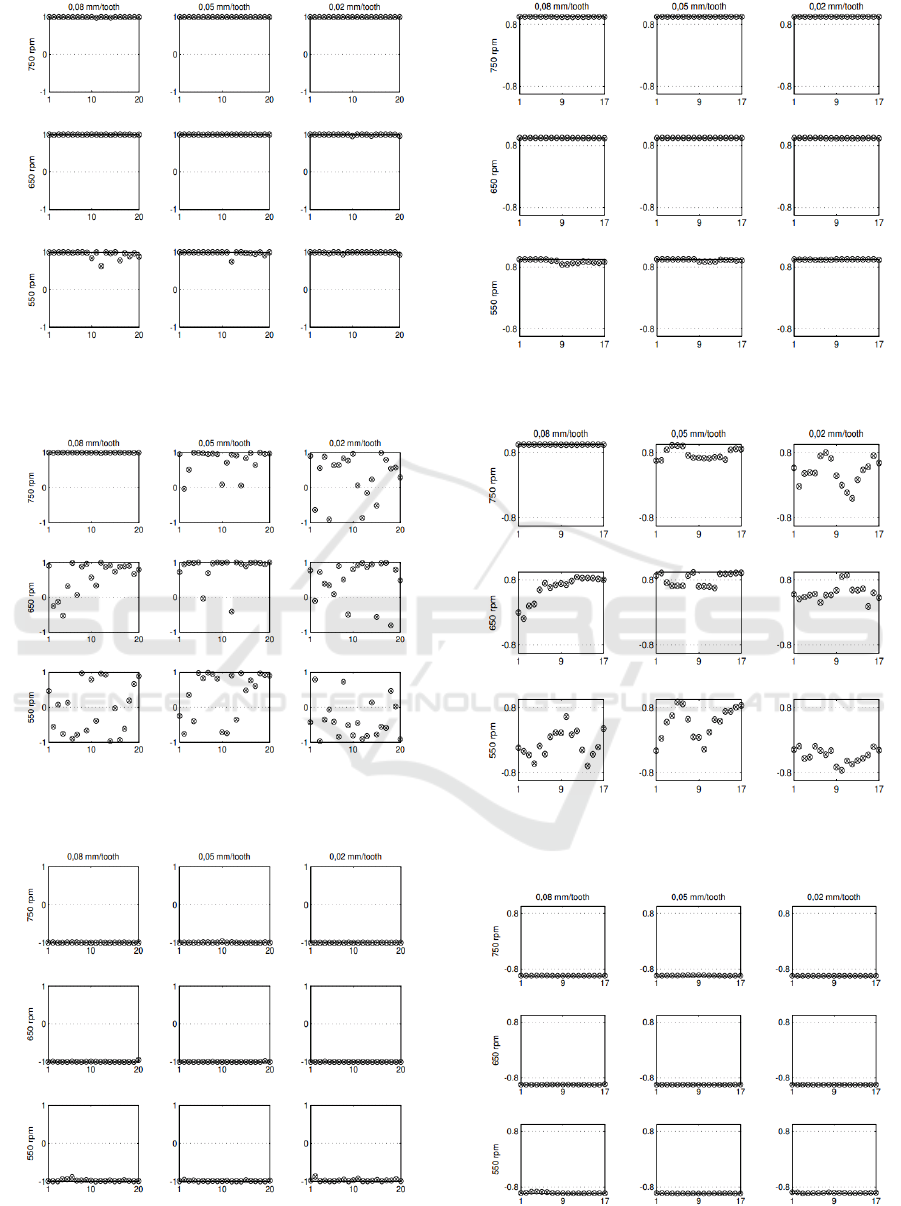
Figure 3: TCM prediction output before post-processing
on the use of severe tool wear for nine machining
parameter.
Figure 4: TCM prediction output before post-processing
on the use of moderate tool wear for nine machining
parameter.
Figure 5: TCM prediction output before post-processing
on the use of normal tool for nine machining parameter.
Figure 6: TCM prediction output with post-processing on
the use of severe tool wear for nine machining parameter.
Figure 7: TCM prediction output with post-processing on
the use of moderate tool wear for nine machining
parameter.
Figure 8: TCM prediction output with post-processing on
the use of normal tool for nine machining parameter.
CESIT 2020 - International Conference on Culture Heritage, Education, Sustainable Tourism, and Innovation Technologies
272
4.2 Post-processing for Three Level
Classification
The range for deducing tool conditions in the existing
classifier is very wide, above the threshold value of 0
to 1, it is concluded that the condition is severe wear,
and below the threshold value of 0 to -1, it is
concluded that the tool condition is normal. If the
inference output range is narrowed, the inference
range for severe wear condition is set at the limit of
0.8 to 1, and the normal tool condition inference range
is set at the range -1 to -0.8. Then there is a range that
cannot be defined as a severe wear condition or
normal tool conditions, i.e. range above -0.8 to below
0.8. The range between -0.8 to 0.8 is what will be
used as thresholds to the prognosis of a moderate tool
wear.
Figure 9: Training phase MSE, testing phase accuracy and
validation phase accuracy of MLP classifier.
For the validation of three levels classification,
three levels of tool wear were used; normal tool,
moderate wear tool and severe wear tool. The first
tool was a severe wear tool shown in third row of
table 1. The flank wear of this tool has reached the
tool wear criterion based on ISO 8688
recommendations. The second tool is a moderate
worn tool shown in second row of Table 1. The third
tool is a normal tool, there is no significant flank wear
on the cutting edge shown in first row of Table 1.
Detailed output of MLP predictions on the use of
moderate wear tools is shown in Figure 4. MLP
predictions on the use of moderate wear tool show
floating values between -1 to 1, especially in the
machining parameters 0.02 mm/tooth feed and 550
rpm spindle speed. For machining parameters of 0.05
mm/tooth feed, 750 rpm and 0.08 mm/tooth feed,
650 rpm, MLP output tends to scatter in the range of
0 to 1. For machining parameters of 0.08 mm/tooth
feed, 750 rpm , MLP output tends to close to 1.
To reduce the fluctuation of MLP output values
and improve the quality of MLP inferencing, post-
processing is applied by smoothing filter using a
simple moving average with a period of 4. Detailed
MLP conclusion output by smoothing on the use of
severe wear tool, moderate wear tool and normal tool,
consecutively is shown in Figure 6, Figure 7, and
Figure 8. With the application of smoothing post-
processing, MLP output fluctuations are considerably
damped. The MLP prediction output for the use of
severe wear tool is always in the range of 0.8 to 1 for
153 test cases on 9 parameters of machining. With
these results, the accuracy of MLP for the
classification of severe wear tool conditions attain
100% accuracy. TCM prediction output on normal
tool use is always in the range -1 to -0.8 for 153 test
case on 9 parameters of machining. With these
results, the accuracy of TCM for the classification of
normal tool conditions attain 100% accuracy.
Unlike the results of validation on the use of
severe wear tools and normal tools, the validation of
TCM prediction for the use of moderate wear tools
have not reached 100% accuracy. In general, most
TCM conclusions are in the range -0.8 to 0.8. But in
cutting parameters with 0.08 mm/tooth feed, 750 rpm,
all test case samples were indicated severe wear
because they were in the range 0.8 to 1. In cutting
parameters 0.05 mm/tooth feed, 650 rpm, 9 of 17 test
case samples were indicated severe wear, even though
it was moderate wear.
Table 2: MSE of classifier during training phase and accuracy of classifier in testing phase and validation phase.
Training Phase Testing Phase Validation Phase
Train
Iteration
Epoch MSE Gradient Missed False
Alarm
Acuracy Missed False
Alarm
Acuracy
1
st
44 0,0402 0,0498 3,0% 2,5% 97,2% 0,6% 0,6% 99,4%
2
nd
62 0,0376 0,00631 6,4% 2,3% 95,6% 2,8% 1,7% 97,8%
3
rd
18 0,0485 0,0193 5,4% 4,5% 95,0% 0,0% 1,7% 99,2%
4
th
25 0,0411 0,036 8,5% 4,7% 93,3% 0,0% 0,0% 100,0%
5
th
50 0,0408 0,0112 4,7% 4,2% 95,6% 1,1% 0,6% 99,2%
6
th
53 0,0389 0,00834 3,2% 2,3% 97,2% 3,9% 0,0% 98,1%
7
th
43 0,0436 0,00771 8,9% 5,0% 93,3% 0,6% 0,0% 99,7%
8
th
18 0,0524 0,0138 7,2% 6,0% 93,3% 0,0% 0,0% 100,0%
9
th
41 0,0413 0,0093 5,4% 2,3% 96,1% 1,1% 1,7% 98,6%
10
th
45 0,0443 0,0221 6,5% 4,6% 94,4% 0,0% 0,0% 100,0%
Best 18 0,0376 0,00631 3,0% 2,3% 97,2% 0,0% 0,0% 100,0%
Average 40 0,04287 0,01838 5,9% 3,8% 95,1% 1,0% 0,6% 99,2%
Worse 62 0,0524 0,0498 8,9% 6,0% 93,3% 3,9% 1,7% 97,8%
Post-Processing for Three Class of Tool Wear Prognosis using Two Class ANN Classifier based on Vibration of CNC Milling
273

Table 3: Detail of TCM prediction.
Spindle (rpm) 750 650 550 Tota
l
Feed (mm/tooth)
0,0
8
0,0
5
0,0
2
0,0
8
0,0
5
0,0
2
0,0
8
0,0
5
0,0
2
treatment 1 2 3 4 5 6 7 8 9
Predicted
severe 17 7 1 6 9 2 0 4 0
46
moderate 0 10 16 11 8 15 17 13 17
107
normal 0 0 0 0 0 0 0 0 0
0
Sub-total 17 17 17 17 17 17 17 17 17 153
Accuracy(%) 0,0
58,
8
94,
1
64,
7
47,
1
88,
2
10
0
76,
5
10
0
69,9
Table 4: Confussion matrix of TCM classifier.
True Class
severe moderate normal
Predicted Class
severe 153 46 0
moderate 0 107 0
normal 0 0 153
Accuracy 100% 69,9% 100% 89,98%
The detailed results of the TCM inference for the
9 cutting parameter treatments are shown in Table
III. The best accuracy of 100% on moderate wear
tool use is achieved for 0.02 mm/tooth feed. The
thicker the feed per tooth, the lower the inference
accuracy, and there tends to be misclassification as
the tool is severe wear. Likewise for spindle speed
cutting parameter. The faster the spindle turns, the
more accurate the inference is, and the prediction
error tends to misclassification as severe tool wear.
Detailed confusion matrix 3 × 3 TCM validation
using 3 levels of tool wear is shown in Table IV.
The TCM summary was obtained from TCM
predictions by Figure 6, Figure 7, and Figure 8. It
appears in TCM validation on use of severe wear
tool, that 153 out of 153 test cases indicated
precisely as a severe wear condition. Likewise in
TCM validation using normal tools, 153 out of 153
test cases are correctly indicated as normal tools. In
both classes there is no misclassification.
5 CONCLUSIONS
Validation of TCM predictions using moderate wear
tools, 107 out of 153 inferences are precisely
indicated as moderate wear tools, 46
missclassifications as broken tools, and no
missclassification as normal tools. Missclassification
that occurs in the validation of moderate wear test
cases is more conservative, because the actual tool
that are moderate wear are incorrectly indicated as
severe wear, and none are incorrectly indicated as
normal tool. This characteristic is safer (fail safe
design) for monitoring tool conditions, because no
case detection is missed. Overall TCM accuracy for
3 level of tool wear is 89.98% from 459 test cases.
Multi-layer perceptron that has been trained
using 2 classes; normal tools and severe wear tools,
with appropriate threshold and post-processing
settings can be used to classify 3 level of tool wear.
Using moving average smoothing with period 4,
threshold -0.8 for normal tool and 0.8 threshold for
severe wear tool, the multi-layer perceptron can
classify severe wear, moderate wear, and normal
tool condition with an accuracy of 89.98% of 459
test case of validation dataset.
REFERENCES
Ahmad, R., Kamaruddin, S., 2012. A review of condition-
based maintenance decision-making. Eur. J. Ind. Eng.
6, 519.
Arendra, A., Akhmad, S., Winarso, K., Herianto, H., 2020.
Investigating pump cavitation based on audio sound
signature recognition using artificial neural network. J.
Phys. Conf. Ser. 1569.
Arendra, A., Herianto, H., 2020. Pre-processing for
vibration signals features extraction and selection in
real time investigating of CNC tool wear. J. Phys.
Conf. Ser. 1569.
Barraza, S.M. del C., 2017. Unsupervised Feature
Learning Applied to Condition Monitoring. Lulea
University of Technology, Sewden.
Benkedjouh, T., Zerhouni, N., Rechak, S., 2017. Bearings
prognostics based on blind sources separation and
robust correlation analysis. In: ICINCO 2017 -
CESIT 2020 - International Conference on Culture Heritage, Education, Sustainable Tourism, and Innovation Technologies
274

Proceedings of the 14th International Conference on
Informatics in Control, Automation and Robotics.
SCITEPRESS – Science and Technology Publications,
Lda, pp. 658–663.
Casoli, P., 2019. A Methodology Based on
Cyclostationary Analysis for Fault Detection of
Hydraulic Axial Piston Pumps. energies 11.
Casoli, P., Pastori, M., Scolari, F., Rundo, M., 2019. A
Vibration Signal-Based Method for Fault
Identification and Classification in Hydraulic Axial
Piston Pumps. energies 12.
Cheng, Y., Zhu, H., Hu, K., Wu, J., Shao, X., Wang, Y.,
2019. Multisensory Data-Driven Health Degradation
Monitoring of Machining Tools by Generalized
Multiclass Support Vector Machine. IEEE Access 7,
47102–47113.
Goti, A., Oyarbide-zubillaga, A., Alberdi, E., Sanchez, A.,
2019. Optimal Maintenance Thresholds to Perform
Preventive Actions by Using Multi-Objective
Evolutionary Algorithms. Appl. Sci. 9, 1–13.
He, Y., Huang, M., Sun, W., 2019. Tool wear status
recognition based on Mahalanobis distance. J. Eng.
2019, 8802–8805.
Huang, Z., Zhu, J., Lei, J., Li, X., Tian, F., 2019. Tool
Wear Predicting Based on Multisensory Raw Signals
Fusion by Reshaped Time Series Convolutional
Neural Network in Manufacturing. IEEE Access 7,
178640–178651.
Jemielniak, K., Urbański, T., Kossakowska, J., Bombiński,
S., 2012. Tool condition monitoring based on
numerous signal features. Int J Adv Manuf Technol
59, 73–81.
Junior, P., D’Addona, D.M., Aguiar, P., Teti, R., 2018.
Dressing Tool Condition Monitoring through
Impedance-Based Sensors: Part 2—Neural Networks
and K-Nearest Neighbor Classifier Approach. sensors
18.
Lembke, B., 2019. Bearing Diagnosis using Fault Signal
Enhancing Techniques and Data-driven Classification.
Linköping University, Sweden.
Leturiondo, U., Salgado, O., Galar, D., 2016. Test rig
model development and validation for the diagnosis of
rolling element bearings. In: 14th IMEKO TC10
Workshop Technical Diagnostics New Perspectives in
Measurements, Tools and Techniques for System’s
Reliability, Maintainability and Safety. Milan, Italy,
pp. 46–49.
Liu, Y., Guo, C., Zhao, J., Xie, H., Sun, W., 2010.
Application of hierarchical model method on open
CNC system’s behavior reconstruction. In: ICINCO
2010 - Proceedings of the 7th International Conference
on Informatics in Control, Automation and Robotics.
SCITEPRESS – Science and Technology Publications,
Lda, pp. 172–175.
Mei, J., Luo, M., Guo, J., Li, H., Zhang, D., 2018.
Analytical Modeling, Design and Performance
Evaluation of Chatter-Free Milling Cutter with
Alternating Pitch Variations. IEEE Access 6, 32367–
32375.
Mishra, M., 2015. Model-based Prognostics for Prediction
of Remaining Useful Life. Luleå University of
Technology Sweden.
Murat, Z., Brezak, D., Augustin, G., Majetic, D., 2017.
Frequency domain analysis of acoustic emission
signals in medical drill wear monitoring. In:
BIOSIGNALS 2017 - 10th International Conference
on Bio-Inspired Systems and Signal Processing,
Proceedings; Part of 10th International Joint
Conference on Biomedical Engineering Systems and
Technologies, BIOSTEC 2017. SCITEPRESS –
Science and Technology Publications, Lda, pp. 173–
177.
Pappachan, B.K., Tjahjowidodo, T., Wijaya, T., 2017.
Event classification from sensor data using spectral
analysis in robotic finishing processes. In:
SENSORNETS 2017 - Proceedings of the 6th
International Conference on Sensor Networks.
SCITEPRESS – Science and Technology Publications,
Lda, pp. 80–86.
Prasetyo, T., Amar, S., Arendra, A., Zam Zami, M.K.,
2018. On-line Tool Wear Detection on DCMT070204
Carbide Tool Tip Based on Noise Cutting Audio
Signal using Artificial Neural Network. J. Phys. Conf.
Ser. 953.
Rmili, W., Ouahabi, A., Serra, R., Leroy, R., 2016. An
automatic system based on vibratory analysis for
cutting tool wear monitoring. Measurement 77, 117–
123.
Sakthivel, N.R., Nair, B.B., Elangovan, M., Sugumaran,
V., Saravanmurugan, S., 2014. Comparison of
dimensionality reduction techniques for the fault
diagnosis of mono block centrifugal pump using
vibration signals Engineering Science and Technology
, an International Journal Comparison of
dimensionality reduction techniques for the fault .
Eng. Sci. Technol. an Int. J. 17, 30–38.
Teti, R., Jemielniak, K., O’Donnell, G., Dornfeld, D.,
2010. Advanced monitoring of machining operations.
CIRP Ann. - Manuf. Technol. 59, 717–739.
Tobon-Mejia, D. a. a, Medjaher, K., Zerhouni, N., 2012.
CNC machine tool’s wear diagnostic and prognostic
by using dynamic Bayesian networks. Mech. Syst.
Signal Process. 28, 167–182.
Wei, P., Wang, H., 2019. Evaluation method of spindle
performance degradation based on VMD and random
forests. J. Eng. 2019, 8862–8866.
Wiharto, Kusnanto, H., Herianto, 2015. Performance
Analysis of Multiclass Support Vector Machine
Classification for Diagnosis of Coronary Heart
Diseases. Int. J. Comput. Sci. Appl. 5.
Wiharto, W., Kusnanto, H., Herianto, H., 2016.
Intelligence System for Diagnosis Level of Coronary
Heart Disease with K-Star Algorithm. Healthc.
Inform. Res. 22.
Yau, H.-T., Chen, J.-L., Yu, B.-R., Yang, T.-J., 2014.
Development of 3D Simulation System for Multi-Axis
Turn-Mill Machining. In: Proceedings of the 4th
International Conference on Simulation and Modeling
Methodologies, Technologies and Applications
Post-Processing for Three Class of Tool Wear Prognosis using Two Class ANN Classifier based on Vibration of CNC Milling
275

(SIMULTECH-2014). SCITEPRESS – Science and
Technology Publications, Lda, pp. 717–724.
Zhou, C., Guo, K., Yang, B., Wang, H., Sun, J., Lu, L.,
2019. Singularity Analysis of Cutting Force and
Vibration for Tool Condition Monitoring in Milling.
IEEE Access 7, 134113–134124.
CESIT 2020 - International Conference on Culture Heritage, Education, Sustainable Tourism, and Innovation Technologies
276
