
Selecting Energy Carrier Combinations using Energy Hub Model
Weny Findiastuti, Retno Indriartiningtias, Rullie Annisa, and Mufidatul Latifah
Department of Industrial Engineering, University of Trunojoyo Madura
mufidatul28@gmail.com
Keywords: Energy Carrier, Energy Hub, Green
Abstract: This paper aims to select the energy-carrier combination for minimal total consumption of 5 processes.
Basic multi input-output Energy Hub (EH) concept has been simply modified into multi input-output for
multi process purposes. The modified concept affects its matrix model development which represent each
combination for multi process. Given 3 scenarios, 3 energy carriers and 5 processes involving effectivity
percentages of each energy carrier and process for a certain power plant. Considered energy carriers are
natural gas, water, and electricity which are processed by processes P1 to P5. The result shows that minimal
energy consumed for the processes is scenario 3with the process of 100% natural gas, 30% water and 30%
electricity effectiveness. Scenario 3 has total Natural Gas consumed for 261.63 MMBtu/Ton, 2,069,088.5
m
3
water, and 33,298,620.6 kW electricity.
1 INTRODUCTION
Energy scarcity has remained challenging high-price
energy problem. It is evidenced that using various
resources of energy generally becomes common
approach dealing with high price of electricity.
These common problems refer to the term of Energy
Hub (EH). It was first presented by (Geidl and
Andersson, 2007)to assemble many different energy
carriers and assist in obtaining economic
combination of those energy.
Energy hub (EH) approach proposes coupling
model among different energy carriers. The model
combines multi energy-carrier for optimized power
consumption (Geidl and Andersson,
2007).Correspondingly, for green manufacturing
reasons, EH is also claimed to reduce emission by
optimizing energy consumption and combining
renewable and unrenewable energy resources. Some
studies done by (Pazouki, Haghifam and Olamaei,
2013; Le Guen et al., 2017; Lin et al., 2017; Wang
et al., 2018; Miao et al., 2020; Ivatloo, Abapoura
and Shafiee, 2021) proposed combinations of
renewable and unrenewable energies using EH for
green manufacturing reasons. EH concept was also
introducedas a system model(Geidl and Andersson,
2007).As a system description, energy hub as a
process of integrating, conversing, and combining
multi-energy inputs into desirable combinations of
outputs (Zhang et al., 2015).
EH concept of coupling various energy carriers
have been wide-ranging used to simulate cost and
consumed energy carriers. Previous studies in EH
were about minimizing cost of multi energy e.g.
(Kienzle, Ahčin and Andersson, 2011; Parisio,
Vecchio and Vaccaro, 2012; Adamek, Arnold and
G. Andersson, 2014), planning and scheduling each
energy carriers used done with EH by (Pazouki,
Haghifam and Olamaei, 2013). Accommodating
uncertainty was also done by (Kienzle, Ahčin and
Andersson, 2011). In broader level, combining EH
for multi agent such as commercial agent,
environmental agent, demand agent, hub-element
agent, and integrated dispatch agent was completed
by (Lin et al., 2016, 2017).
Combining different energy carriers with EH
offers well organized integration of renewable and
unrenewable energies as well as lowering total
energy operation cost(Jiang and Hong, 2013; Du et
al., 2016). However, planning a combination of
multi energy carriers requires well-planned and
robust scenario to provide the profitable one. An
efficient energy carrier combinations outputs depend
on each conversion effectiveness within the different
processes in the hub.
Given 3 scenarios of natural gas, water, and
electricity energy carriers combinations of a
generator plant process, this paper aimed to analyze
256
Findiastuti, W., Indriartiningtias, R., Annisa, R. and Latifah, M.
Selecting Energy Carrier Combinations using Energy Hub Model.
DOI: 10.5220/0010307200003051
In Proceedings of the International Conference on Culture Heritage, Education, Sustainable Tourism, and Innovation Technologies (CESIT 2020), pages 256-261
ISBN: 978-989-758-501-2
Copyright
c
2022 by SCITEPRESS – Science and Technology Publications, Lda. All rights reserved
and decide most minimal energy consumed by each
energy carriers. Therefore, basic multi input-output
EH model has been simply modified into that of
model for multi-process purpose. Modification has
been done on vector matrix of input and output of
matrix model to encounter unprocessed energy
carrier on any converter. For example, natural gas
energy carrier cannot be processed on Cooling
Tower which only processes water energy carrier.
Similar study on selecting energy carrier
processes was conducted by (Seyyed Mostafa
Nosratabadi, Jahandide and Nejad, 2020) which
simulated planning of electricity, gas, cooling
energy, and water for bus distribution network
energy-consumption. The research result proposed
minimal cost for bus distribution tes network. A
study was also done by (Pazouki, Haghifam and
Olamaei, 2013) in planning and scheduling EH
research which resulted robust model for amount of
each energy, which processes are used, and when
processes are done. (Zhang et al., 2015) generated
coupled energy carriers models associating with
reliability, efficiency and emission. Simplified by
given percentage of each energy carriers in
scenarios, the research selected optimal model by
comparing total energy consumed each scenario
model. Optimal planning and strategies for
electricity and gas were conducted by (Ghanbari,
Karimi and Jadid, 2020) as objectives proposed by
the paper.
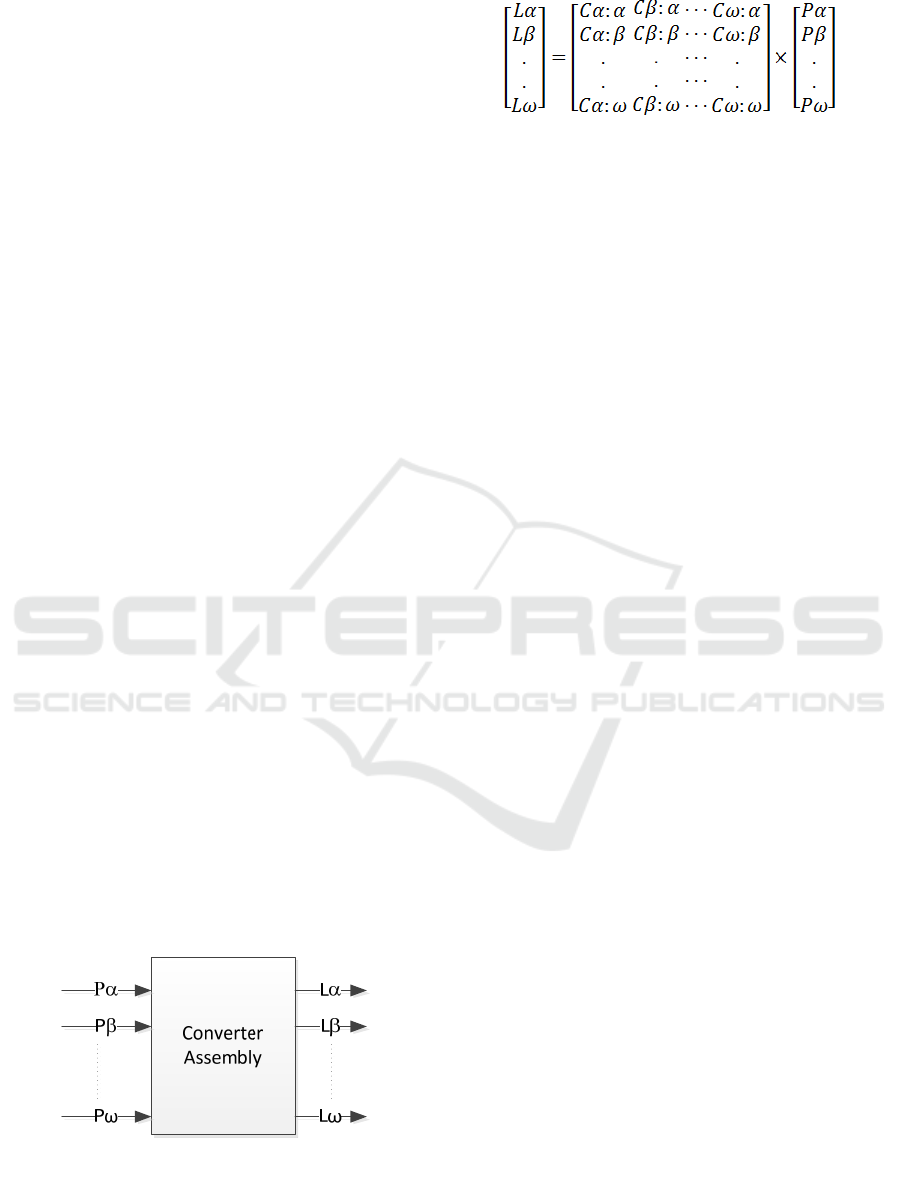
2 ENERGY HUB (EH)
Figure 1 describes EH as a simple system that
processes input L into output P. The process refers
to converter assembly box. It is a basic multi input-
output EH system developed by(Geidl and
Andersson, 2007). Symbol α,β,..ω denotes energy
carriers. For the system concept, matrix model also
was stated as in (1):
Figure 1. Multi input-output EH system
(1)
Equation (1) expresses matrix model of multi
input-output EH system (Geidl and Andersson,
2007). Matrix C is coupling matrix for energy carrier
conversion. It represents how effective energy
conversion from one energy carrier into another one.
In equation (1), C𝛼:β denotes coupling factor for
conversion of energy carrier α to β. For example,
C𝛼:β = 0.3 means conversion energy carrier 𝛼 into
energy carrier 𝛽 is 0.3 effective, therefore 𝛽 = 0.3 𝛼.
Generally, this coupling factor represents
effectiveness of conversion process. Thus, output Lβ
represents conversion output of energy carrier α into
β and can be expressed as in equation (2):
Lβ = Cαβ x Pα (2)
3 RESEARCH FRAMEWORK
Based on EH concept developed by (Geidl and
Andersson, 2007), this research framework has been
built as a system concept. It begins with problem
definition and developing a EH system according to
the problem (see Figure 2). Here, entities of the
system were identified including inputs, outputs and
the processes.
Inputs: Energy carriers involved that will be
transformed and/or combined such as
electricity, water, and natural gas
energy carriers. Inputs were stated as
loads or each energy amount. These
energies produce electricity power,
cooling, and heating which are used as
combinations in outputs
Outputs: Energy carriers inputs that have been
transformed and/or combined and
stated as loads or each combination
amount. They are formed as power
that is resulted from energies
combination.
Process: Process of transforming and/or
combination energy carriers. The
process works depend on effectiveness
of each transformation and
combination process. For example,
electricity and natural gas are
combined as 100% and 30% into
Selecting Energy Carrier Combinations using Energy Hub Model
257
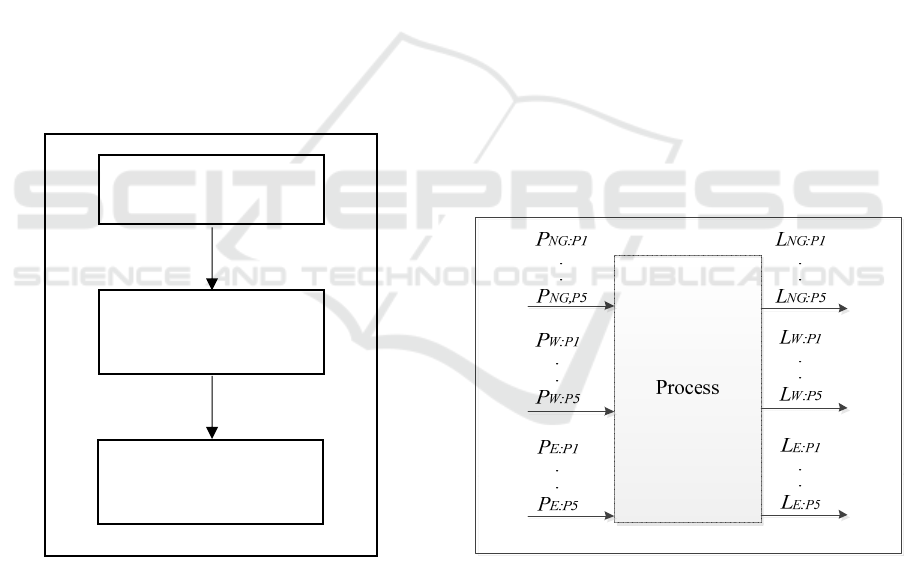
power. 100% means electricity is fully
transformed into power, while natural
gas is only 30% transformed into
power.
Next step of the framework is building a matrix
mathematical model as stated as equation 1. Matrix
L represents outputs of EH system process, matrix P
represents inputs, and matric C is effectiveness of
the process.
Third step is assessing each combination or
energy carriers and determine maximal power result
for minimal energy consumed. In this step, some of
research may need optimization method added as
studies done by (Pazouki, Haghifam and Olamaei,
2013; Seyyed Mostafa Nosratabadi, Jahandide and
Nejad, 2020) that used mixed-integer linear
programming (MILP), (Vahid Pakdel, Sohrabi and
Mohammadi-Ivatloo, 2020) that used fuzzy
approach, and (Mansouri et al., 2020) that used
particle swarm optimization (PSO). However, this
paper does not include the optimation method due to
objectives of the paper were completed by the
matrix mathematical model.
Figure 2 Research Framework
4 EH MATHEMATICAL MODEL
DEVELOPMENT
Basic EH mathematical model written as equation
(1) and (2) needs to be adapted to existing problem.
For the next sub section is developing EH
mathematical model in accordance with the problem.
4.1 System and Problem Definition
X company is a green manufacturing committed
company in renewable and unrenewable energy
resources consumption. Electricity (E), Natural Gas
(NG) and Water Energy (WE) carriers which are
processed for Lime Softening, Cooling,
Demineralize Plant, Gas Generator, and Heat Boiler
noted as P1, P2, P3, P4, and P5 respectively.
However, for the last two years they have been
facing inconsistent water resources that need to be
replaced by other energy carriers, i.e. gas and
electricity.3 Scenarios of combination of three
energy carriers with their percentage of effectiveness
were developed by company’s engineers for energy
generation.These scenarios were defined as:
Scenario 1: Process of 100% natural gas, 30%
water, and 50% electricity effectiveness,
Scenario 2: Process of 100% natural gas, 50%
water, and 30% electricity effectiveness,
Scenario 3: Process of 100% natural gas, 30%
water and 30% electricity effectiveness.
Concerning this interacting energy carrier system
problem, the identified problem for this paper is
selecting the developed scenarios for minimal
consumed energy on outputs. Selected scenario will
be planned for the energy carriers combinations.
Figure 3 Modified EH system
Referring to EH model built by(Geidl and
Andersson, 2007), energy system showed in
Figure.1 and Figure 3 is a modified basic EH system
adapted for the X company problem. The system
converts multi-input energy carriers of PNG, PW,
and PE into multi-output energies consumed LNG,
LW, LE by combining 5 processes P1 to P5.
On Inputs, PNG:P1,…,PNG:P5,
PW:P1,…,PW:P5, and PE:P1,…,PE:P5 denote
Problem and System
Definition
Matrix Mathematical
Model Development
Assessing The
Mathematical Model
Resul
t
CESIT 2020 - International Conference on Culture Heritage, Education, Sustainable Tourism, and Innovation Technologies
258
inputs or available energy carriers which through
processes P1 to P5. PNG:P1represents input of
energy available from Natural Gas that processed
through P1.
Outputs represent consumed energies of that on
processes P1 to P5while outputs LNG, LW, LE
represent consumed energy of Natural Gas, Water,
and Electricity by processes P1 toP5. Accordingly,
LNG:P1,…,LNG:P5, LW:P1,…LW:P5, and
LE:P1,…LEP5 denote inputs or available energy
carriers Natural Gas (NG), Water (W), and
Electricity (E) on processes P1 to P5.
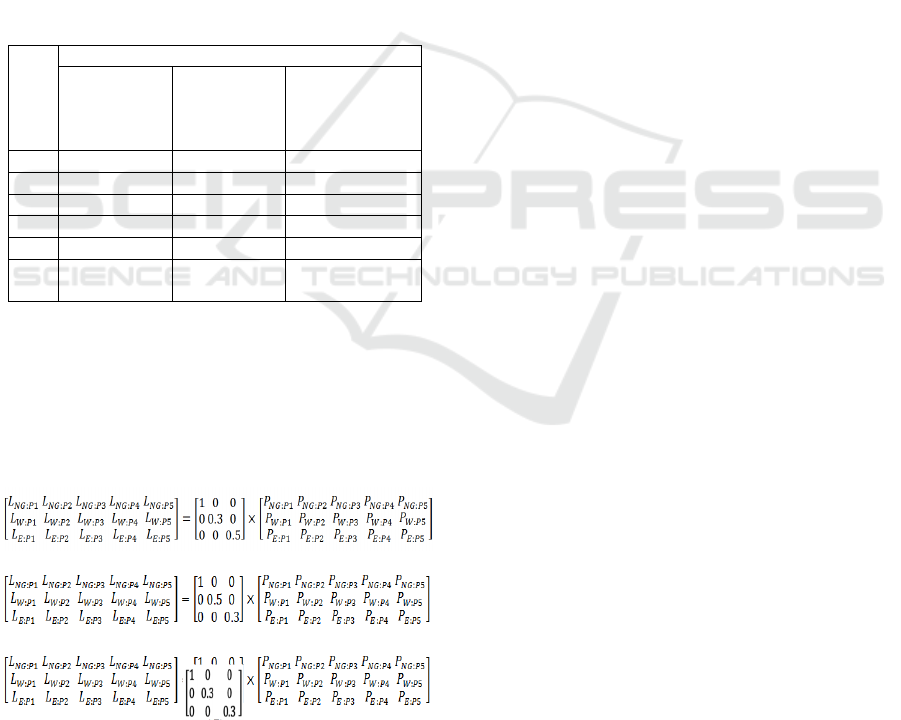
Table 1 lists available energy-carriers on
processes P1 to P5 as input in the system. Number of
0 means that of energy carrier is not available for
that of process. For example, Natural Gas is not
available on process P1, but then 54.7 MMBtu/Ton
of natural gas available for P4.
Table 1: Available Energy for Each Process
Pro
ces
s
Available Ener
gy
Carriers
Natural Gas
(NG)
(MMBtu/To
n
)
Water (W)
(m
3
)
Electricity (E)
(kW)
P1 0 3,308,534 628,737
P2 0 3,521,105 98,911,128
P3 0 63,990 3,833,899
P4 54.7 0 7,621,638
P5 206.92 0 0
Tot
al
261.63 6,893,629 110,995,402
4.2 Adapted EH Mathematical Model
According to given scenarios and vector matrix built
by (Geidl and Andersson, 2007), mathematical vector
model of developed EH system are stated as in
equation (3), (4), and (5) respectively for scenario
1,2, and 3.
(3)
(4)
(5)
Differences in scenarios EH model are stated in
factor couple matrix which stated each percentage of
energy carriers. Here, in equation (3) which
represents scenario 1, numbers of 1, 0.3, and 0.5 at
factor couple matrix represent effectiveness of
natural gas, water and electricity. 1 means that input
is full effectively processed into output. 0.3 means
only 30% of input is effectively processed into input,
while 0.5 is for 50% effective process into output.
Computed using equation (3) and input data in
Table.1, output L
NG
:
P1,
…L
NG:P5
of scenario
1
can be
stated as in equation (6).
L
NG:P1
= (1x P
NG:P1
) + 0 + 0 = 0
L
NG:P2
= (1x P
NG:P2
) + 0 + 0 = 0
L
NG:P3
= (1x P
NG:P3
) + 0 + 0 = 0
L
NG:P4
= (1x P
NG:P4
) + 0 + 0 = 54.71
L
NG:P5
= (1 x P
NG:P5
) + 0 + 0 = 206.92
(6)
Number of 0 for LNG:P1,…LNG:P3 is a result
that natural gas is not processed in P1, P2, P3. Then,
total output or energy consumed for process P1 to P5
using natural gas is 261.63 MMBtu/Ton.
Accordingly, output L
W
and L
E
for equation (3) for
scenario 1can be also stated as in equation (7) and
equation (8):
L
W:P1
= 0+(0.3x P
W:P1
)+0 = 0.3 x 3,308,534 =
992,560
L
W:P2
= 0+(0.3 x P
W:P2
)+0 = 0.3 x 3,521,105
=1,056,331
L
W:P3
= 0+(0.3 x P
W:P3
)+0 = 0.3 x 63,990 = 19,177
L
W:P4
= 0+(0.3 x P
W:P4
)+0 = 0
L
W:P5
=0+(0.3x P
W:P5
)+0 = 0
(7)
Equation (7) calculated scenario 1 for Water (W)
energy carrier. First line of the equations represents
calculation of input PW 3,308,534 m
3
of water
energy carrier processed by P1 into output LW with
effectiveness of 30% and resulted output of 992,560
m
3
water energy carrier consumed.
L
E:P1
=0+0+(0.5x P
E:P1
)= 0.5 x 628,737 =
314,368.5
L
E:P2
=0+0+(0.5x P
E:P2
)=0.5 x 98,911,128=
49,455,564
L
E:P3
=0+0+(0.5xP
E:P3
) = 0.5 x 3,833,899=
1,916,949.5
L
E:P4
=0+0+(0.5xP
E:P4
)=0.5x7,621,638=3,810,81
9
L
E:P5
= 0+0+(0.5 x P
E:P5
) = 0
(8)
Equation (8) calculated scenario 1 for Electricity
(E) energy carrier. First line of the equations
represents calculation of input P
E
628,737 kW of
Electricity energy carrier processed by P1 into
output L
E
with effectiveness of 50% and resulted
output of 314,368.5 kW Electricity energy carrier
consumed.
Selecting Energy Carrier Combinations using Energy Hub Model
259
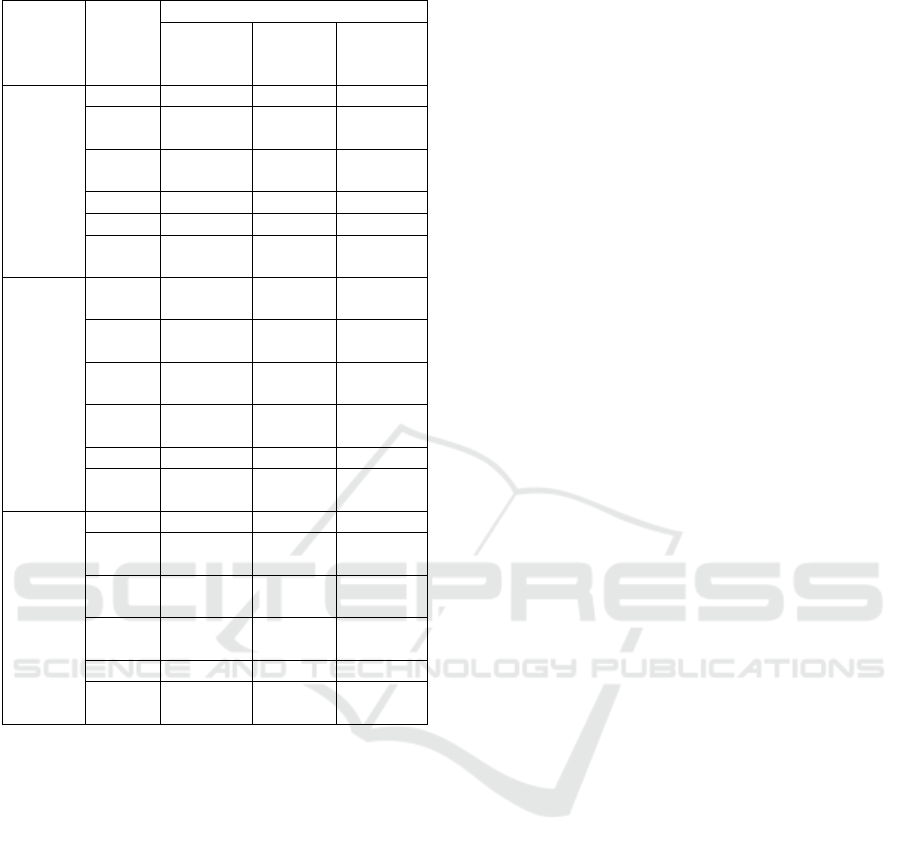
Table 2. EH Output for Scenario 1,2, and 3
Scenario Process
Ener
gy
Natural
Gas(MMB
tu/Ton
)
Water
(m
3
)
Electricity
(kW)
1
P1 0 992,560 314,368.5
P2 0 1,056,33
1
49,455,56
4
P3 0 19,177 1,916,949.
5
P4 54.7 0 3,810,819
P5 206.92 0 0
Total 261.63 2,069,08
8.5
55,497,70
1
2
P1 0 1,654,26
7
188,621.1
P2 0 1,760,55
2.5
29,673,33
8.4
P3 0 31,995 1,150,169.
7
P4 54.7 0 2,286,491.
4
P5 206.92 0 0
Total 261.63 3,446,81
4.5
33,298,62
0.6
3
P1 0 992,560 188,621.1
P2 0 1,056,33
1
29,673,33
8.4
P3 0 19,177 1,150,169.
7
P4 54.7 0 2,286,491.
4
P5 206.92 0 0
Total 261.63 2,069,08
8.5
33,298,62
0.6
5 RESULTS
Table 2. lists output of EH Model for scenario 1,2,
and 3 as a result of matrix in equation (3) for
scenario 1, equation (4) for scenario 2, and equation
(5) for scenario 3. It shows results of processes
P1,…,P2 for all scenarios as explained as:
a. Natural Gas energy carrier,
All scenarios resulted the same same
consumed natural gas energy carriers 261.63
MMBtu/ton.
b. Water energy carrier,
Scenario 1 and 3 resulted the same energy
consumed of 2,069,088.5 m
3
, and higher
energy consumed of 3,446,814.5 m
3
for
scenario 2
c. Electricity energy carrier,
For electricity energy carrier scenario 1
resulted highest energy consumed of
55,597,701kW and the same energy consumed
of 33,298,620.6 kW for scenario 2 and 3.
For these results, scenario 1 and 3 are chosen for
the same water energy consumed. At the same
condition, scenario 3 has lowest energy consumed of
electricity energy carrier. In context of minimizing
energy consumed of all scenarios, it can be
concluded that scenario 3 has lowest energy
consumed for all energy carrierswith . As listed at
Table 2, scenario 3 has total Natural Gas consumed
for 261.63 MMBtu/Ton, 2,069,088.5 m
3
water, and
33,298,620.6 kW electricity with process of 100%
natural gas, 30% water and 30% electricity
effectiveness
6 CONCLUSION
This paper selects minimal energy consumed which
involved 3 energy carrier i.e. Natural Gas (NG),
Water (W), and Electricity (E) and 5 different
processes i.e. Lime Softening (P1), Cooling (P2),
Demineralizing Plant (P3), Gas Generator (P4), and
Heat Boiler(P5). Combination of energy carriers and
processes are provided as 3 scenarios of
combination’s percentage of effectiveness. Based on
EH concept developed by (Geidl and Andersson,
2007), research framework was built to solve the
problem.
Problem system were built with amount of
energies available as inputs and energies consumed
as outputs. Basic mathematical matrix model of EH
Model has been extended for multi process purpose
based on Table 1.
Using 3 equations of (3), (4), and (5) represented
3 scenarios policies in each energy carrier
percentage of effectiveness, the result showed that
scenario 3 consumed most minimal energy for total
process. scenario 3 has total Natural Gas consumed
for 261.63 MMBtu/Ton, 2,069,088.5 m
3
water, and
33,298,620.6 kW electricity with process of 100%
natural gas, 30% water and 30% electricity
effectiveness.
REFERENCES
Adamek, F., Arnold, M. and G. Andersson (2014) ‘On
Decisive Storage Parameters for Minimizing Energy
Supply Costs in Multicarrier Energy Systems’, IEEE
Transactions on Sustainable Energy, 5, pp. 102–109.
Du, E. et al. (2016) ‘Exploring the flexibility of CSP for
wind power integration using interval optimization’,
IEEE Power and Energy Society General Meeting
CESIT 2020 - International Conference on Culture Heritage, Education, Sustainable Tourism, and Innovation Technologies
260

(PESGM), pp. 1–6.
Geidl, M. and Andersson, G. (2007) ‘Optimal power flow
of multiple energy carriers’, IEEE Transaction on
Power System, 22, pp. 145–155. doi:
10.1109/PESGM.2016.7741940.
Ghanbari, A., Karimi, H. and Jadid, S. (2020) ‘Optimal
planning and operation of multi-carrier networked
microgrids considering multi-energy hubs in
distribution networks’, Energy, 204, p. 117936. doi:
10.1016/j.energy.2020.117936.
Le Guen, M. et al. (2017) ‘Achieving energy sustainability
in future neighborhoods through building
refurbishment and energy hub concept: A case study
in Hemberg-Switzerland’, Energy Procedia, 122, pp.
265–270. doi: 10.1016/j.egypro.2017.07.320.
Ivatloo, M. Z. O. B. M., Abapoura, M. and Shafiee, M.
(2021) ‘Techno-economic and environmental
assessment of the coordinated operation of regional
grid-connected energy hubs considering high
penetration of wind power’, Journal of Cleaner
Production, 280 part 1(124275).
Jiang, Q. and Hong, H. (2013) ‘Wavelet-Based Capacity
Configuration and Coordinated Control of Hybrid
Energy Storage System for Smoothing Out Wind
Power Fluctuations’, IEEE Transactions on Power
Systems, 28(2), pp. 1363–1372.
Kienzle, F., Ahčin, P. and Andersson, G. (2011) ‘Valuing
Investments in Multi-Energy Conversion, Storage, and
Demand-Side Management Systems Under
Uncertainty’, IEEE Transactions on Sustainable
Energy, 2(2), pp. 194–202.
Lin, H. et al. (2016) ‘Agent-based Modeling of Electricity
Consumption in an Office Building under a Tiered
Pricing Mechanism’, Energy Procedia, 104, pp. 329–
335. doi: 10.1016/j.egypro.2016.12.056.
Lin, H. et al. (2017) ‘A multi-agent based optimization
architecture for energy hub operation’, Energy
Procedia, 142, pp. 2158–2164. doi:
10.1016/j.egypro.2017.12.621.
Mansouri, S. A. et al. (2020) ‘Two-stage stochastic
framework for energy hubs planning considering
demand response programs’, Energy, 206, p. 118124.
doi: 10.1016/j.energy.2020.118124.
Miao, P. et al. (2020) ‘Optimal emission management of
photovoltaic and wind generation based energy hub
system using compromise programming’, Journal of
Cleaner Production, p. 124333. doi:
10.1016/j.jclepro.2020.124333.
Parisio, A., Vecchio, C. Del and Vaccaro, A. (2012) ‘A
robust optimization approach to energy hub
management’, International Journal of Electrical
Power & Energy Systems, 42(1), pp. 98–104.
Pazouki, S., Haghifam, M. R. and Olamaei, J. (2013)
‘Economical scheduling of multi carrier energy
systems integrating Renewable, Energy Storage and
Demand Response under Energy Hub approach’,
Smart Grid Conference 2013, SGC 2013, pp. 80–84.
doi: 10.1109/SGC.2013.6733803.
Seyyed Mostafa Nosratabadi, Jahandide, M. and Nejad, R.
K. (2020) ‘Simultaneous planning of energy carriers
by employing efficient storages within main and
auxiliary energy hubs via a comprehensive MILP
modeling in distribution network’, Journal of Energy
Storage, 30(101585).
Vahid Pakdel, M. J., Sohrabi, F. and Mohammadi-Ivatloo,
B. (2020) ‘Multi-objective optimization of energy and
water management in networked hubs considering
transactive energy’, Journal of Cleaner Production,
266, p. 121936. doi: 10.1016/j.jclepro.2020.121936.
Wang, Y. et al. (2018) ‘Automatic and linearized
modeling of energy hub and its flexibility analysis’,
Applied Energy, 211(November 2017), pp. 705–714.
doi: 10.1016/j.apenergy.2017.10.125.
Zhang, X. et al. (2015) ‘Optimal Expansion Planning of
Energy Hub with Multiple Energy Infrastructures’,
IEEE Transactions on Smart Grid, 6(5), pp. 2302–
2311. doi: 10.1109/TSG.2015.2390640.
Selecting Energy Carrier Combinations using Energy Hub Model
261
