
Design of Solar Cell Potential Devices in Real Time based on the
Internet of Things (IoT)
Hairil Budiarto
1
, Weny Findiastuti
2
, Rullie Annisa
2
, Ach. Dafid
1
1
University Of Trunojoyo Madura, Departement of Mechatronics Engineering
2
University of Trunojoyo Madura, Departement of Industrial Engineering
ach.dafid@trunojoyo.ac.id
Keywords: Solar Cell, Light Intensity, Temperature, Internet of Things.
Abstract: Renewable energy sources, ranging from hydro power, wind power (wind), solar power, sea water wave
power and others. The potential for renewable energy sources in Madura is very high, but not all places have
the potential to be used as electricity generation. Before a place is used as a power plant with renewable energy
sources, it is necessary to know the potential characteristics of an area that will become the reference for the
generator. Solar power plants are influenced by several factors such as light intensity, temperature and several
other factors. In this problem what will be proven is the effect of temperature and light intensity on the voltage
generated by the solar cell. The temperature and light intensity are known using sensors. Data from sensor
readings is managed in the form of an information system that collects in one server. Tools that have been
designed are ergonomically designed, both in terms of material selection, easy to assemble and assemble,
space efficiency, comfort and safety. The data that has been obtained from the test results in this study show
that the higher the temperature received by the solar cell, the lower the resulting voltage. This condition is
inversely proportional to the light intensity, the higher the light intensity, the higher the voltage generated by
the solar cell. This research has shown that the temperature received by the solar cell is not the basis for the
higher the resulting voltage, but the light intensity that becomes the input of the resulting light voltage.
1 INTRODUCTION
Energy sources in Indonesia are mostly non-
renewable energy sources that come from fossil
energy, because their availability cannot be
regenerated. Oil reserves in 2013 were 3.7 trillion
barrels, producing or drilling 882 thousand barrels per
day. Renewable energy is an alternative energy
source to meet energy needs, the potential for new
renewable energy is very significant. Indonesia has
renewable energy potential in the form of 75,091 MW
of geothermal energy, 29,164 MW of micro hydro,
480 KWH / M2 / day of solar power, 49,810 MW of
biomass.
Renewable energy has a very important role in
meeting energy needs considering that the source is
very abundant. This is because the use of fuel for
conventional power plants in the long term will
deplete the depletion of oil, gas and coal resources
and can also cause environmental pollution. One of
the efforts that has been developed is the Solar Power
Plant (PLTS).
PLTS or better known as solar cells (photovoltaic
cells) will be more attractive because they can be used
for various relevant purposes and in various places
such as offices, factories, housing, and others. In
Indonesia, which is a tropical area, has a very large
potential for solar energy with an average daily
insolation of 4.5-4.8 KWh / m² / day. However, the
electrical energy produced by solar cells is greatly
influenced by the intensity of sunlight received by the
system. So that the utilization of electric energy can
be used optimally, it is necessary to have a hybrid
system with PLN electricity nets.
During a clear day, solar radiation can reach 1000
watts per square meter. If a semiconductor device
covering an area of one square meter has an efficiency
of 10%, then this solar cell module is able to provide
electric power of 100 watts. Commercial solar cell
modules have efficiencies ranging from 5% to 15%
depending on the constituent materials. Crystalline
silicon type is a type of solar cell device that has high
efficiency even though the manufacturing cost is
relatively more expensive than other types of solar
Budiarto, H., Findiastuti, W., Annisa, R. and David, A.
Design of Solar Cell Potential Devices in Real Time based on the Internet of Things (IoT).
DOI: 10.5220/0010305700003051
In Proceedings of the International Conference on Culture Heritage, Education, Sustainable Tourism, and Innovation Technologies (CESIT 2020), pages 173-178
ISBN: 978-989-758-501-2
Copyright
c
2022 by SCITEPRESS – Science and Technology Publications, Lda. All rights reserved
173
cells. The most important problem for realizing solar
cells as an alternative energy source is the efficiency
of solar cell devices and the cost of manufacture.
Efficiency is defined as the ratio between the electric
power generated by the solar cell device compared to
the amount of light energy received from the sun's
rays. Solar power plants (PLTS) actually depend on
the efficiency of energy conversion and the
concentration of sunlight received by these cells
(Awang Riyadi, 2008).
A solar cell in producing electrical energy (energy
from sunlight into photons) does not depend on the
size of the silicon field, and will constantly produce
energy in the range of ± 0.5 volts maximum 600 mV
at 2A, with the power of solar solar radiation 1000 W
/ m2 = "1 Sun ”will produce electric current (I) of
about 30 mA / cm2 per solar cell. The factor of the
first operation, in order to obtain the maximum value,
depends on the ambient air temperature, solar cells
can operate optimally if the cell temperature remains
normal (at 25
o
C), the increase in temperature is higher
than the normal temperature in the cell which will
lower the voltage value (Voc ). Each 10 Celsius (from
25
o
C) increase in the temperature of the Solar Cell
will decrease approximately 0.4% in the total power
generated or will decrease twice (2x) for the increase
in Cell temperature per 10
o
C. (Source: Solar
Electricity, Lorenzo Eduardo.)
Both solar radiation, solar radiation on earth and
various locations vary, and very much depends on the
state of the solar spectrum to the earth. The three solar
insolation of the sun will have a lot of effect on
current (I) a little on the voltage. Wind speed blowing,
wind speed around the location of the solar cell array
can help cool the surface temperature of the solar cell
array glass.
The four conditions of the earth's atmosphere, the
state of the earth's atmosphere is cloudy, cloudy, the
types of airborne dust particles, smoke, air vapor
(Rh), fog and pollution determine the maximum
electric current results from a row of solar cells. The
five orientation of the panel or array of solar cells.
The optimum orientation of the solar cell series
(array) towards the sun is important so that the panel
/ row of solar cells can produce maximum energy.
Apart from the orientation direction, the tilt angle of
the panel / row of solar cells also greatly affects the
maximum energy yield. The six positions of the solar
cell (array) to the sun (tilt angle), Maintaining
sunlight falling onto a surface of the solar cell panels
perpendicularly will get a maximum energy of ± 1000
W / m2 or 1 kW / m2.
The mistake that has become common in society
is that if an area is very hot, the potential for solar
power generation is very potential, this wrong
assumption is the basis for this research, another goal
is to create a solar power information system tool in
real time, so that the output of this research becomes
concrete data sources for the realization of the energy
sector, particularly renewable energy.
2 METHODS
This research was conducted at the Industrial
Engineering Laboratory. The designed frame is
analyzed according to the ergonomic method of a
device. The system to be implanted in the device is
carried out at the Mechatronics Engineering
Laboratory by carrying out several activities such as
sensor installation, sensor testing and method testing
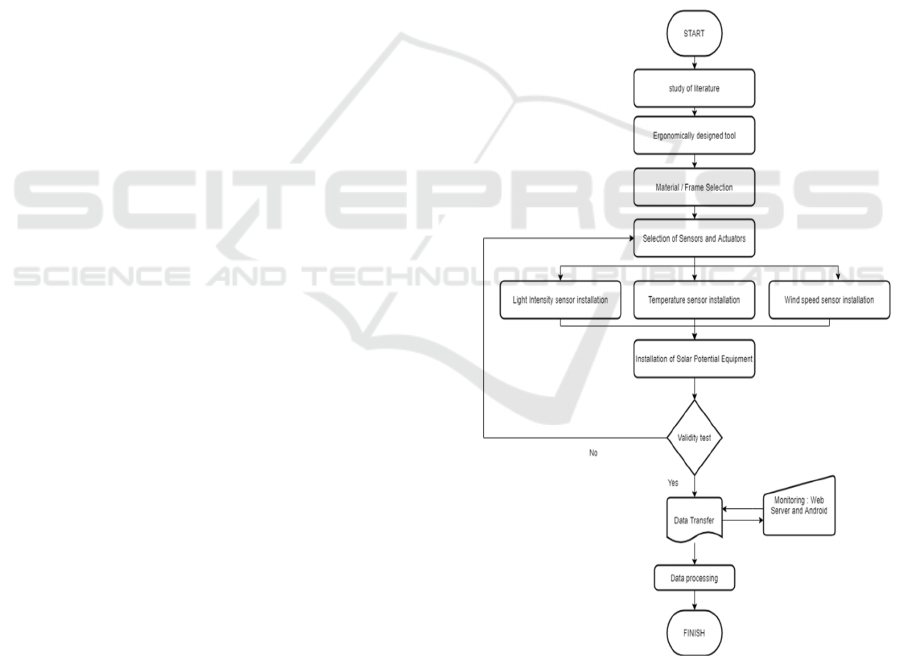
of the system. As shown in Figure 1.
Figure 1: Research flow diagram.
The flow chart above shows the research stages
and the system on the tool. The tool design will be
ergonomically designed, easy to assemble and install,
and pay attention to the comfort and safety factors,
CESIT 2020 - International Conference on Culture Heritage, Education, Sustainable Tourism, and Innovation Technologies
174
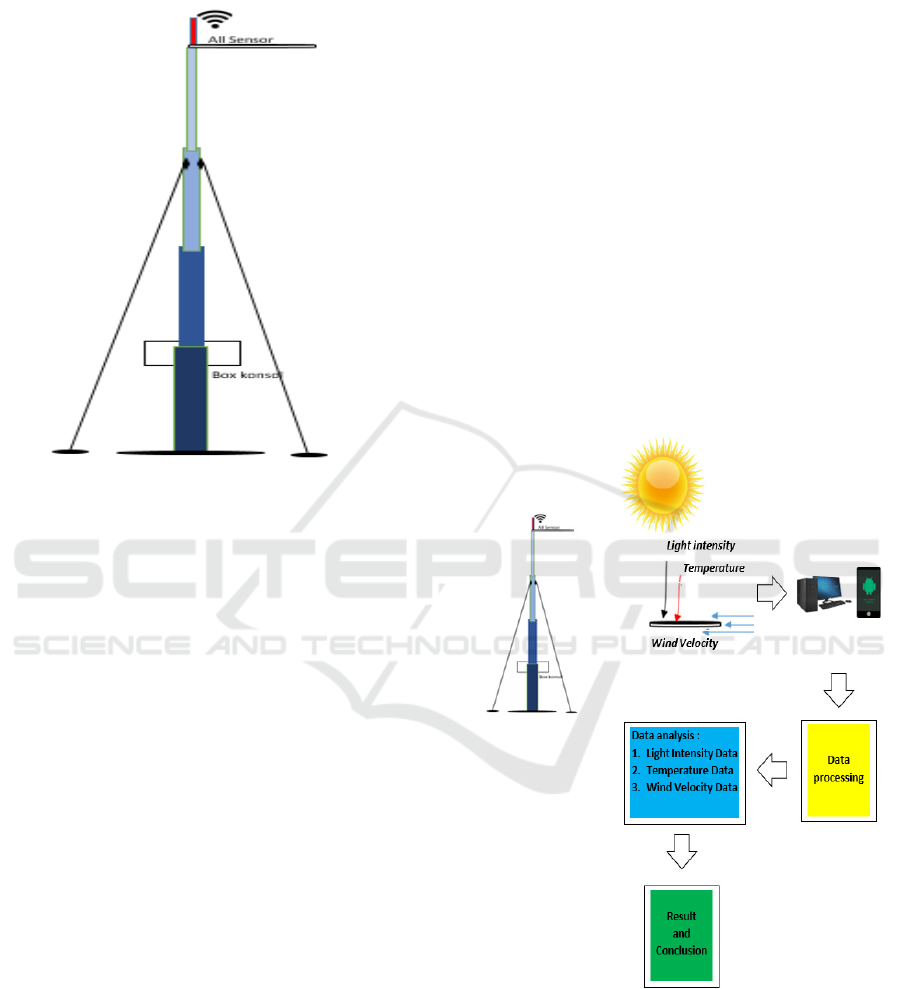
the potential tool models to be made are presented in
Figure 2.
Figure 2: The tool model to be made.
As input power will use a battery that is connected
in series, battery charging is done every week, or
according to the capabilities of the battery.
Research uses various types of sensors, some of
these sensors include:
a. Temperature Sensor
The function of the temperature sensor is to
analyze the heat of the surrounding air, because
if it is too hot it will reduce the solar cell's ability
to produce voltage and current.
b. Wind speed sensor
The wind speed sensor (anemometer) is used to
obtain real time wind speed data, this data is
useful as a cooling calculation in the solar cell
area.
c. Lux meter sensor
Lux meter sensor, is used to obtain real time light
intensity data, which is used as input to the solar
cell.
In general, the flow chart of the work tool system
and description will be described in detail as Figure
3.
Information:
1. Data from several sensors, in several places
(areas) will be sent via the internet, and will
appear on the web server and android, users can
monitor in real time. System maintenance can be
done manually if reading data is problematic.
2. The web server or Android is the interface for the
data sent by all sensors.
3. Forecasting data from solar cell tools will be
done manually every month, after the data
obtained has passed the normalization process
and the data is accurate.
4. Data analysis, the resulting data are:
a. Light intensity data (lux meter) is used for
solar cells to absorb energy, for how many
hours the energy is absorbed
b. The temperature data, which is used to
determine the heat absorbed by the solar
cell, is related to the voltage drop.
c. Wind speed data, used for cooling
calculations on solar cells due to ambient air
temperature, is used to overcome voltage
drop.
The conclusion is that it is feasible or not feasible for
the area to use solar cell power plants, it is possible to
use other types of new renewable energy sources
(wind / wind, micro hydro, sea waves, etc.).
Figure 3: System Flowchart.
Design of Solar Cell Potential Devices in Real Time based on the Internet of Things (IoT)
175
3 RESULT
The design of a solar energy potential tool uses
several sensors and actuators, the sensors used are:
a. Lux meter sensor, is used to detect the intensity
of sunlight captured by solar panels. The solar
panels used are poly solar panels with an output
voltage of 10 WP (watt peak).
b. Anemometer sensor, is a sensor to detect wind
speed, in this research group's research, that
wind speed will be used as a cooling medium
in solar panels, the form of cooling media will
be used by students in the proposal in the final
project that will be submitted.
c. Temperature and humidity sensors are sensors
used to determine the temperature and
humidity of the air around the solar panel.
On the pole, there are several sensors and
actuators, namely a 10 WP solar panel, a console box
containing a microcontroller and a wifi module
because data in the form of land temperature, air
humidity, light intensity, and wind speed will be
transferred to the web and monitor the web server will
be used, so that monitoring can be carried out
continuously and can be accessed via Android,
console box and several sensors installed on the pole
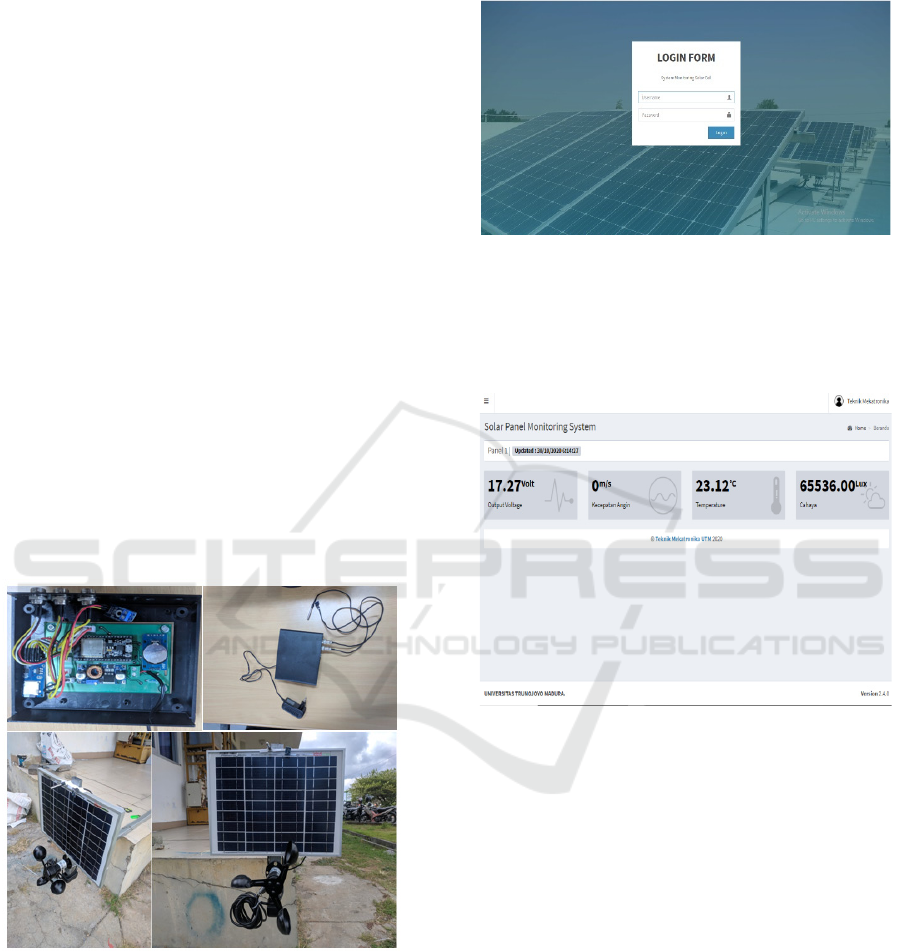
as in Figure 4.
Figure 4: Console Box and some sensors on the solar cell
pole.
Data on sensors can be accessed directly using an
information system that has been built in the form of
real-time and continuous sensor readings. The data
from sensor readings are used as a reference or input
to the system using the artificial neural network
method. Input data is in the form of training data and
test result data. Monitoring information system as in
Figure 5.
Figure 5: Initial appearance of the solar cell monitoring
web.
Login is done to access sensor data via a web
server. After logging in, it will go directly to the main
view of the monitoring web, as in Figure 6.
Figure 6: The main display of the solar cell monitoring web.
This research was conducted to prove that the air
temperature on the solar panel will cause a drop in
voltage (voltage will drop). The test scenario is
carried out in two ways. First the test is carried out
with a basic indicator in the form of light intensity as
shown in Figure 7. While the second test is carried out
with a temperature indicator as shown in Figure 8.
CESIT 2020 - International Conference on Culture Heritage, Education, Sustainable Tourism, and Innovation Technologies
176
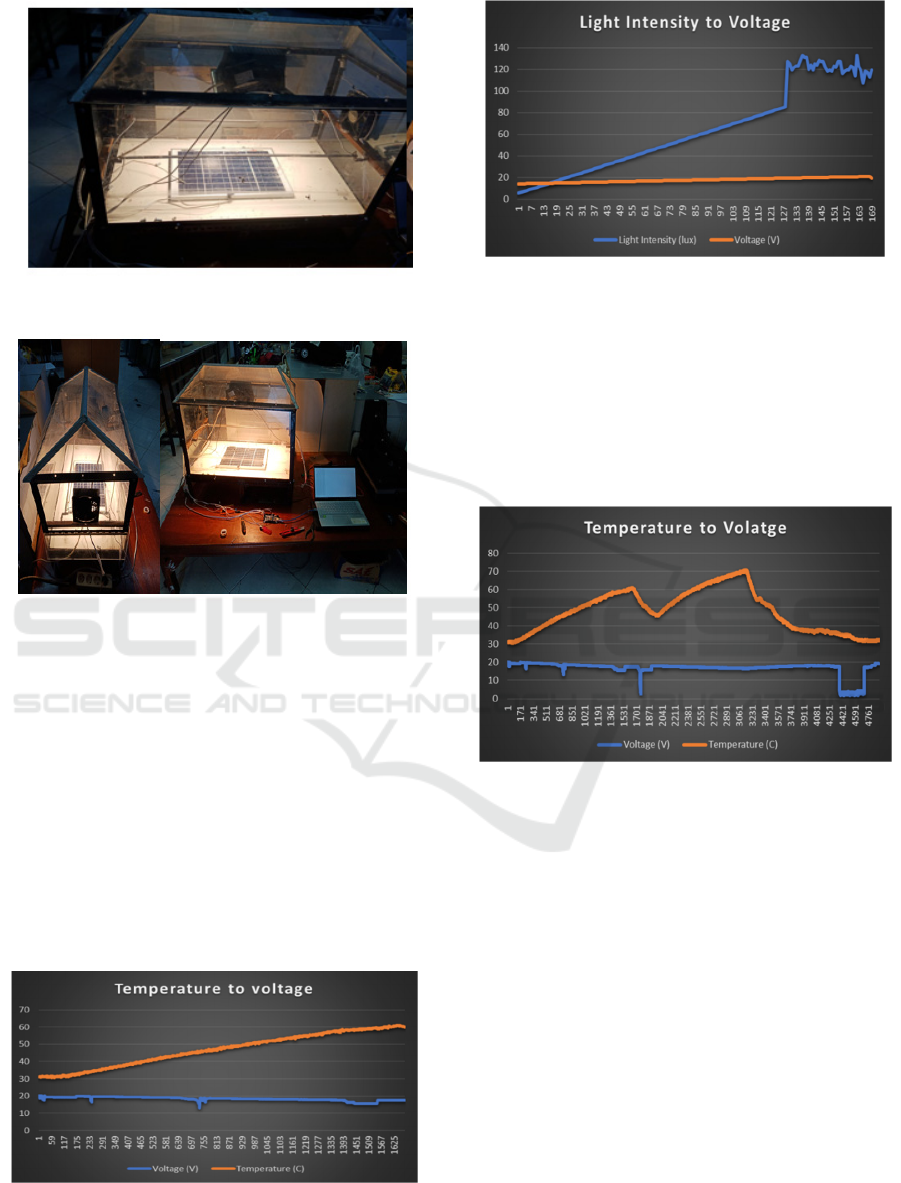
Figure 7: Solar cell testing with light intensity indicator.
Figure 8: Testing solar cells with temperature indicators.
The test uses a spotlight as a light source (light
intensity) and a heat source, because the heat
generated by the spotlights can reach 50
o
C, and the
heater in the heating room, so the heat received by the
solar panels is around 60-70
o
C. The test result data is
used as a reference for forecasting for one year. From
the above test shows that the greater the temperature
received by the solar cell, the smaller the resulting
voltage. In contrast to the light intensity received by
the solar cell, the greater the value of light intensity
received by the solar cell, the greater the resulting
voltage. This condition is evidenced by the test data
graph as shown in Figure 9 and Figure 10.
Figure 9: Graph of temperature test results against changes
in voltage.
Figure 10: Graph of test results of light intensity against
changes in voltage.
This research has been carried out in various
places as a form of proof that each different place has
a different resulting stress value. Other tests were
carried out at sites with different characteristics of
light intensity, temperature and wind speed. The
following are the results of testing sensor data based
on different places:
Figure 11: Graph of the results of testing the effect of
temperature in different places.
Based on the graph in Figure 11, it is shown that
the sensor reading conditions are not very stable due
to several factors, including weather and other natural
factors. But from this graph proves that the higher the
temperature value, the smaller the resulting voltage
refers to the test results in the graph in Figure 9.
In the same test in different places with different
values of light intensity and having different
characteristics. The test results are shown in Figure
12.
Design of Solar Cell Potential Devices in Real Time based on the Internet of Things (IoT)
177
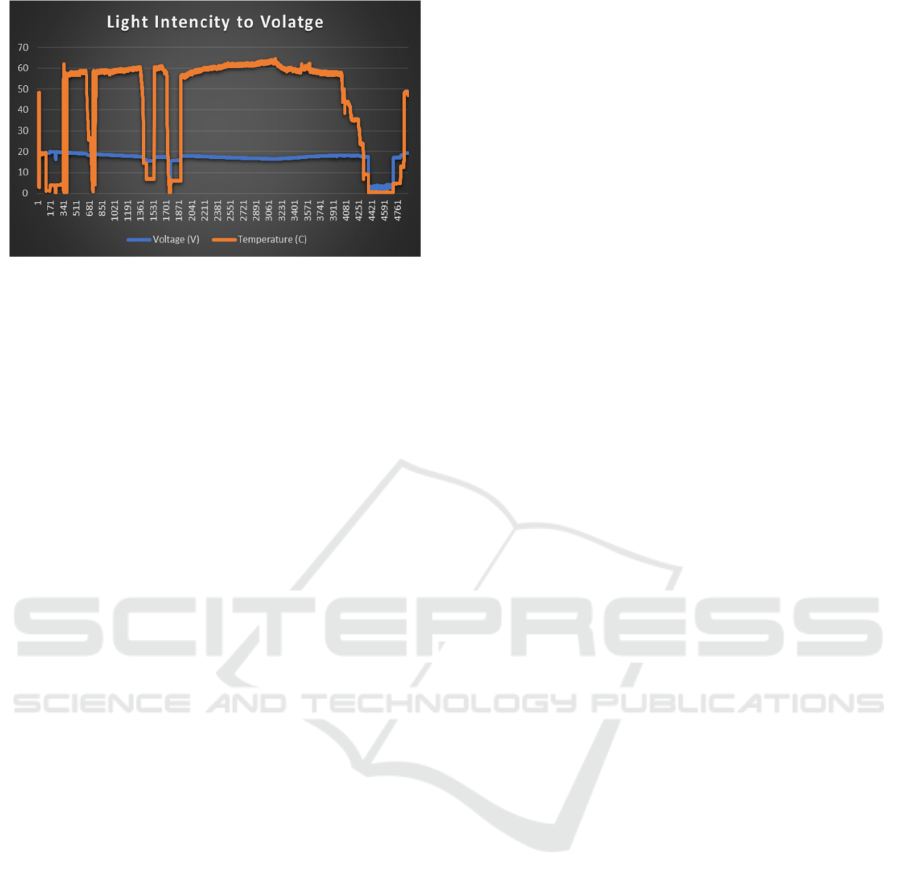
Figure 12: Graph of test results for light intensity in
different places.
Figure 12 shows the test in the form of light
intensity against the resulting voltage. In contrast to
temperature, in this case the higher the light intensity
received, the greater the resulting voltage, but the
graph gets a poor sensor reading because the reading
is unstable which affects the resulting voltage.
4 CONCLUSIONS
The conclusions from the results of this study are:
a. The sensors used in the system function well as
input indicators.
b. The monitoring information system built has
been able to accommodate data on a web server
and display realtime sensor reading data.
c. The test result data shows that the greater the
temperature received by the solar cell, the
smaller the resulting voltage. Inversely
proportional to the light intensity, the greater
the light intensity received by the solar cell, the
greater the resulting voltage.
d. The use of this type of sensor affects the readings
and data processing results.
e. Sensor data must use a valid data acquisition
system as the data base on the sensor for data
analysis
f. The highest voltage produced by a solar cell with
a light intensity of more than 4000 lux is 20 V.
g. The lowest voltage produced by a solar cell
with the highest temperature is 9.87 V.The
sensors used in the system function well as
input indicators.
REFERENCES
A. Ghosh, P. K. Kundu and G. Sarkar, 2018. ‘Automated
lux measurement for lighting design in indoor space
using mobile sensor’. 2018 IEEE Applied Signal
Processing Conference (ASPCON), Kolkata, India, pp.
106-109, doi: 10.1109/ASPCON.2018.8748775.
Asyari, H, Jatmiko, Angga, 2012. 'The intensity of sunlight
on the output power of solar cell panels'. National
Symposium RAPI XI FT UMS.ISSN 1412-9612.
B. R. Cho, J. I. Lee, S. Koh and S. Lee, 2018.’Study on
Low-Cost Soft Tactile Sensor using Light Intensity
Detector and Sponge: Basic Experiments’. 2018 25th
International Conference on Systems, Signals and
Image Processing (IWSSIP), Maribor, pp. 1-3, doi:
10.1109/IWSSIP.2018.8439246.
Cynthia, PE, Ismanto, E, 2017. 'Artificial Neural Networks
of the Backpropagation Algorithm in Predicting the
Availability of Riau Province Food Commodities'.
National Seminar on Information, Communication and
Industry Technology (SNTIK), Faculty of Science and
Technology, UIN Sultan Syarif Kasim Riau. 18-19 May
2017. ISSN: 2579-7271.
Harahap.F.S, 2018, 'Measurement and Testing of Wind
Speed Using Anemometer Sensor Based on Arduino
UNO R3'. Final Project Report. D3 Physics Study
Program. Faculty of Mathematics and Natural Sciences,
University of North Sumatra. Field.
Julpan, Nababan, B.E, Zarlis, M, 2015. 'Analysis of Binary
Sigmoid and SigmoidBipolar Activation Functions in
the Backpropagation Algorithm on Student's Ability
Prediction'. Journal of Teknovasi, Volume 02, Number
1,103-116. ISSN: 2355-701x.
K. Rühle, M. K. Juhl, M. D. Abbott and M. Kasemann, May
2015. ‘Evaluating Crystalline Silicon Solar Cells at
Low Light Intensities Using Intensity-Dependent
Analysis of I–V Parameters’. in IEEE Journal of
Photovoltaics, vol. 5, no. 3, pp. 926-931, doi:
10.1109/JPHOTOV.2015.2395145.
Yuliananda, S, Satya, G Hastijanti, R, RA, 2015. 'The
Effect of Changes in the Intensity of the Sun on the
Output Power of the Solar Panel', Jurnal Pengabdian
LPPM UNTAG Surabaya, Vol.01, no 02, pp. 193-202.
M. Buck, 2015.’Considerations for light sources: For
semiconductor light sensor test’. 2015 IEEE 20th
International Mixed-Signals Testing Workshop
(IMSTW), Paris, pp. 1-6, doi:
10.1109/IMS3TW.2015.7177862.
R. Nell and M. Kahn, 2012. ‘Measuring the light intensity
of a hybrid powered CFL and LED lighting using 3D
electronic vision in rotation of the solar panel’.
Proceedings of the 20th Domestic Use of Energy
Conference, Cape Town, pp. 111-115.
S. A. Bora and P. V. Pol, 2016.’Development of solar street
lamp with energy management algorithm for ensuring
lighting throughout a complete night in all climatic
conditions’.2016 International Conference on Inventive
Computation Technologies (ICICT), Coimbatore, pp.
1-5, doi: 10.1109/INVENTIVE.2016.7824868.
S. Islam, M. F. Khan and M. S. Islam, 2019. ‘Artificial
Light's Effects on Solar Cell's Short Circuit Current
(ISC) and Open Circuit Voltage (VOC): A Simulation-
Based Analysis’. 2019 International Conference on
Energy and Power Engineering (ICEPE), Dhaka,
Bangladesh, pp. 1-5, doi:
10.1109/CEPE.2019.8726673.
CESIT 2020 - International Conference on Culture Heritage, Education, Sustainable Tourism, and Innovation Technologies
178
