Analysis Effect of Leadership Style and Work Stress
on Employee Productivity with Moderating Variable Compensation
Andy Angkasa, Kuras Purba, Hendra Jonathan Sibarani, Fenny Krisna Marpaung, Hendry
Universitas Prima Indonesia
Keywords: Leadership Style, Work Stress, Compensation, Employee Productivity.
Abstract: Business competition in the era of globalization is very competitive, providers of products and services must
have the advantage to win the competition with competitors. To support the excellence of service providers,
a service provider company is required to have employees who have a good level of performance in achieving
the goals of the company. The purpose of this study is to determine the effect of leadership style and work
stress on employee productivity with compensation as a moderating variable. A questionnaire was used to
collect primary data related to the variables of leadership style, work stress, compensation, and employee
productivity given to the entire population of field employees from the study, amounting to 34 people. The
analysis method used is descriptive analysis method and analysis method based on Partial Least Square. The
result show that leadership style has a significant positive effect on employee productivity with original
sample equal 0.333, work stress has a significant negative effect on employee productivity with original
sample equal -0.457, compensation moderates (strengthens) the influence of leadership style on employee
productivity with original sample equal 0.453 and compensation moderates (weakens) the effect of work
stress on employee productivity with original sample equal 0.379.
1 INTRODUCTION
In this era of globalization, business competition for
service and product providers is very competitive.
Globalization has a significant impact on the business
continuity of a company and requires business people
to adapt to be able to compete with new competitors
and to be able to retain existing consumers.
The success of a company in doing business is
very dependent on human resources. Human
Resources is one very important factor in a company
in addition to other factors such as capital. One of the
competitive business companies in Medan City, PT
Kencana Optima Indonesia, is working on improving
all the deficiencies, both in terms of human resources,
technology and services.
One of the competitive business companies in the
city of Medan, namely PT Kencana Optima
Indonesia, is working on improving all the
shortcomings, both in terms of human resources,
technology and services. PT Kencana Optima
Indonesia is a company that operates as a provider of
transportation services. In this era of globalization,
PT Kencana Optima Indonesia is in the process of
developing technology to be able to compete
competitively in improving digital services to keep up
with the development of industry 4.0, PT Kencana
Optima Indonesia is also trying to increase the
company's productivity.
Table 1: Average Employee Achievement.
Description Perio
d
2017 - 2 2018 - 1 2018 -2
Number of
Field
Employees
32 35 36
Activities
per semester
(Trip)
99.75 103.44 103.39
Average
Activity per
Employee
3.12 2.96 2.87
In this case, the productivity phenomenon studied
is by looking at the employee achievement data in
Table 1. Table 1 shows the data on the number of field
employees, activities per semester (trip), namely the
average of all activities in 1 semester and the average
activity per employee, namely activities per semester.
divided by the number of existing employees. It can
be seen that there is an increase in the number of
Angkasa, A., Purba, K., Sibarani, H., Marpaung, F. and Hendry, .
Analysis Effect of Leadership Style and Work Stress on Employee Productivity with Moderating Variable Compensation.
DOI: 10.5220/0010303900003051
In Proceedings of the Inter national Conference on Culture Heritage, Education, Sustainable Tourism, and Innovation Technologies (CESIT 2020), pages 97-104
ISBN: 978-989-758-501-2
Copyright
c
2022 by SCITEPRESS – Science and Technology Publications, Lda. All rights reserved
97

employees of 3 people from 2017 semester 2 to 2018
semester 1 and 1 person from 2018 semester 1 to 2018
semester 2. Carried out in order to increase the
number of activities that can be carried out per day.
Based on Table 1, it can be seen that there is an
increase in the number of activities per semester,
which is 3.69 trips or 3.7% in 2018 semester 1 and
there is a decrease of 0.05 trips or 0.05% in 2018
semester 2. The average activity per employee also
decreased by 0.16 trips in 2018 semester 1 and 0.09
trips in 2018 semester 2.
The decrease in productivity at PT Kencana
Optima Indonesia is inversely proportional to the
increase in the number of field employees being
carried out.
The internal factor that will be discussed first is
leadership style. The need for a leader who can
motivate and guide employees is very necessary to be
able to compete in the current era of globalization.
The next factor that will be discussed in this study
is compensation, which is the obligation of the
company to support contributions to employees in
order to achieve company goals.
The third factor is work stress, which is working
conditions that make employees feel uncomfortable
or depressed in doing their jobs. The negative
influence that occurs is in fact an indication that
affects employee productivity.
From the background that has been written, the
identification of problems that will be used as
research material is as follows:
1. There is a decrease in company productivity
which is inversely proportional to the increase
in the number of employees.
2. The expected increase in company productivity
did not materialize.
In this study, it is necessary to limit the problem
so that the problem under study does not spread, the
researcher limits the problem only to the analysis of
the influence of leadership style and work stress on
the productivity of field employees with
compensation as a moderating variable at PT
Kencana Optima Indonesia.
Based on the above background, it can be seen
that there is a decrease in productivity at PT Kencana
Optima Indonesia. The aim of this research is:
1. To test and analyze the influence of Leadership
Style on Employee Productivity.
2. To test and analyze the effect of Work Stress
on Employee Productivity.
3. To test and analyze whether Compensation
moderates the influence of Leadership Style on
Employee Productivity.
4. To test and analyze whether Compensation
moderates the effect of Work Stress on
Employee Productivity.
5. To analyze how much the variable leadership
style, work stress and compensation can
explain employee productivity.
Leadership style is a behavioral norm that is used
by someone when that person tries to influence the
behavior of others or subordinates (Miftah Thoha,
2010). Leadership is a process of influencing or
giving an example to followers through a process of
communication in an effort to achieve goals (Rivai,
2009). Leadership is the ability to direct followers to
work together with trust and diligence to do the tasks
given by the leader (Terry, 2012).
Stress is a condition of tension that affects one's
emotions, thoughts and physical conditions (Sondang
P. Siagian, 2014). Stress is a feeling of pressure
experienced by employees in facing work (A.A
Anwar Mangkunegara, 2011). Work stress is a
condition that results from the subjective appreciation
of individuals, which can be in the form of
interactions between individuals and the work
environment that can threaten and exert
psychological, physiological, and individual attitudes
(Wijono, 2010).
Compensation is everything that employees
receive in return for their work (Sedarmayanti, 2011).
Compensation is something that employees receive as
a substitute for their service contribution to the
company (Rivai, 2010). Compensation is all income
in the form of money, direct or indirect goods
received by employees in return for services provided
to the company (Hasibuan, 2017).
Productivity is the ratio between output (output)
and input (input). This formulation applies to
companies, industries and the economy as a whole.
More simply, productivity is a computational
comparison between the amount produced and the
amount of each resource used during the process
(Budiono, 2003). Productivity is the ability to get the
maximum benefit from the facilities and
infrastructure available by producing optimal output
even maximum possible (Siagian, 2002). In addition,
productivity is also defined as a way to make good
use of resources in producing goods. Productivity
implies a mental attitude which always has the view
that "the quality of life today must be better than
yesterday and tomorrow is better than today"
(Sedarmayanti, 2001).
CESIT 2020 - International Conference on Culture Heritage, Education, Sustainable Tourism, and Innovation Technologies
98
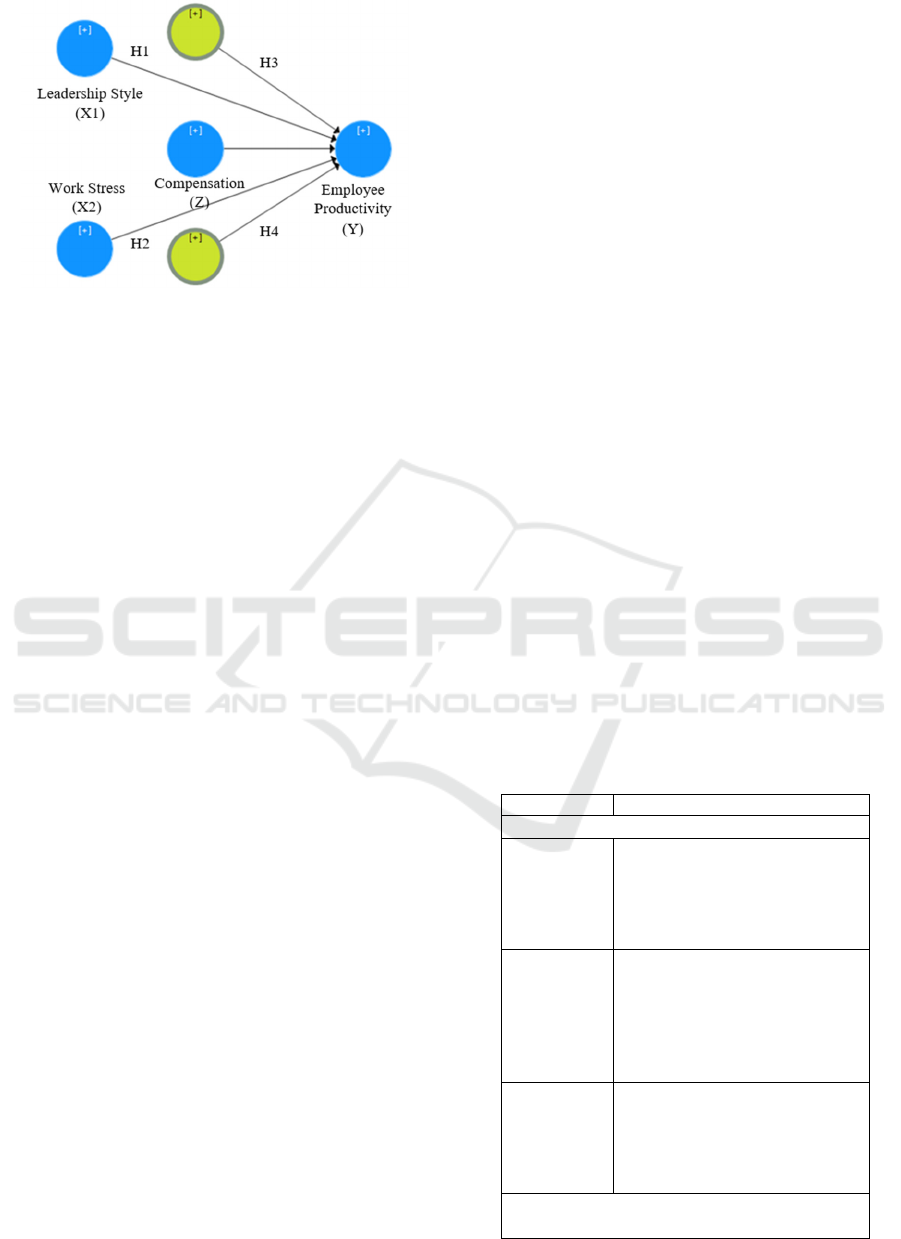
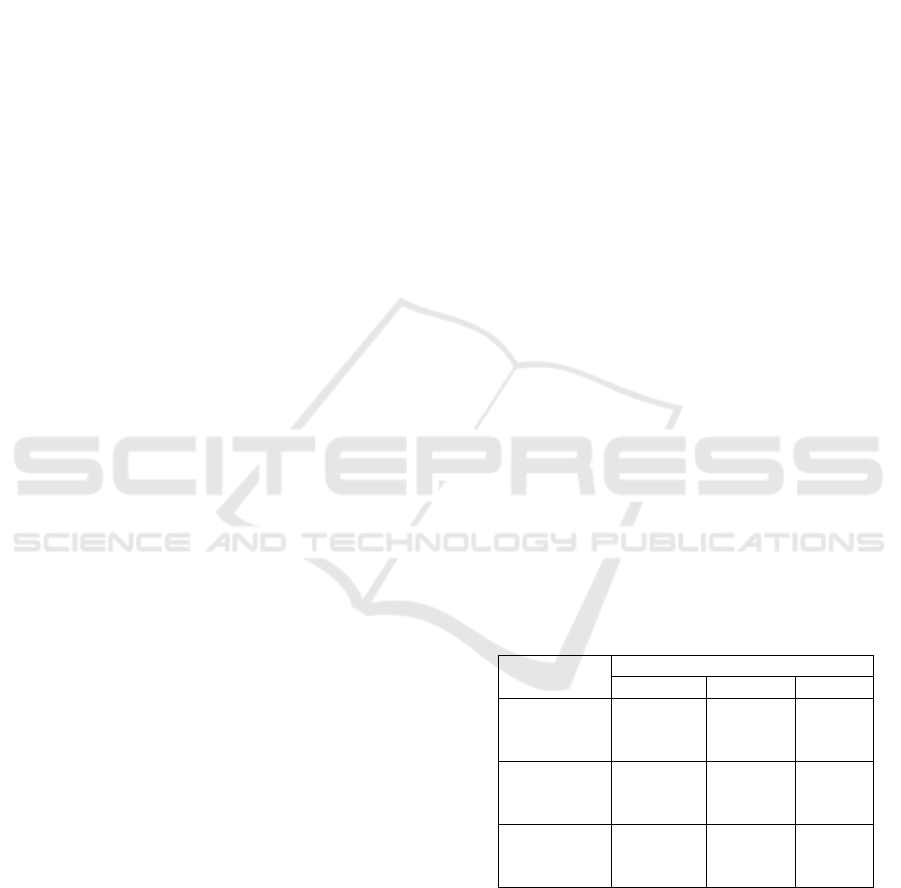
Figure 1: Conceptual framework.
The conceptual framework in Figure 1 shows H1
which represents the hypothesis between the
constructs of Leadership Style and Employee
Productivity, H2 which represents the hypothesis
between the constructs of Work Stress and Employee
Productivity, H3 which represents the hypothesis
between Compensation interactions on the
relationship between Leadership Style and Employee
Productivity and H4 which represents the hypothesis.
Between Compensation interactions and the
relationship between Work Stress and Employee
Productivity.
2 METHOD
The research location will be conducted at PT
Kencana Optima Indonesia, which is located at Jl. KL
Yos Sudarso Km 16,5 No. 16, Medan.
The population in this study were 34 employees
who worked at PT Kencana Optima Indonesia. The
sample technique used in this study is saturated
sample, which is using all members of the population
as the sample. The number of samples used by
researchers was 34 employees of PT Kencana Optima
Indonesia.
Characteristics of respondents based on gender,
all male respondents were 34 people. Respondents
aged < 20 years are 3 people, 20-29 years 16 people,
30-39 years 12 people and 50-59 years 3 people.
Based on the latest education, there were 5
respondents who completed elementary school, 9
completed junior high school, 17 people completed
high school and 3 undergraduate students. Based on
the length of work, there were 13 people who worked
< 1 year, 4 people who worked 1 - 2 years and 17
people who worked > 4 years.
In this study the authors used a quantitative
approach. This study uses a descriptive approach with
the aim of describing the object of research or
research results. This study uses a questionnaire as a
research instrument. The questionnaire in this study
used closed questions and used a scale of 5. The
questions in the questionnaire were made using a
scale of 1-5 (Likert scale developed) to obtain data
that is interval and given a score or value.
Validity according to (Sugiyono, 2016) shows the
degree of accuracy between the data that actually
occurs on the object and the data collected by
researchers to find the validity of an item, we
correlate the item score with the total of these items.
If the coefficient between items and total items is
equal to or above 0.3 then the item is declared valid,
but if the correlation value is below 0.3 then the item
is declared invalid.
Reliability test is the extent to which the results of
measurements using the same object will produce the
same data (Sugiyono, 2012). The questionnaire
reliability test in this study used the split half item
method. The item is divided into two groups, namely
the odd item group and the even item group. Then
each group's score for each item is added up to
produce a total score. If the correlation is 0.7, it is said
that the item provides a sufficient level of reliability,
on the contrary, if the correlation value is below 0.7,
it is said that the item is less reliable.
In accordance with the hypothesis that has been
formulated, in this study the data analysis used is the
Partial Least Square (PLS). Table 2 are the
assessment criteria for the PLS model proposed by
Chin 1998 in (Ghozali, 2006):
Table 2: PLS Assessment Criteria.
Criteria Desc
r
i
p
tion
Structural Model Evaluation
R2 for
endogenous
variables
R2 results of 0.67, 0.33 and
0.19 for endogenous latent
variables in the structural model
indicate that the model is
"good", "moderate" and "weak"
Estimated
path
coefficients
The estimated values for the
path relationships in the
structural model must be
significant. This significant
value can be obtained by
bootstrapping procedures
f2 for the
effect size
F2 values of 0.2, 0.15 and
0.35 can be interpreted whether
the predictors of latent variables
have a weak, moderate or large
influence at the structural level
Evaluation of the Reflective Measurement
Model
Analysis Effect of Leadership Style and Work Stress on Employee Productivity with Moderating Variable Compensation
99
Loading
factor
The loading factor value
must be above 0.70
Composite
Reliability
Composite Reliability
measures internal consistency
and the value must be above 0.60
Average
Variance
Extracte
d
Average Variance Extracted
(AVE) value must be above 0.50
Discriminan
t Validity
The square root value of the
AVE must be greater than the
correlation value between latent
variables
3 RESULTS AND DISCUSSIONS
Figure 2: Structural Equation Analysis Model.
The structural equation analysis model can be
observed in Figure 2 with an explanation in Table 3.
Table 3: Construct and Indicator.
Construct Indicato
r
Leadership Style
(X1)
GK1, GK2, GK3,
GK4, GK5, GK6
Work Stress (X2)
SK1, SK2, SK3, SK4,
SK5
Compensation (Z)
K1, K2, K3, K4, K5,
K6
Employee
Productivity (Y)
PK1, PK2, PK3, PK4,
PK5, PK6, PK7, PK8
Interaction Z * X1
GK1_K1…GK1_K5
Interaction Z * X2
SK1_K1…SK1_K5
Processed Data, 2019
From Table 3 it can be seen that there is a
Leadership Style construct (X1) consisting of 6
indicators, namely GK1, GK2, GK3, GK4, GK5 and
GK6. The Work Stress (X2) construct consists of 5
indicators, namely K1, K2, K3, K4 and K5. The
Compensation Construct (Z) consists of 6 indicators,
namely SK1, SK2, SK3, SK4, SK5 and SK6. The
Employee Productivity (Y) construct consists of 8
indicators, namely PK1, PK2, PK3, PK4, PK5, PK6,
PK7 and PK8. Leadership Style Interaction Construct
* Compensation as a moderating variable of
compensation to the relationship between leadership
style and employee productivity. Work Stress
Interaction Construct * Compensation as a
moderating variable of compensation to the
relationship between Work Stress and employee
productivity. Validity and reliability tests were
carried out for questionnaires to a sample of
companies engaged in the same field as the results in
Table 4 and Table 5.
Table 4: Validity Test Result.
Indicato
r
R Status
GK1
0.656
Vali
d
GK2
0.640
Vali
d
GK3
0.758
Vali
d
GK4
0.832
Vali
d
GK5
0.774
Vali
d
GK6
0.811
Vali
d
SK1
0.830
Vali
d
SK2
0.760
Vali
d
SK3
0.868
Vali
d
SK4
0.869
Vali
d
SK5
0.785
Vali
d
K1
0.816
Vali
d
K2
0.760
Vali
d
K3
0.894
Vali
d
K4
0.787
Vali
d
K5
0.799
Vali
d
K6
0.672
Vali
d
PK1
0.767
Vali
d
PK2
0.697
Vali
d
PK3
0.706
Vali
d
PK4
0.743
Vali
d
PK5
0.737
Vali
d
PK6
0.848
Vali
d
PK7
0.613
Vali
d
PK8
0.673
Vali
d
Processed Data, 2019
Table 4 shows that each question item has an R
value greater than 0.3, it can be concluded that all the
questions for all variable are declared valid.
CESIT 2020 - International Conference on Culture Heritage, Education, Sustainable Tourism, and Innovation Technologies
100
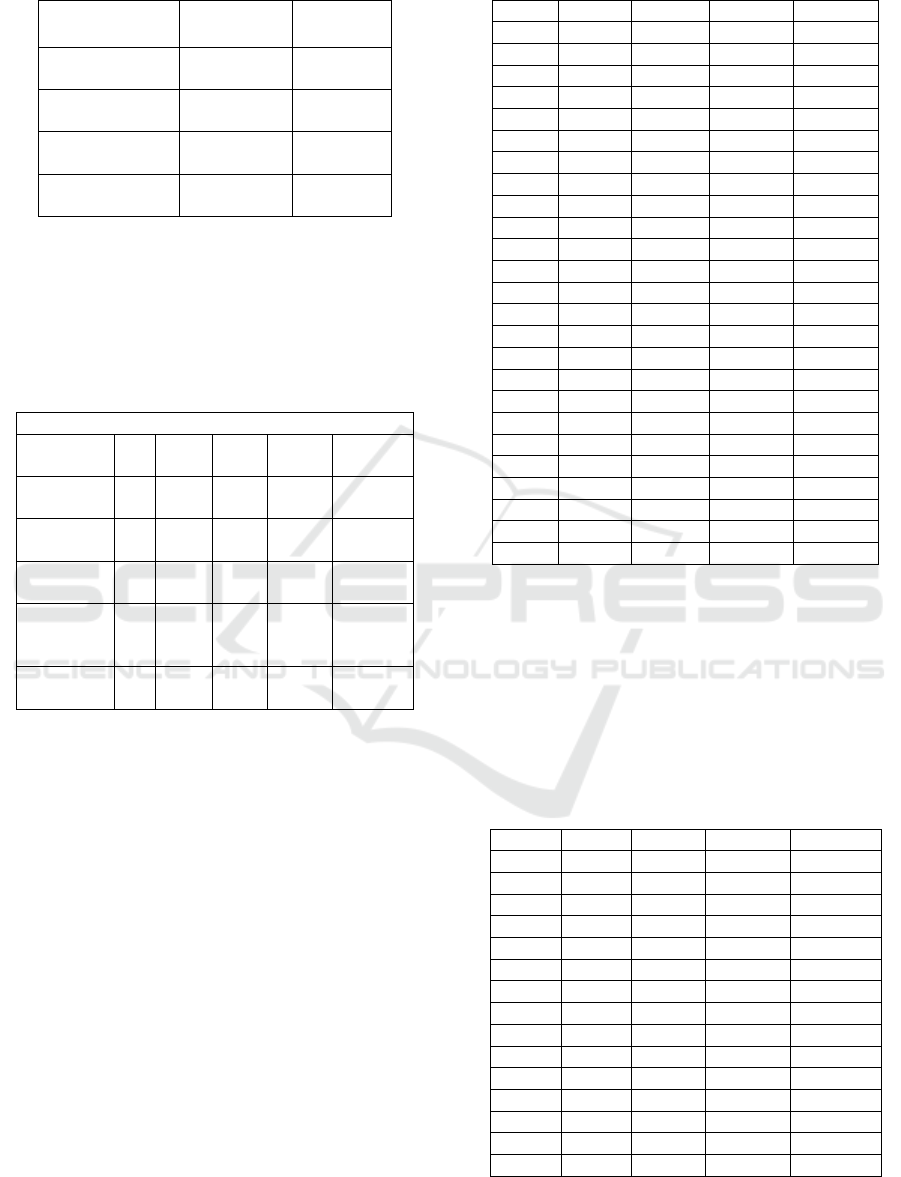
Table 5: Validity Test Result.
Construct
Cronbach's
Alpha
N of
Items
Leadership
Style (X1)
.834 6
Work Stress
(X2)
.875 5
Compensation
(Z)
.878 6
Employee
Productivity (Y)
.847 8
Processed Data, 2019
In Table 5 above, it can be seen that all Cronbach's
Alpha values are greater when compared to the value
of 0.7, so it can be concluded that all the questions for
each variable are declared reliable.
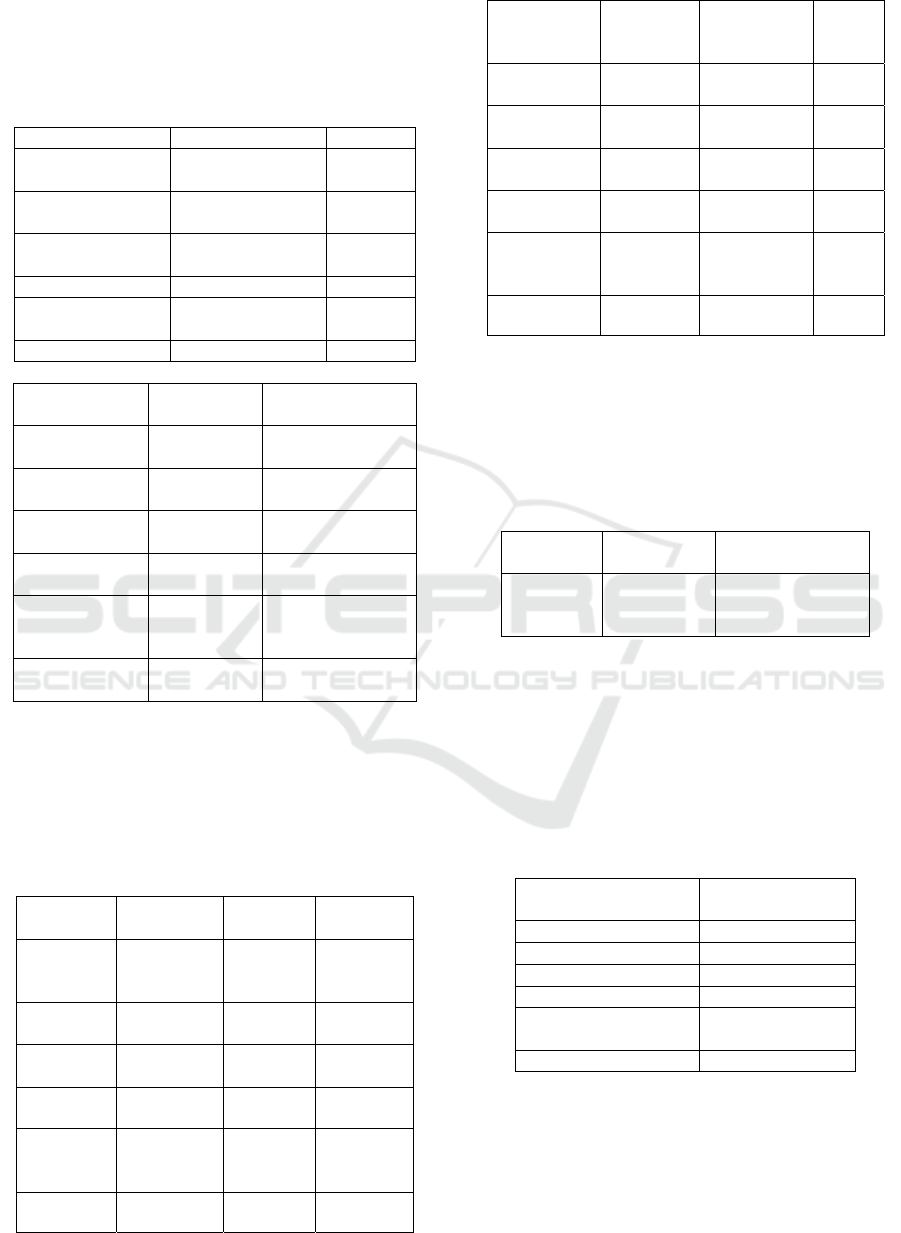
Table 6: Descriptive Statistics.
Descriptive Statistics
N Min Max Mean
Std.
Dev
Leadershi
p
Style
34 14 30 23.35 3.52379
Work
Stress
34 7 16 11.03 2.24938
Compensa
tion
34 18 29 23.35 2.08722
Employee
Productivi
ty
34 23 38 30.65 3.11285
Valid N
(listwise)
34
Processed Data, 2019
Based on the results of the descriptive analysis in
Table 6, it can be seen that the variable leadership
style (X1) with a sample of 34 respondents has an
average of 23.3529 units with a leadership style of at
least 14 units and a maximum of 30 units and a
standard deviation of 3.52379. The work stress
variable (X2) with a sample of 34 respondents has an
average of 11.0294 units with a minimum work stress
of 7 units and a maximum of 16 units and a standard
deviation of 2.24938. The compensation variable (Z)
with a sample of 34 respondents has an average of
23.3529 units with a minimum work stress of 18 units
and a maximum of 29 units and a standard deviation
of 2.08722. Employee Productivity Variable (Y) with
a sample of 34 respondents has an average 30.6471
units with a minimum work stress of 23 units and a
maximum of 38 units and a standard deviation of
3.11285.
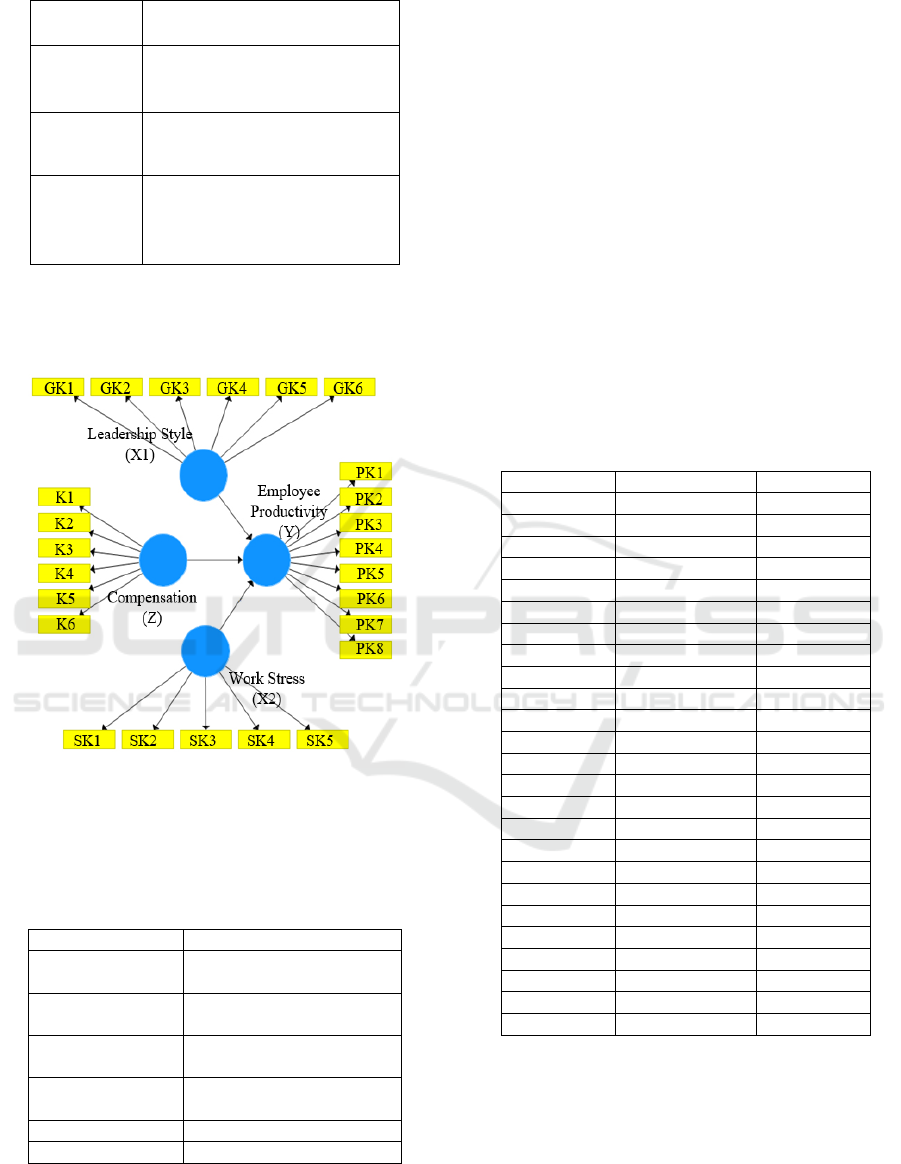
Table 7: First Model Loading Factor Test Results.
X1 Z Y X2
GK1 0.864
GK2 0.841
GK3 0.742
GK4 0.847
GK5 0.858
GK6 -0.049
K1 -0.091
K2 0.422
K3 0.142
K4 0.900
K5 0.898
K6 -0.325
PK1 0.838
PK2 0.880
PK3 0.925
PK4 0.740
PK5 -0.125
PK6 0.824
PK7 -0.583
PK8 0.201
SK1 0.828
SK2 0.359
SK3 0.795
SK4 0.790
SK5 0.166
Processed Data, 2019.
From the Results of the First Loading Factor
Model, the Loading Factor value is obtained as shown
in Table 7. There are indicators that have outer
loadings value <0.6, so these indicators must be
removed from the structural model and re-
algorithmized. The indicators removed were GK6,
SK2, SK5, K1, K2, K3, K6, PK5, PK7 and PK8.
Table 8: Second Model Loading Factor Test Results.
X1 Z Y X2
GK1 0.872
GK2 0.839
GK3 0.743
GK4 0.849
GK5 0.860
K4 0.934
K5 0.946
PK1 0.837
PK2 0.892
PK3 0.925
PK4 0.764
PK6 0.818
SK1 0.852
SK3 0.793
SK4 0.776
Processed Data, 2019
Analysis Effect of Leadership Style and Work Stress on Employee Productivity with Moderating Variable Compensation
101
From the results of the Second Loading Factor
Model, table 8 show the loading factor values are
above 0.6. It can be concluded that the construct has
good convergent validity.
Table 9: Test Results of Construct Reliability and Validity.
Cronbach's Al
p
ha rho
_
A
Leadership Style
(
X1
)
0.889 0.895
Interaction
X1 * Z
1.000 1.000
Interaction
X2 * Z
1.000 1.000
Compensation (Z) 0.868 0.873
Employee
Productivit
y
(
Y
)
0.902 0.910
Work Stress (X2) 0.735 0.746
Composite
Reliabilit
y
Average Variance
Extracted
(
AVE
)
Leadership
St
y
le
(
X1
)
0.919 0.695
Interaction
X1 * Z
1.000 1.000
Interaction
X2 * Z
1.000 1.000
Compensation
(
Z
)
0.938 0.883
Employee
Productivity
(
Y
)
0.928 0.721
Work Stress
(
X2
)
0.849 0.652
Processed Data, 2019.
Table 9 show that the construct has good
reliability, namely the composite reliability value,
Cronbach alpha above 0.7 and the AVE value above
0.5.
Table 10: Test Results of Discriminant Validity.
Leadership
St
y
le
(
X1
)
IX1 * Z X2 * Z
Leadershi
p Style
(
X1
)
0.834
Interaction
X1 * Z
0.082 1.000
Interaction
X2 * Z
-0.059 -0.838 1.000
Compensa
tion
(
Z
)
0.596 -0.269 0.282
Employee
Productivi
ty (Y)
0.861 0.112 -0.020
Work
Stress
-0.757 -0.064 0.244
Compensa
tion (Z)
Employee
Productivity
(
Y
)
Work
Stress
(
X2
)
Leadership
Style (X1)
Interaction
X1 * Z
Interaction
X2 * Z
Compensati
on
(
Z
)
0.940
Employee
Productivity
(
Y
)
0.713 0.849
Work Stress
(
X2
)
-0.531 -0.775 0.808
Processed Data, 2019.
Table 10 show the AVE root value is higher than
the correlation value between other constructs and
this means that the construct has high discriminant
validity.
Table 11: Test Results of R Square.
R Square
R Square
Adjuste
d
Employee
Productivi
t
y
(
Y
)
0.890 0.871
Processed Data, 2019.
The R Square value of 0.871 in Table 11 means
that the variability of the Employee Productivity
construct can be explained by the constructs of
leadership style, work stress, compensation and
interaction of 87.1%. Meanwhile, 12.9% is explained
by other variables not included in this study.
Table 12: Test Results of f Square.
Employee
Productivity (Y)
Leadership Style (X1) 0.316
Interaction X1 * Z 0.581
Interaction X2 * Z 0.398
Com
p
ensation
(
Z
)
0.349
Employee
Productivit
y
(
Y
)
Work Stress
(
X2
)
0.519
Processed Data, 2019.
f Square assesses the effect size of the model. The
effect size value in Table 12 shows the f value of
Leadership Style Square (X1), Work Stress (X2),
Interaction of Compensation and Leadership Style
and Interaction of Compensation and Work Stress on
CESIT 2020 - International Conference on Culture Heritage, Education, Sustainable Tourism, and Innovation Technologies
102
Employee Productivity (Y) respectively 0.316, 0.519,
0.581 and 0.398 means that it has a high effect size
value.
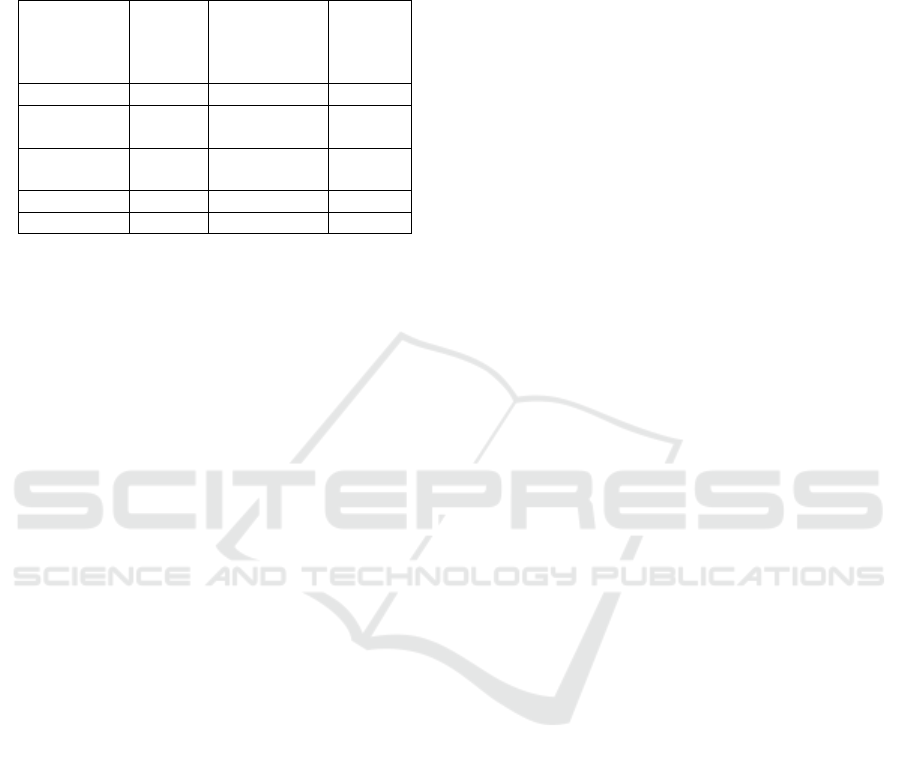
Table 13: Test Results of Path Coefficients.
Origina
l
Sample
(O)
T Statistics
(|O/STDEV|)
P
Values
X1 ->Y 0.333 2.231 0.026
Interaction
X1*Z->Y
0.453 2.546 0.011
Interaction
X2*Z-> Y
0.379 2.352 0.019
Z ->Y 0.279 2.649 0.008
X2 ->Y -0.457 3.559 0.000
Processed Data, 2019.
Based on Table 13, it can be seen that the
Leadership Style construct affects employee
productivity with T Statistics> 1.96 and P values
<0.05, namely with T Statistics of 2.231 and P values
of 0.026. Leadership Style has an Original Sample(O)
value of 0.333 which means that Leadership Style has
a positive effect on Employee Productivity.
The results of this study are in line with research
by Paula Goren which states that there is positive
significant relationship between democratic
leadership style and employee productivity (Paula
Goren, 2018).
Democratic and transformational leadership have
a significant positive relationship with the
performance of employees (Sugandha Agarwal,
2020). The leadership style positive and significant
impact on employee productivity (Retna and
Handriyono, 2019).
The work stress construct affects employee
productivity with T Statistics> 1.96 and P
values<0.05, namely with T Statistics of 3.559 and P
values of 0.000. Work stress has an Original Sample
(O) value of -0.457 which means that Work Stress has
a negative effect on Productivity.
The results of this study are in line with research
by Muhammad and Kishwar which state that there is
significant relationship between work stress and
employee's productivity in banking sector
(Muhammad and Kishwar, 2019). Productivity gets
affected due to stress in organization. (Abhijeet and
Sneha, 2018).
However, the result are not in line with research
by Suharno and Dini which state that job stress did
not affect employee productivity (Suharno and Dini,
2018).
In addition, in this study, the compensation
construct moderates the relationship between
leadership style and employee productivity with T
Statistics> 1.96 and P values <0.05, namely with T
Statistics of 2.546 and P values of 0.011. The
Compensation Interaction has an Original Sample (O)
value of 0.453 which means that compensation
moderates (strengthens) the relationship between
leadership style and productivity.
Compensation construct also moderates the
relationship between work stress and employee
productivity with T Statistics> 1.96 and P values
<0.05, namely with T Statistics of 2.352 and P values
of 0.019. The Compensation Interaction has an
Original Sample (O) value of 0.379 which means that
compensation moderates (weakens) the relationship
of work stress to productivity.
The results of this study are in line with research
by Suharno and Dini which states that compensation
affects employee productivity (Suharno and Dini,
2018). Compensation positive and significant impact
on employee productivity (Retna and Handriyono,
2019).
Occupational stress is considered a stigma among
employees who are facing stress at the workplace. We
can conclude that if employees are happy and healthy,
they can be their most productive (Samma et al.,
2020). Good compensation plan enhances teachers’
productivity (Uwannah et al., 2019).
4 CONCLUSIONS
Based on the previous explanations, this research
draws the following conclusions:
Leadership style has a significant positive
effect on employee productivity.
Work stress has a significant negative effect on
employee productivity.
Compensation moderates (strengthens) the
influence of leadership style on employee
productivity.
Compensation moderates (weakens) the effect
of work stress on employee productivity.
The variable ability of leadership style, work
stress and compensation can explain the
employees productivity, which is 87.1%, while
the remaining 12.9% is explained by other
variables not included in this research model.
Based on the conclusion, the researchers provide
the following suggestions:
For company to be able to increase the
leadership style factor by fostering better
communication and being able to receive ideas
and suggestions from employees in terms of
Analysis Effect of Leadership Style and Work Stress on Employee Productivity with Moderating Variable Compensation
103

running operational activities and increasing
the company's compensation to be able to
support a good leadership style and reduce the
impact of stress work experienced on employee
productivity.
For company to be able to reduce the work
stress of employees by resolving conflicts that
arise as a result of assigning divergent tasks
from superiors in operational activities by
means of deliberation to prevent miss-
communication and increase employee
productivity.
The factors that are considered in order to increase
employee productivity are leadership style, work
stress and compensation, however there are still many
factors that affect the productivity. Researchers
provide suggestions in order to develop other factors
that can affect the productivity of the employees.
Further research is suggested to conduct research in
other companies and add other independent variables
to get a broader picture of employee productivity.
REFERENCES
A. Anwar Prabu Mangkunegara., 2011. Manajemen
Sumber Daya Manusia Perusahaan, PT. Remaja Rosda
Karya. Bandung.
Abhijeet Rawal, Sneha Mhatre., 2018. A Study on Work
Stress and Its Impacts on Employee’s Productivity With
Respect To Teacher’s (Self Financing). IOSR Journal
of Business and Management (IOSR-JBM) e-ISSN:
2278-487X, p-ISSN: 2319-7668. PP 15-23
A.M., Sugeng Budiono., 2003. Bunga Rampai Hiperkes
dan Kesehatan Kerja, Badan Penerbit UNDIP.
Semarang.
Chin, W.W., 1998. The Partial Least Squares Aproach to
Structural Equation Modeling. Modern Methods for
Business Research, 295, 336.
George R. Terry., 2012. Asas-asas Manajemen, cetakan
ketujuh, PT Alumni. Bandung
Ghozali, Imam., 2006. Structural Equation Modeling
Metode Alternatif dengan Partial Least Square, Badan
Penerbit Universitas Diponegoro. Semarang.
Hasibuan, Melayu S.P., 2017. Manajemen Sumber Daya
Manusia, Bumi Aksara. Jakarta.
Muhammad Ehsan, Kishwar Ali., 2019.The Impact of
Work Stress on Employee Productivity: Based in the
Banking Sector of Faisalabad, Pakistan. International
Journal of Innovation and Economic Development,
ISSN 1849-7020 (Print), ISSN 1849-7551 (Online),
Volume 4, Issue 6, February, 2019, Pages 32-50.
Paula Goren., 2018. Effect of Leadership Styles on
Employee Productivity at South Nyanza Sygar
Company Limited, Migori Country. International
Journal of Progressive Sciences and Technologies
(IJPSAT) ISSN: 2509-0119, Vol.6 No. 2 January 2018,
pp. 428-432.
Retna Anggitaningsih, Handriyono., 2019. Effect of
Environmental Work Leadership Style Compensation
On Employee Productivity Intervening As Employee
Satisfaction In Business Unit Pt. Brantas Bipraya In
Jakarta. International Journal of Scientific &
Technology Research. Volume 8, Issue 07, July 2019.
Rivai, Veithzal., 2009. Manajemen Sumber Daya Manusia.
PT. Raja Grafindo Persada. Jakarta
Samma Faiz Rasool, Mansi Wang, Yanping Zhang and
Madeeha Samma, 2020. Sustainable Work
Performance: The Roles of Workplace Violence and
Occupational Stress. International Journal
Environmental Research and Public Health 2020, 17,
912.
Sedarmayanti., 2001. Sumber Daya Manusiadan
Produktivitas Kerja, Mandar Maju. Jakarta.
Sedarmayanti., 2011. Manajemen Sumber Daya Manusia,
Reformasi dan birokrasi dan Manajemen Pegawai
Negeri Sipil (Cetakan Kelima), PT Refika Aditama.
Bandung.
Siagian, Sondang P., 2008. Manajemen Sumber Daya
Manusia, PT Bumi Aksara. Jakarta.
Siagian, Sondang P., 2014. Manajemen Sumber Daya
Manusia, Bumi Aksara. Jakarta.
Sugandha Agarwal., 2020. Leadership Style and
Performance of Employees. International Research
Journal of Business Studies. ISSN: 2089-6271 | e-
ISSN: 2338-4565
Sugiyono, 2012.,
Metode Penelitian Kuantitatif, Kualitatif
dan R&D, Alfabeta : Bandung.
Sugiyono, 2016, Metode Penelitian Kuantitatif, Kualitatif
dan R&D, Alfabeta : Bandung.
Suharno Pawirosumarto, Dini Iriani., 2018. The Influence
of Work Stress, Working Cost, Compensation and
Work Discipline on Employee’ Productivity.
International Journal of Economics and Business
Administration. Volume VI, Issue 4, 2018
Thoha, Miftah., 2010. Kepemimpinan Dalam Manajemen,
Rajawali Pers. Jakarta.
Uwannah, Ngozi Caroline, Eteete, Michael Adam, Mark,
Onyinyechi Gift., 2019. Work Environment,
Compensation and Teachers’ Productivity: Evidence
from Ogun State, Nigeria. European Journal of
Scientific Research, ISSN 1450-216X / 1450-202X
Vol. 154 No 1 September, 2019, pp. 83-93.
Veitzal Rivai., 2010. Manajemen Sumber Daya Manusia
untuk Perusahaan, PT. Raja Grafindo Persada. Jakarta.
Wijono, Sutarto., 2010. Psikologi Industri dan Organisasi,
Fajar Interpratama Offset. Jakarta.
CESIT 2020 - International Conference on Culture Heritage, Education, Sustainable Tourism, and Innovation Technologies
104
