
Prediction of the Effect of Specialist Services on Patient Satisfaction
using the SVM Method
Mehma Preet Kaur, Ermi Girsang, Sri Lestari R. Nasution
Faculty of Medical, Universitas Prima Indonesia, Indonesia
Keywords: Specialist Doctor Services, Patient Satisfaction.
Abstract: The availability of specialist doctors is absolutely necessary for curative services in hospitals because
professional services are at the core of patient satisfaction. The existence of patient complaints about the
services of specialist doctors has an impact on patients dissatisfaction. The purpose of this study is to develop
a model that is able to predict the effect of the quality of specialist services on patient satisfaction based on
previous services. For development and testing, patients with a population of 750 respondents with 88 samples
were used. Modeling was built using the support vector machine method. For weighting the model, the study
data using univariate, bivariate with chi-square test, and multivariate with multiple logistic regression at a
95% confidence level ( = 0.05) were used. The results showed that the accuracy of the built model by 91.7%
was achieved, where there was an effect of reliability, responsiveness, and assurance on inpatient satisfaction
p <0.05. While the tangible and empathy variables have no significant effect. The variable that had the greatest
influence on patient satisfaction was assurance with a 9.5 times higher chance of poor specialist medical
guarantees.
1 INTRODUCTION
The hospital is a health service institution for the
community with its own characteristics that are
influenced by the development of health science,
technological advancements, and the socio-economic
life of the community (Bustami, 2015). Hospitals
cannot be released from the burden of responsibility
to provide quality services for patients (Azwar, 2016).
Hospitals require the presence of doctors to carry
out their functions as a health service organization.
Doctors as professionals need a container that is able
to accommodate and facilitate medical technical work
through the provision of teams, equipment, and
various other supporting needs (Herlambang, 2016).
The availability of specialist doctors is absolutely
necessary for curative services in hospitals because
professional services of specialist doctors are at the
core of hospital services (Scholten & Grinten, 2015).
Patient satisfaction will be fulfilled if the doctor's
professional behavior in providing health services is
as expected by the patient or family. Stages of
specialist doctors providing health services include
history, physical examination, therapy, and
termination (E. Gusti, 2016). Specialists in providing
health services that are friendly, comfortable, caring
and able to accommodate the needs of patients are
demands that must be met by the hospital. Even
though in reality, the implementation of health
services is still oriented towards the interests of
providers rather than the interests of patients and the
community. The research of Murtiana E et al found
that there was a relationship between the quality of
administrative services, doctors, nurses, quality of
facilities and infrastructure, and hospital environment
to patient satisfaction with a value of p = 0.00 <0.05
(Murtiana, 2016) . Outpatient medical facilities as one
of the busiest in Malaysia found that the highest
patient satisfaction is in the service factor or direct
evidence priority, especially technical quality,
accessibility, and comfort but that satisfaction is low
in terms of doctors service orientation, especially
time spent with doctors, interpersonal behavior, and
communication during consultations (Ganasegeran,
2015).
The number of patients continues to increase at
each health care institution, while the number of
specialist doctors is not proportional to the number of
existing patients (Vonikartika et al., 2018). Based on
data from the Indonesian Medical Consul (KKI) that
the total number of doctors is 217,749 people,
consisting of 141,230 general practitioners, 32,757
Kaur, M., Girsang, E. and Lestari, S.
Prediction of the Effect of Specialist Services on Patient Satisfaction using the SVM Method.
DOI: 10.5220/0010291601410148
In Proceedings of the International Conference on Health Informatics, Medical, Biological Engineering, and Pharmaceutical (HIMBEP 2020), pages 141-148
ISBN: 978-989-758-500-5
Copyright
c
2021 by SCITEPRESS – Science and Technology Publications, Lda. All rights reserved
141

dentists, 39,646 specialist doctors, 4,116 specialist
dentists (Indonesian Medical Council, 2019). The
ratio of the number of specialist doctors in Indonesia
has not met the target, from 14.6 per 100,000 the
population has only been realized 10 per 100,000
(Ministry of Health, Republic of Indonesia, 2018).
Based on data from the North Sumatra Provincial
Health Office that the number of specialist doctors in
the whole area of North Sumatra Province was 654
people, out of 913 health facilities available. The
highest number of specialist doctors was in Medan
City with 373 people, followed by Deli Serdang
District with 78 people, Binjai City with 35 people
(Provincial Health Office, 2018).
The disproportionate number of doctors,
especially specialist doctors, causes doctors who
provide services to tend to be a bit slow and
sometimes less reliable, less responsive, less
convincing, show less concern in carrying out their
duties, even though every patient who comes to the
hospital would want a fast and appropriate service .
In the service process the factor of concern for
patients cannot be ignored by specialist doctors so
that patients feel satisfied with the services provided
(Vonikartika et al., 2018).
Patient satisfaction is a major factor and is a
measure of success as a result of services provided to
customers that impact the number of patient visits
increases, and patients who are satisfied with the
service tend to return (Tjiptono & Chandra, 2015).
Patient satisfaction will have a direct effect on
company profits so health care providers are required
to improve overall performance which will have a
positive impact on patient satisfaction. Patient
satisfaction cannot be underestimated, if health care
providers can satisfy their patients, it will be a big
advantage for these health care providers
(Khunwuthikorn, 2011; Turnip et al, 2020; Wijaya et
al, 2019). A good understanding from every hospital
officer such as a specialist about patient satisfaction
so that specialist doctors will provide the best service
and provide satisfaction to the patients they serve
(Haffizurrachman, 2014).
Low quality will cause dissatisfaction with
patients, not only patients at the clinic but also have
an impact on others. Because patients who are
disappointed will tell others (Lupiyoadi & Hamdani,
2016). Furthermore, Parasuraman, Berry, & Zeithaml
(1991) identified a gap between patients and health
service providers which resulted in the failure to
deliver quality services. Health care providers do not
always understand exactly what the patient wants.
Mardiana Research (2012), respondents who were
satisfied with the services of specialists in internal
medicine at the outpatient installation of the
Friendship Hospital were respondents who were old,
female, married, not employees, high school
education, long time visitors, short waiting times and
long checks by a doctor. Overall, the level of
satisfaction of respondents to the quality of services
specialist in internal medicine is still very low.
Indratno's research (2017) at the Graha Amanah
Specialist Clinic in Klaten found that: reliability,
responsiveness, assurance, empathy, tangibility had a
positive and significant effect on patient satisfaction
with the services of specialist doctors. Purba research
(2015) at H. Adam Malik General Hospital Medan
got the result that the patient's evaluation of the health
services of specialist doctors with quite satisfied
criteria (54.2%). There is a relationship between
specialist doctor professional services (competence
and service) with general patient satisfaction (p
<0.05).
Regarding patient satisfaction with the services of
specialist doctors, researchers conducted a
preliminary survey by interviewing 10 patients who
received specialist doctor services. As many as 5
people expressed satisfaction with the service during
treatment, as many as 2 people felt quite satisfied, and
as many as 3 people said they were not satisfied.
Patients who are satisfied, explain that the disease
information in accordance with its capabilities, not
angry if the patient asks a lot. Whereas patients who
are dissatisfied because they consider specialist
doctors less friendly or less communicative, lack
detail in responding to perceived complaints, waiting
in line for long, doctors are not in accordance with the
practice schedule. This is consistent with the data
obtained from the suggestion box.
2 METHOD
This type of research is a quantitative analytic study
with a cross sectional study design. This study was
conducted at Stella Maris Hospital in Medan in
December 2019. The study population was the total
number of patient visits to specialist doctors as many
as 750 visits, and samples were obtained as many as
88 people. The research sampling technique was done
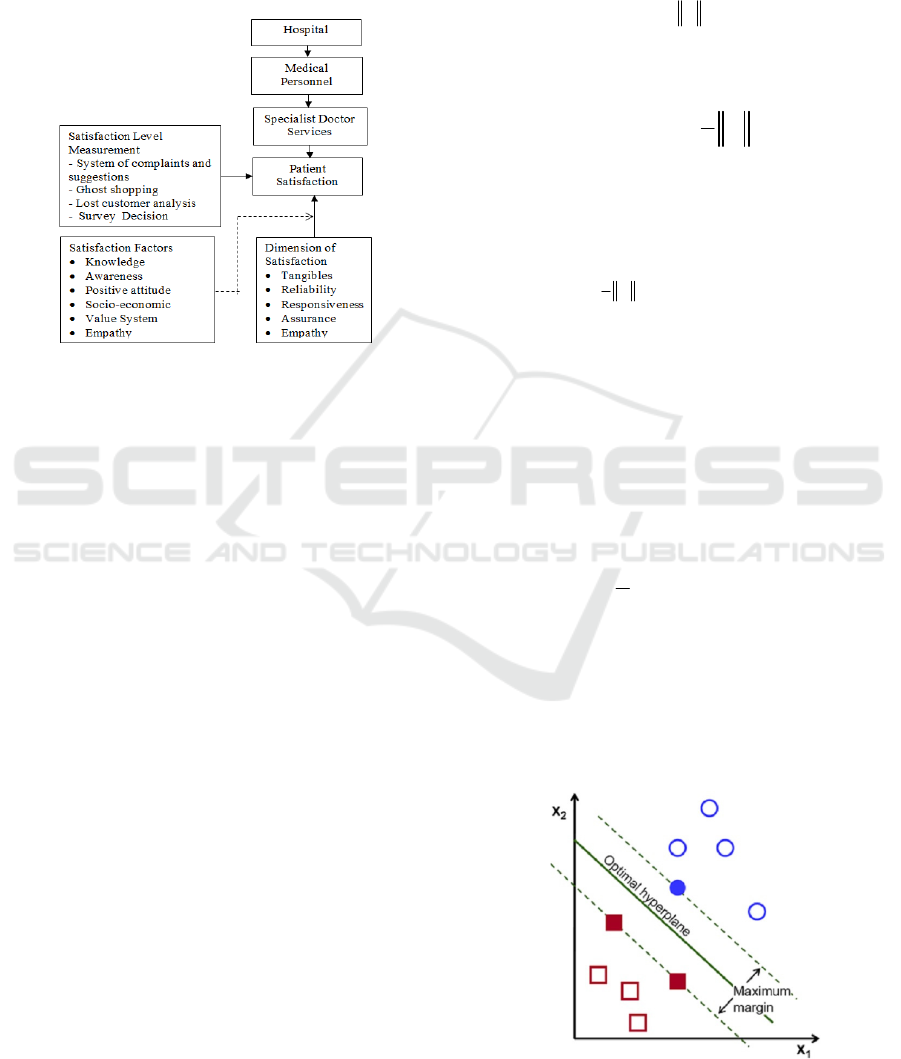
by simple random sampling. Figure 1 explains the
questionnaire design scheme as a measurement
instrument. Validity test was conducted at Sarah
Medan General Hospital for 30 patients. The test
conducted was to determine the correlation between
the questions with the total construct score or
variable. A construct is declared valid if there is a
positive and significant correlation. The correlation
HIMBEP 2020 - International Conference on Health Informatics, Medical, Biological Engineering, and Pharmaceutical
142
value must be greater than 0.361 or the Corrected
Indicator-Total Correlation value in the SPSS output
greater than 0.361 using the Pearson Product Moment
correlation test (Ghozali, 2015). Univariate data
analysis, bivariate using chi-square test, and
multivariate using multiple logistic regression tests
with a confidence level of 95% ( = 0.05).
Figure 1: Research Scheme
Support Vector Machine (SVM) is a classification
method that works by defining the boundary between
two classes with the maximum distance from the
closest data (Clarke, 2009; Turnip, 2018). To get the
maximum limit between classes, a hyperplane must
be formed in the best input space obtained by
measuring the margins and finding the maximum
point. Margin is the distance between the hyperplane
and the closest point of each class. This closest point
is called the support vector (Campbell, Ying, 2011;
Kusumandari et al, 2018; Turnip et al, 2018). The
solid line in Figure 2 shows the best hyperplane,
which is located right in the middle of the two classes,
while the red and yellow dots in the black circle are
support vectors. The effort to find the location of a
hyperplane is the core of the learning process in
SVM.
The available data is denoted as
d
i
x
while
the respective label is represented by
}1,1{
y
i
for
,,...,2,1 li
which l is the amount of data. It is
assumed that the two classes of -1 and +1 can be
completely separated by hyperplane with dimension
of d, defined as
0.
bxw
(1)
Patterns
i
x
that belong to a class -1 (negative
sample) can be formulated as a pattern which fulfill
the inequality
1.
bw
x
i
(2)
While the pattern
i
x
is included in the class +1
1.
bw
x
i
(3)
The largest margin can be found by maximizing
the value of the distance between the hyperplane and
its closest point, that is
w
/1
. This can be formulated
as a Quadratic Programming problem, which is
finding the minimum point of equation (4), taking
into account the constraints of equation (5).
w
w
w
2
2
1
)(min
(4)
ibw
x
y
i
i
,01).(
(5)
This problem can be solved by various
computational techniques, including Lagrange
Multiplier.
))1).(((
1
1
),,(
1
2
bwxywbwL
ii
l
i
i
(6)
i
is Lagrange multipliers, which are zero or
positive
)0(
i
. The optimal value of equation (6)
can be calculated by minimizing L with respect to
w
and b, and maximize L against
i
. Due to the nature
by considering the optimal point of gradient
0
L ,
the equation can be modified as the maximization of
problems that only contain
i
, as in equation (7)
below
Maximize:
xx
ji
jij
l
ji
i
l
i
i
yy
1,1
2
1
(7)
subject to:
0),...,2,1(0
1
i
l
i
ii
yli
(8)
From the calculation, the value of
i
is obtained
which mostly positive. The positive data that
correlated with
i
is called as support vector.
Prediction of the Effect of Specialist Services on Patient Satisfaction using the SVM Method
143

Figure 2: SVM to get the best hyperplane that separates two
data classes.
3 RESULTS AND DISCUSSION
Characteristics of respondents ie most respondents
aged ≥45 years (52.3%), a small proportion aged <45
years (47.7%). Based on gender, all respondents were
female (100.0%). Based on education, the majority of
respondents had a diploma education (59.1%), a small
proportion had a high school education (6.8%). Based
on work, most respondents were housewives (31.8%),
a small proportion of respondents worked as civil
servants (12.5%). Based on the length of stay, most
had 2 days 1 night (53.4%), a small portion had been
5 days 4 nights (2.3%).
Based on the results of bivariate analysis, all
independent variables were found to be significantly
related to inpatient satisfaction (p = 0,000). The
complete Chi-Square statistical test results can be
seen in Table 1.
Table 1: Relationship of Each Independent and Dependent
Variable.
Variables
Satisfaction
Total
p-value
Satisfied
Less
f f F
Tangible:
Good
Less
63
8
64
7
63
8
64
7
65
6
8
9
5
12
4
13
6
11
8
9
71
17
69
19
67
21
70
18
73
15
0,000
Reliability:
Good
Less
0,000
Responsiveness:
Good
Less
0,000
Assurance:
Good
Less
0,000
Empathy:
Good
Less
0,000
The results of multivariate analysis with multiple
logistic regression tests showed that of the five
variables as model candidates, three variables were
obtained that affected inpatient satisfaction, namely
reliability, responsiveness, and assurance. The most
influential variable in this study is the assurance
variable which has the value of Exp (B) / OR = 9.525
meaning that patients who claim a good specialist
doctor's guarantee have the opportunity to feel
satisfied with their services 9.5 times higher for the
less good.
Table 3: Multiple Logistic Regression Test Results.
Variables B Sig. Exp(B)
95%CI for
Exp(B)
Reliability
Assurance
Constant
2,066
1,852
2,254
-9,912
0,016
0,028
0,006
0,000
7,894
6,371
9,525
1,478-42,162
1,225-33,138
1,924-47,147
3.1 Reliability Effects
Based on the results of the study indicate that there
was an effect of reliability on inpatient satisfaction.
Patients who claim specialist doctors are reliable,
have the opportunity to feel satisfied with their
services by 7.8 times higher than patients who claim
specialist doctors are less reliable. The relationship
between patient perceptions of medical technical
skills and the interest in patient visits was found. The
less good the patient's perception of medical technical
skills, the less interested the patient's return is.
The availability of specialist doctors was
absolutely necessary for curative services in
hospitals. Without specialist services, the existence of
hospitals as health care institutions is meaningless.
Reliable specialist doctors become an indicator of the
quality of services available in hospitals that will
satisfy the patients being served (Scholten & Grinten,
2016). This is in accordance with the opinion of
Bowers Bowers, Swan, & Koehler (2017), in looking
at the quality of health services mentioned factors that
determine the quality of service, namely reliability,
ability, skills and knowledge of officers must be in
accordance with service providers and doctors who
are trained with well.
The results of this study prove that the reliability
of specialist doctors has a significant effect on patient
satisfaction. It is assumed that patients who claim that
reliable specialists tend to be more satisfied than
patients who say less reliable. The reliability of
specialist doctors felt by patients, namely specialist
doctors being professional in providing services to
patients and families. Specialists also regularly check
the patient's condition on schedule. In conducting
examinations, specialists do it carefully so that
patients feel satisfied with the results of the
examination. Not only conducting examinations,
specialist doctors are also required to provide
counseling or health education to patients in
accordance with the patient's illness and how to treat
it. Specialists must use language that is easily
understood by patients so that patients can receive
HIMBEP 2020 - International Conference on Health Informatics, Medical, Biological Engineering, and Pharmaceutical
144

information with enthusiasm and can be applied in
prevention and treatment.
3.2 Responsiveness Effects
The effect of rapid response was found to inpatient
satisfaction. Patients who stated that specialist
doctors were responsive were more likely to be
satisfied with their services by 6.3 times higher than
patients who stated that specialist doctors were less
responsive.
The quality of health services for patients is seen
more in several aspects ranging from the
responsiveness of officers in meeting patient needs,
responding to patient complaints, respect, the smooth
communication of officers with patients, and the
hospitality of officers in serving patients. To find out
whether these aspects are working well or not, an
evaluation is needed. Satisfaction is a feeling of
pleasure or disappointment someone after comparing
the perception of the performance or results of a
product with expected. The higher level of hospital
competition will cause patients to face more
alternative choices, prices and varying quality, so
patients will always look for the value that is
considered the highest of several products. For this
reason, the responsiveness of health workers needs to
be improved so that patients feel satisfied with the
services provided.
This study proves that the responsiveness of
specialist doctors has a significant effect on patient
satisfaction. Most respondents stated that specialist
doctors conducted examinations and actions with
responsiveness and they were satisfied while
respondents who stated that specialist doctors were
less responsive tended to be less satisfied.
According to the researchers' assumptions, their
satisfaction was related to specialist doctors who
came according to the specified schedule and took
immediate action. In addition specialist doctors must
demonstrate readiness to help if requested by patients.
Patients get an explanation of the treatment through
counseling related to the illness experienced. The
most important thing is the specialist doctor explains
to the patient and family in detail about the patient's
medicines, how to take them, and how to maintain the
patient's body condition so that they do not
experience things that can aggravate the disease. The
speed and reliability of specialist doctors in providing
services to patients makes patients feel satisfied
(patients get services beyond expectations).
3.3 Assurance Effects
Based on the results of the study showed that there
was a guarantee effect on inpatient satisfaction.
Patients who stated that the specialist doctor's
guarantee was good, had the opportunity to feel
satisfied with the service by 9.5 times higher than
patients who stated that the specialist's doctor's
guarantee was not good.
One of the main ways to differentiate health
services including outpatient services is to provide
quality health services, consistently higher than
competitors. The key is to meet or exceed patient
expectations about the quality of the service it
receives. After receiving health services, patients will
compare the services they experience with the
expected services. If the services experienced are
below the expected service, the patient is no longer
interested in returning.
The results of this study prove that the quality of
specialist services on the assurance dimension
significantly influences patient satisfaction. Patients
who state that a good specialist is guaranteed tend to
be satisfied with the services provided and conversely
patients who say they are not good tend to be less
satisfied.
According to the researchers' assumptions, the
satisfaction felt by patients that specialist doctors can
answer questions raised by patients and families. The
answers given make the patient better understand
about his illness and foster confidence in providing
services. The specialist doctor shows his skills in
providing information about the actions taken. In
addition, specialist doctors are also able to provide a
sense of security so that patients are confident that
their illness will recover after receiving service.
Specialists must be able to instill trust in patients to
cure the illness.
3.4 Prediction with SVM
Hospital satisfaction dataset consisting of six
variables is not easy to make in the graph for
predictive analysis in its original form because the six
coordinates (of features) of the dataset cannot be
mapped onto a two-dimensional screen. Therefore the
data dimension must be reduced by applying the
dimension reduction algorithm to the feature. Figure
3 is the plot spread - visualization of the points plotted
representing the observations on the graph. This
distribution plot represents the known results from 88
training datasets. The figure shows the plot of the
Support Vector Machine model that is trained with a
dataset which is dimensionally reduced to two
features. Five features are a set of small features that
are stored. This plot covers the decision surface for
Prediction of the Effect of Specialist Services on Patient Satisfaction using the SVM Method
145
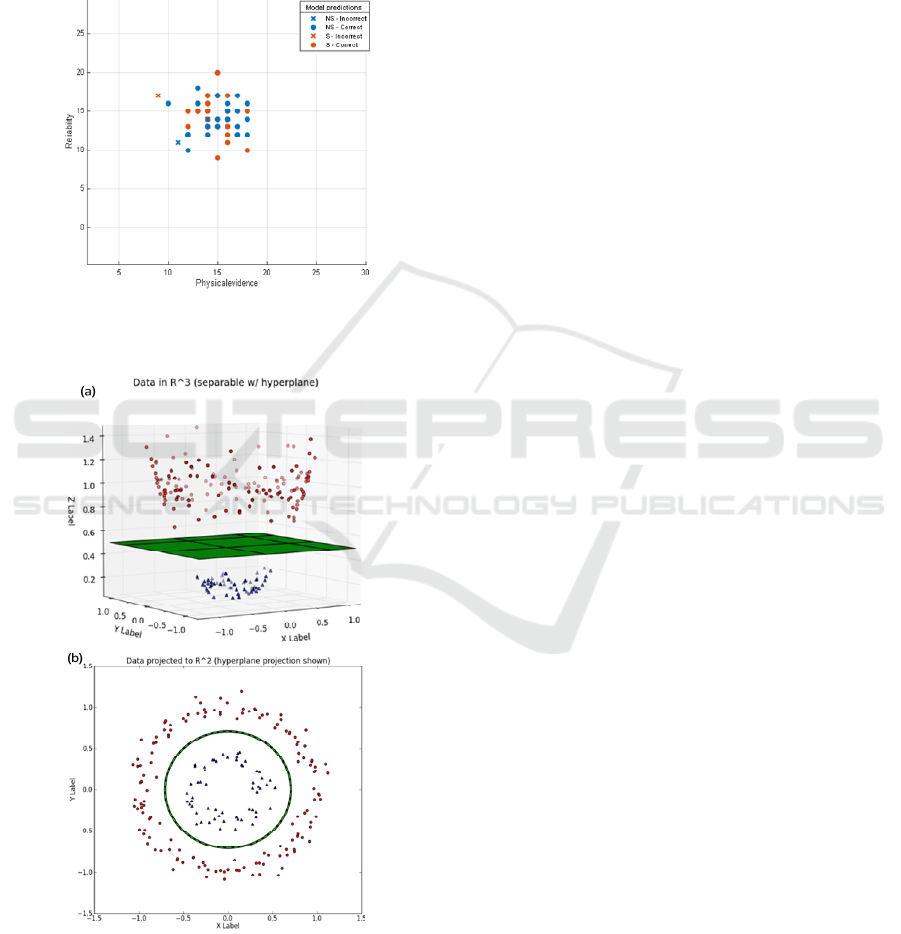
classifiers - the area in the graph that represents the
decision function used by SVM to determine the
results of new data inputs. The lines separate the area
where the model will predict the particular class of
data points that are owned. From this plot it can be
clearly seen that the class cannot be separated by a
two-dimensional cra so it must be done in three
dimensions as in Figure 4.
Figure 3: Spread - visualization of the points plotted
representing the observations.
Figure 4: 3D hyperplane (b) Hyperplane projection in 2D.
The SVM was used to find the best hyperplane by
maximizing the distance between classes. Hyperplane
is a function that can be used for separating between
classes. Its position is in the middle between the two
classes, meaning that the distance between the
hyperplane and the data objects is different from the
adjacent class (the outer) which is given a blank and
positive round mark. In SVM the outermost data
object that is closest to the hyperplane is called a
support vector. Objects called support vectors are the
most difficult to classify due to positions that almost
overlap with other classes. Given its critical nature,
only this support vector is calculated to find the most
optimal hyperplane by SVM.
In the Number of observation as in Figure 5, we
can see Incorrect data in orange, and correct data in
blue. So it can be concluded that the more blue the
data means the possibility of Incorrect data getting
smaller and vice versa. Confusion matrix (Figure 6)
understands how the current classification is chosen
to help identify areas where the classification of bad
and good performance. The row shows the correct
class while the column shows the predicted class. If
the classification is blue, then the classification of
observations is calculated correctly and if the
classification is orange, the classification level is
calculated incorrectly. Positive predictive values are
shown in blue for points that were predicted correctly
in each class, and incorrect discovery rates are
displayed in orange for incorrect prediction points in
each class. In Figure 6 we can see the percent of data
that has been classified Correct and Incorrect. The
concept is the same as in Figure 5 except for Positive
Pradict Value (PPV) & False Discovery Rates (FDR).
TPR and FNR are the data conclusions that have been
classified, what percentage of all variables have
Correct and Incorrect data. TPR is the proportion of
observations classified correctly per class True while
the FNR is the proportion of observations classified
incorrectly per true class. The plot shows the
summary per class correctly in the last two columns
on the right. If false positives are important in
classification problems, plot results per class are
predicted (not true class) to investigate the extent of
false discoveries. To see the results per prediction
class, under Plot, select the Positive Predictive Value
(PPV) option, False Discovery Value (FDR). These
results indicate that a prediction accuracy of 91.7% is
achieved.
HIMBEP 2020 - International Conference on Health Informatics, Medical, Biological Engineering, and Pharmaceutical
146
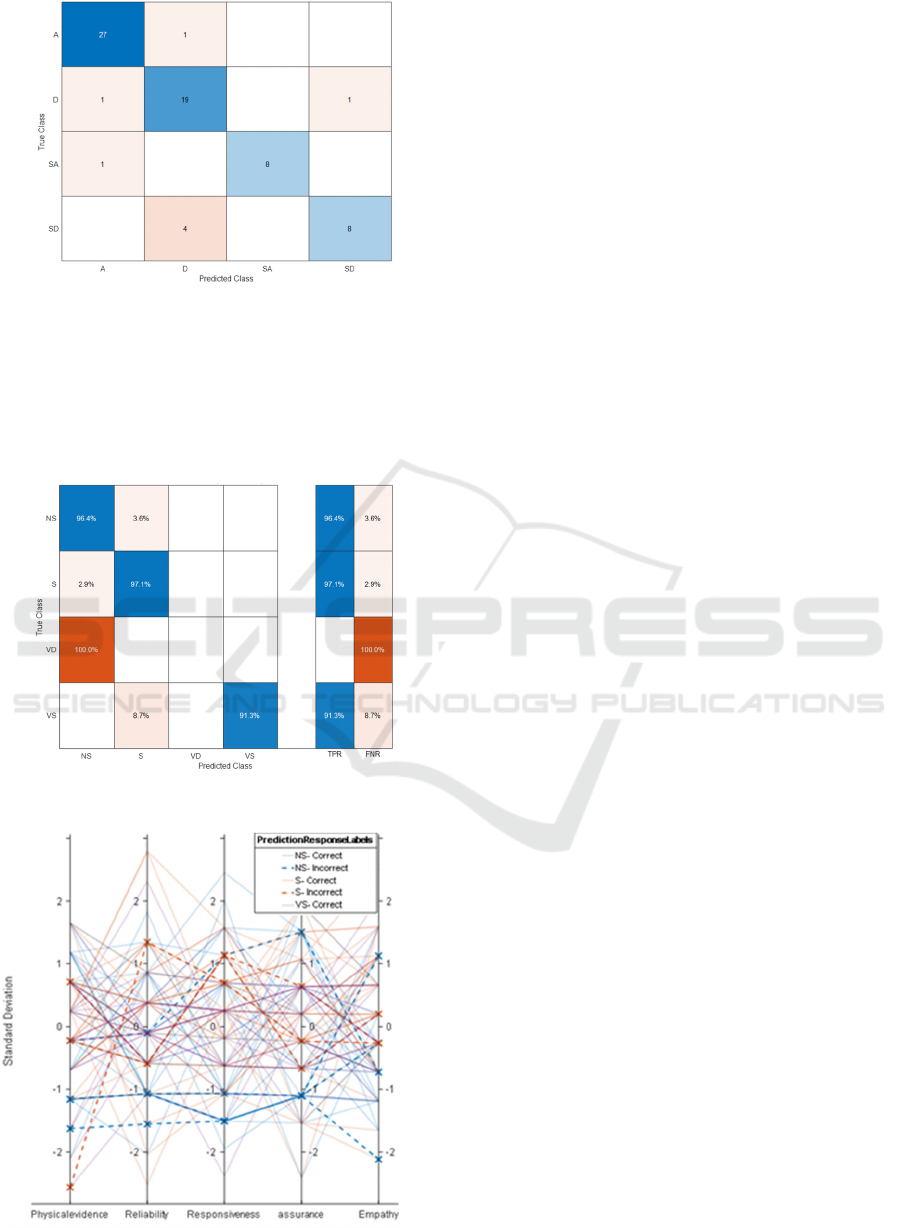
Figure 5: Number of Observation
.
These results are in line with the results found in
Figure 7 which shows the relationship between the
independent variables and the dependent variables.
Parallel Coordinats Plot serves to see the relationship
between variables. And see which relationships have
correct and Incorrect.
Figure 6: Confusion matrix
Figure 7: Parallel Coordinates Plot.
4 CONCLUSIONS
Reliability, responsiveness, and assurance variables
of specialist doctors have affect on patient
satisfaction, while variables of tangible and empathy
have no effect on inpatient satisfaction. The variable
that had the greatest influence on patient satisfaction
was assurance with a 9.5 times higher chance of poor
specialist medical guarantees. The prediction of the
effect of specialist services on patient satisfaction
using the SVM method with accuracy of 91.75 is
achieved.
REFERENCES
Azwar, A. (2016). Menjaga Mutu Pelayanan Kesehatan
(Cetakan 3). Jakarta: Pustaka Sinar Harapan.
Campbell, C dan Ying, Y. (2011). Learning with Support
Vector Machines, Buku seri Synthesis Lectures on
Artificial Intelligence and Machine Learning, Morgan
& Claypool Publisher, UK
Clarke, B., Fokoue, E., dan Zhang, H.H. (2009). Principles
and Theory for Data Mining and Machine Learning,
Springer Science + Bussiness Media, New York, USA.
Bowers, M. S., Swan, J. E., & Koehler, W. F. (2014). What
Atribute Determined Quality And Satisfaction With
Health Care Management Review (5th Editio). New
York: Aspen Publisher Inc,.
Bustami. (2015). Penjaminan mutu pelayanan kesehatan
dan akseptabilitasnya (Cetakan 3). Jakarta: Erlangga.
Depkes RI. (2005). Indikator Kinerja Rumah Sakit. Jakarta:
Departemen Kesehatan Republik Indonesia.
Dinkes Provsu. (2018). Data Tenaga Dokter Spesialis
Penunjang yang didayagunakan di Fasyankes di
Provinsi Sumatera Utara. Medan: Dinas Kesehatan
Provinsi Sumatera Utara.
Gerson, R. F. (2014). Mengukur Kepuasan Pelanggan
(Cetakan 1). Jakarta: PPM.
Haffizurrachman. (2014). Mengukur Kepuasan Suatu
Institusi Kesehatan. Jurnal Kedokteran Indonesia,
54(7), 283 – 288.
Herlambang, S. (2016). Manajemen Pelayanan Kesehatan
Rumah Sakit (Cetakan 1). Yogyakarta: Gosyen
Publishing.
Indratno, O. D. (2017). Pengaruh Kualitas Pelayanan
Terhadap Kepuasan Pasien di Klinik Spesialis Graha
Amanah (Sekolah Pascasarjana Universitas
Muhammadiyah Surakarta).
Karyati, S. B. (2006). Analisis Pengaruh Persepsi Pasien
Tentang Mutu Pelayanan Dokter Spesialis Obstetri Dan
Ginekologi Dengan Minat Kunjungan Ulang Pasien Di
Instalasi Rawat Jalan Rsi Sultan Agung Semarang
Tahun 2006. Program Pasca Sarjana Universitas
Diponegoro Semarang.
Kemenkes RI. (2018). Program Pemenuhan Tenaga
Kesehatan. Jakarta: Kementerian Kesehatan Republik
Indonesia.
Prediction of the Effect of Specialist Services on Patient Satisfaction using the SVM Method
147

Khunwuthikorn, K. A. (2011). Comparative Study of
Service Quality and Outpatient Satisfaction between
Public and Private Hospitals in Bangkok, Thailand.
Bangkok University Research Conference.
Konsul Kedokteran Indonesia. (2019). Jumlah
Dokter/Dokter Gigi Seluruh Indonesia Per 23-09-2019.
Retrieved September 23, 2019, from kki.go.id website:
http://www.kki.go.id/
Kusumandari, D., Risqyawan, M., Yazir, M., Turnip, M.,
Darma, A. and Turnip, A., 2018. Application of
convolutional neural network classifier for wireless
arrhythmia detection, Journal of Physics: Conference
Series, Volume 1080 (2018) 012048 doi:
10.1088/1742-6596/1080/1/012048.
Lupiyoadi, R., & Hamdani, A. (2016). Manajemen
Pemasaran Jasa. Jakarta: Salemba Empat.
Maksum, W., Maidin, A., & Anggareni, R. (2013).
Gambaran Tentang Mutu Pelayanan Dokter
Berdasarkan Persepsi Pasien di Instalasi Rawat Jalan
Rumah Sakit Universitas Hasanuddin Kota Makassar.
Bagian Manajemen Rumah Sakit FKM Universitas
Hasanuddin.
Mardiana, S. (2012). Analisis Kepuasan Pasien Terhadap
Pelayanan Dokter Spesialis Penyakit Dalam Di
Instalasi Rawat Jalan RSUP Persahabatan Tahun 2012.
FKM Universitas Indonesia.
Marmeam, Niswati, U. T., & Simanjorang, A. (2018).
Faktor Yang Memengaruhi Kepuasan Pasien Rawat
Jalan Di Rumah Sakit Umum Daerah Dr. Zubir
Mahmud Kabupaten Aceh Timur Tahun 2017. Jurnal
Jumantik, 3(2), 16–27.
Muninjaya, A. G. (2015). Manajemen Mutu Pelayanan
Kesehatan. Jakarta: EGC.
Parasuraman, A., Berry, L. L., & Zeithaml, V. . (1991).
Refinement And Reassessment Of The Servqual Scale.
Journal Of Retailing, 67(4), 420–450.
Purba, A. S. (2015). Hubungan Pelayanan Profesional
Dokter Spesialis dengan Kepuasan Pasien Umum di
Ruang Rawat Inap Penyakit Dalam Rumah Sakit
Umum Pusat Haji Adam Malik Medan. FKM
Universitas Sumatera Utara.
RSIA Stella Maris. (2019a). Data Laporan Kinerja RSIA
Stella Maris Medan Tahun 2017-2018. Medan.
RSIA Stella Maris. (2019b). Data Pegawai dan Kunjungan
Rawat Inap di RSIA Stella Maris Medan Tahun 2019.
Medan.
Scholten, G. R. M., & Grinten, van der. (2015). The
integration of medical special- istsin hospitals. Dutch
hospitals and medical specialists on the road to joint
regulatio. Health Policy, 72(1), 165–173.
Supranto. (2015). Pengukuran Tingkat Kepuasan
Pelanggan untuk Menaikkan Pangsa Pasar (Cetakan 2).
Jakarta: Rineka Cipta.
Tjiptono, F., & Chandra, G. (2015). Service, Quality &
Satisfaction. In Edisi 4.Yogyakarta: ANDI.
Turnip, A., Andrian, Turnip, M., Dharma, A., Paninsari, D.,
Nababan, T., Ginting, C.N., 2020. An application of
modified filter algorithm fetal electrocardiogram
signals with various subjects, International Journal of
Artificial Intelligence, vol. 18, no., 2020.
Turnip, A., Ilham Rizqywan, M., Kusumandari, D., et al.,
2018. Classification of ECG signal with Support Vector
Machine Method for Arrhythmia Detection, Journal of
Physics: Conference Series, Vol. 970 (2018) 012012
doi: 10.1088/1742-6596/970/1/012012.
Turnip, A., Kusumandari, D., Pamungkas, D., 2018. Drug
Abuse Identification based EEG-P300 Amplitude and
Latency with Fuzzy Logic Calssifier, IEEE International
Conference on Applied Engineering, (ICAE), 3-4 Oct.
2018, DOI: 10.1109/INCAE.2018.8579378.
Vonikartika, A., Girsang, E., Nasution, A. N., &
Ramadhani, S. L. (2018). Hubungan kehandalan
terhadap pelayanan dokter spesialis di instalasi rawat
jalan rumah sakit umum daerah embung. Jurnal Mutiara
Kesehatan Masyarakat, 3(2), 107–112.
Wijaya, C., Andrian, M., Harahap, M., Turnip, A., 2019.
Abnormalities State Detection from P-Wave, QRS
Complex, and T-Wave in Noisy ECG
, Journal of
Physics: Conference Series, Volume 1230, (2019)
012015. doi:10.1088/1742-6596/1230/1/012015.
Wijono, D. (2015). Manajemen Mutu Pelayanan
Kesehatan, Teori, Strategi dan Aplikas. Surabaya:
Airlangga University Press.
HIMBEP 2020 - International Conference on Health Informatics, Medical, Biological Engineering, and Pharmaceutical
148
