
Prediction of Inpatient Satisfaction with Service Quality with SEM
Method
Maria Sinaga, Chrismis Novalinda Ginting, Ali Napiah Nasution, Ermi Girsang
Department Magister of Public Health, Faculty of Medicine, University of Prima Indonesia.
Keywords: Service Quality, Inpatient Satisfaction.
Abstract: Patient satisfaction is an indicator of the hospital services quality. In fact, hospital services often make patients
dissatisfied like convoluted, boring, inhospitable, and less dexterous. This is allegedly because the provided
quality services is out of the patient expectations. The purpose of this study is to model the relationship
between service quality and inpatient satisfaction, which can then be used to predict satisfaction with various
variables. Modeling was conducted on questionnaire measurement data from 2,071 respondents with 250
samples. Analysis of questionnaire data was processed using univariate, bivariate with chi-square tests, and
multivariate with multiple logistic regression at 95% confidence level ( = 0.05). The modeling accuracy
above 90% was obtained with an input and output relationships in the form of satisfaction. Statistically there
was a relationship between physical evidence, reliability, quick response, and empathy with inpatient
satisfaction, p <0.05. The most significant variable related to inpatient satisfaction was reliability, where
patients who state good reliability will be satisfied with hospital services by 7.6 times higher than those that
are less good.
1 INTRODUCTION
Inpatient services in hospitals often cause satisfaction
and dissatisfaction felt by patients and families.
Dissatisfaction most frequently expressed in relation
to the attitudes and behavior of health workers,
among others: delays in the service of doctors and
nurses, difficult to find, less communicative and
informative, length of admission and order and
cleanliness of the hospital environment that indicate
that the quality of hospital services is still necessary
improved (Rahmawati, Febriana, & Stefanus, 2013).
Health services in hospitals are basically intended
to provide satisfaction to patients. According to
Parasuraman, the services provided by hospitals must
be quality and meet five main quality dimensions,
namely: tangibles, reliability, responsiveness,
assurance, and empathy (Tjiptono & Chandra, 2015).
Robbins and Luthan in (Warda, Junaid, &
Fachlevy, 2016) stated that for users of health
services, the quality of service is more related to the
responsiveness of officers to meet patient needs and
the smooth communication between officers and
patients. Patients as users of hospital services demand
services in accordance with their rights, that is,
quality and perfect services.
Fatas research conducted at Boyayali Hidayah
Hospital showed that the results of the analysis with
Cartesian diagram showed two attributes included in
quadrant a, first, doctors and nurses were quick in
providing the services needed, both doctors and
nurses patiently listened to patient complaints (Fatas,
2017). Rosjid's research at Nirmala Suri Sukoharjo
Hospital found that all service quality variables
included in the five dimensions of Servqual stand
alone or simultaneously, had a close correlation with
customer satisfaction. So that the Servqual method
can be applied in hospitals to measure patient
satisfaction with service quality (Rosjid, 2012).
Arwani's research at PKU Muhammadiyah Gubug
Hospital in 2011 concerning a decrease in the number
of patients showed that consumer satisfaction could
not be fulfilled. Some complaints felt by consumers
are related to tariffs that are not in accordance with
services provided by hospitals and hospital facilities
that are still not good (Arwani, 2011).
The better socio-economic condition of the
community so that in getting services at the hospital
also demands more quality service. This fact should
be of particular concern to the hospital to further
improve its services. But in reality some hospitals still
ignore the importance of customer/ patient
126
Sinaga, M., Ginting, C., Nasution, A. and Girsang, E.
Prediction of Inpatient Satisfaction with Service Quality with SEM Method.
DOI: 10.5220/0010291301260132
In Proceedings of the International Conference on Health Informatics, Medical, Biological Engineering, and Pharmaceutical (HIMBEP 2020), pages 126-132
ISBN: 978-989-758-500-5
Copyright
c
2021 by SCITEPRESS – Science and Technology Publications, Lda. All rights reserved

satisfaction by providing poor service. For example
health care for patients who are convoluted, boring,
less dexterous, patient care rooms that do not meet
health requirements and others. If this is not resolved
it can result in a decrease in the quality of hospital
services themselves (Sakti, 2009, Turnip et al, 2018).
Patient satisfaction surveys about the presence of
officers who are unprofessional in providing health
services include complaints that will be heard from
officers who are not friendly and indifferent to the
complaints of their patients. Two directions with
doctors, which reflects how weak the position of
patients as recipients of health services (Isnindar, et
al, 2013; Turnip et al, 2020; Wijaya et al, 2019).
Stella Maris Hospital in Medan is a specialized
hospital that provides services for maternal and child
health. Stella Maris Medan Women's and Children's
Hospital has several integrated polyclinics that can
help serve family health. By presenting the best
doctors, as well as medical services provided, as a
form of commitment of Stella Maris Medan Women's
and Children's Hospital to reliable health services for
all maternal and child health problems. Based on the
performance indicators achieved by the Stella Maris
Hospital in Medan in 2017, the Bed Occupancy Rate
(BOR) is 80.2%, the Average Length of Stay (ALOS)
is 2.7 days and the Turn Over Interval (TOI) is 1 day
whereas in 2018, the number of BOR was 72.9%,
ALOS was 2.8 days and TOI was 0.6 days (RSIA
Stella Maris, 2019). The ideal BOR parameter value
is 60-85%, the ALOS value is between 6-9 days, the
TOI value is in the range of 1-3 days (MOH RI,
2005).
The latest data that researchers obtained from the
Stella Maris Mother and Child Hospital Medan that
the number of inpatient visits during the last 3 months
was June 2019 as many as 2140 visits, as of July 2019
as many as 2151 visits, and as of August 2019 as
many as 2071 visits. Fluctuations have been seen over
the past 3 months, and in August 2019 the lowest
compared to June 2019 and July 2019. The decline is
presumably due to patients feeling less satisfied with
inpatient care.
Structural Equation Model (SEM), an analysis of
variance-based structural equations designed to solve
multiple regressions when 25 specific problems occur
in data such as relatively small sample sizes, missing
or abnormal data and multicollinearity that aims to
predict relationships between constructs and explain
the theoretical relationship between these constructs
(Ghozali & Laten, 2015; Kusumandari et al, 2018;
Turnip et al, 2018).
A preliminary survey that researchers conducted
by interviewing 10 inpatients about the satisfaction
felt during treatment. As many as 5 people expressed
satisfaction, while 2 others stated that they were quite
satisfied, and 3 people stated that they were not
satisfied. Patient dissatisfaction is usually caused by
doctors and nurses who are less friendly, less
responsive when asked for help, and others. In this
study, predictions of inpatient satisfaction with
service quality with the Structural Equation Modeling
(SEM) method were developed.
2 METHOD
This type of research is a quantitative analytic study
with a cross sectional study design. The research was
conducted at the Stella Maris Hospital in Medan in
November 2019. The study population was all
inpatients as many as 2,071 people, and samples were
obtained as many as 250 respondents. Univariate data
analysis, bivariate using chi-square test, and
multivariate using multiple logistic regression tests
with a confidence level of 95% ( = 0.05).
Analysis techniques were used to interpret and
analyze data. In accordance with the model developed
in this study, the data analysis tool used was SEM,
which is operated through the AMOS 16.0 program
(Hair et al, 1998; Ferdinand, 2006). Using the stages
of modeling and analysis of structural equations into
7 steps, namely: theoretical model development;
Arrange path diagram; Turn a path diagram into a
structural equation; Choose an input matrix for data
analysis; Assessing model identification; Assessing
Goodness-of-Fit Criteria; Model estimation
interpretation.
The use of SEM can expand the ability to explain
with the existence of statistical efficiency as a model
that tests the method thoroughly. Hypothesis testing
is done using a structural equation model using
AMOS software. For the purpose of rejecting or
accepting a hypothesis, a significance level of P <0.05
was used. After the raw data has been collected, the
data are then presented in various forms: (i)
Presentation of the results of the initial analysis. (ii)
Presentation of SEM analysis. (iii) Testing and
research hypotheses based on the results of data
processing.
3 RESULTS AND DISCUSSIONS
Characteristics of respondents ie most respondents
aged <40 years were 58.0%. Based on gender, all
respondents involved were female. Based on
Prediction of Inpatient Satisfaction with Service Quality with SEM Method
127
education, the majority of respondents had a diploma
education of 49.6%, a small proportion had a high
school education of 20.0%. Based on work, most
respondents were housewives as much as 38.8%, a
small proportion of respondents worked as
entrepreneurs as much as 36.0%. Based on the length
of stay, the majority of respondents had been treated
for 2 days as much as 49.2%, a small portion had been
treated for 5 days as much as 2.8%.
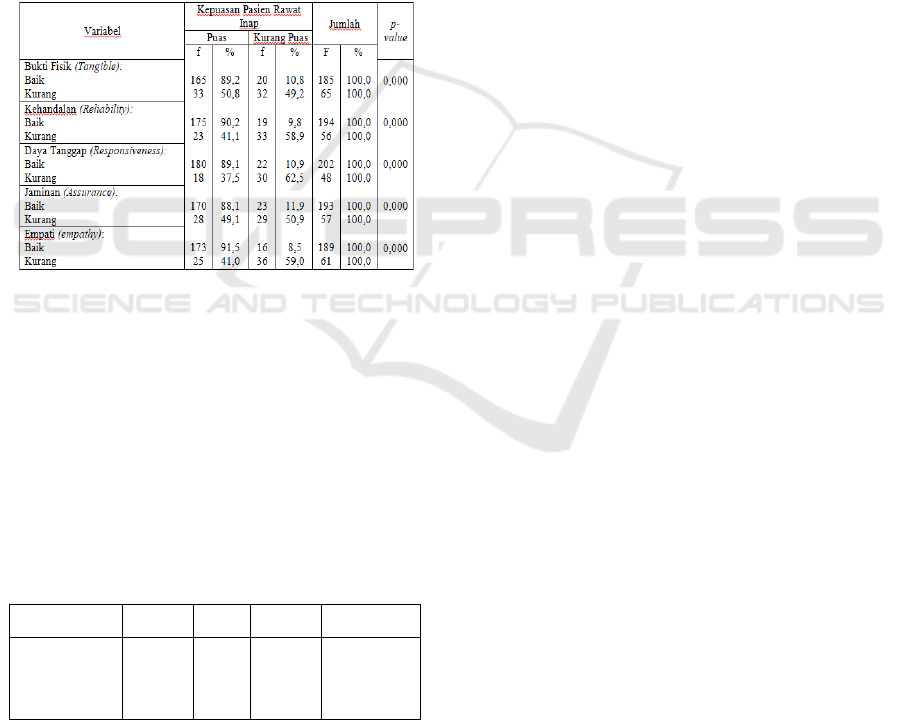
Based on the results of bivariate analysis, all
independent variables were found to be significantly
related to inpatient satisfaction (p = 0,000). The
complete Chi-Square statistical test results can be
seen in Table 1.
Table 1: Relationship of Each Independent and Dependent
Variable.
The results of multivariate analysis (Table 2) with
multiple logistic regression tests showed that of the 5
variables as model candidates, 4 variables were
obtained that affected maternal satisfaction, namely
tangible, reliability, responsiveness, and empathy.
The most influential variable in this study was the
responsiveness variable which has a value of Exp (B)
/ OR = 7.985 meaning that mothers who state good
hospital responsiveness, have the opportunity to feel
satisfied with pregnancy and childbirth services by
7.9 times higher.
Table 2: Multiple Logistic Regression Test Results.
Variables B Sig. Exp (B)
95% CI for
Exp(B)
Tangible
Reliability
Responsiveness
Empathy
Constant
1,166
2,035
1,904
1,832
-1,524
0,013
0,000
0,000
0,000
3,209
7,656
6,715
6,246
1,279-8,052
3,013-19,453
2,536-17,782
2,490-15,667
3.1 Tangible Factors
Based on the results of the study showed that there
was a relationship of physical evidence with inpatient
satisfaction, p = 0.013 <0.05. Variable physical
evidence that has a value of Exp (B) / OR = 3.209
means that patients who state good physical evidence,
have the opportunity to feel satisfied with hospital
services by 3.2 times higher than patients who claim
physical evidence is not good.
This study is in line with research conducted by
Burhanuddin (2016) to get the result that there is a
relationship between the quality of health services
based on the dimensions of physical evidence and
patient satisfaction of BPJS participants. Research
conducted by Nova (2015) that examined the effect
of service quality on inpatient satisfaction stated that
the greatest influence was the variable of
manifestation or physical evidence (5,191). Based on
the results of research conducted by Winarno (2015)
that from the test results, the first hypothesis can be
explained through the sign parameter b1 in the
regression equation, which in this study is positive,
namely (+ 0.165) and t test where tcount (1,914)> t
table (1,660 ), then H0 is rejected and Ha is accepted.
This means that there is a positive and significant
influence of tangibles variable on service user
satisfaction. Physical manifestations include the
appearance and completeness of physical facilities
such as treatment rooms, buildings, and the
availability of clean parking lots, neatness, and
comfort of waiting rooms and examination rooms, the
completeness of communication and appearance
equipment (Tjiptono & Chandra, 2015). Everyone
wants service satisfaction so they can feel the
importance of the physical evidence presented by the
developer.
The results prove that physical evidence was
significantly related to inpatient satisfaction. Patients
who state that good physical evidence tends to be
satisfied with the services provided. Everyone's
satisfaction is actually very relative, depending on
their perceptions and social status. Hospital physical
evidence makes inpatients feel satisfied with regard
to comfort, cleanliness, neatness, and appearance.
This makes the patient feel satisfied with the services
related to tangible.
3.2 Reliability Factors
The results showed that there was a relationship of
reliability with inpatient satisfaction, p = 0,000 <0.05.
The reliability variable has a value of Exp (B) / OR =
7.656, meaning that patients who state good
reliability, have the opportunity to feel satisfied with
hospital services at 7.6 times higher. Fatas research
(2017) states that the results of the analysis with
Cartesian diagrams show two attributes included in
quadrant A, firstly doctors and nurses are quick in
HIMBEP 2020 - International Conference on Health Informatics, Medical, Biological Engineering, and Pharmaceutical
128

providing the services needed, both doctors and
nurses patiently listen to patient complaints. The
results of Triwahyuni's research (2015) show that
perceptions about the quality of reliable doctor
services have an influence on the satisfaction of
inpatients. Winarno's research results (2015) get
results that prove that there is a positive and
significant influence of the reliability variable on
service user satisfaction.
The reliability dimension shows the ability to
provide services according to the promises offered.
The assessment is related to the timeliness of service
at registration, the time of treatment / examination,
the suitability between expectations and the
realization of time for patients (Tjiptono & Chandra,
2015). The demand for reliability of health workers in
providing fast, appropriate, easy and smooth services
is a condition for patient evaluation in showing the
actualization of the work of health workers. The
satisfaction of these patients in the assessment of
reliability is the ability of health workers to provide
services immediately and satisfactorily as desired by
patients and families (Azwar, 2016).
The results of this study prove that the reliability
variable of health workers was related to the
satisfaction felt by hospitalized patients. The
reliability variable is the most related to inpatient
satisfaction. The services provided can be relied upon
if it is in accordance with the wishes of the consumers
related to the speed of service time and accuracy in
providing services which will ultimately have an
impact on the achievement of customer satisfaction.
The reliability of health workers can be seen from the
ability of health workers (doctors and nurses) who are
professional in providing services to patients and
families. Health workers check the condition of
patients from morning to night on a regular basis,
nurses pay attention to the cleanliness of the patient's
body being treated, control the infusion that is
installed, as well as provide counseling or health
education in accordance with the illness suffered by
the patient so that it can add insight into the
knowledge of the patient and family.
3.3 Responsiveness Factors
The results showed that there was a fast response
relationship with inpatient satisfaction, p = 0,000
<0.05. The variable rapid response has a value of Exp
(B) / OR = 6,715 meaning that patients who state
good hospital responsiveness are good, have the
opportunity to feel satisfied with hospital services by
6.7 times higher. Rosjid's research results (2016)
found that all service quality variables included in the
five dimensions of Servqual stand alone or
simultaneously, have a pretty close correlation with
customer satisfaction, especially the variable
responsiveness. Research conducted by Mukti,
Hamzah, & Nyorong (2015) shows that the results of
statistical tests using the chi square test obtained p
value = 0.002. This means that there is an effect of
responsiveness or timeliness on patient satisfaction.
The results showed that 63.6% of respondents said
they were dissatisfied with hospital staff who were
not responsive or not on time.
Quick response or timeliness in service was the
ability of the hospital to provide services as promised,
which includes the speed and accuracy of officers in
providing services include: accuracy in procedures
for patient acceptance, registration, speed of health
workers when asked for help, when examined and
diagnosing the disease and healing of diseases
(Azwar, 2016).
The results of this study prove that the
responsiveness of health workers was significantly
related to the satisfaction felt by inpatients. Patients
who claim that health workers are responsive in
providing services tend to feel satisfied. This is
related to the speed of the nurse if called by the patient
or family in less than 5 minutes, the nurse is
responsive in helping to meet the needs of eating /
drinking when the patient cannot do it himself,
doctors and nurses always check the condition after
taking action to see reaction from the actions taken,
health workers show readiness and always be willing
to help if requested by patients and families. In
addition, doctors and nurses also explained further
care at home in accordance with the conditions of the
illness experienced.
3.4. Empathy Factors
The results showed that there was an empathy
relationship with inpatient satisfaction, p = 0,000
<0.05. Empathy variable which has a value of Exp (B)
/ OR = 6.246 means that patients who state good
hospital empathy, have the opportunity to feel
satisfied with hospital services by 6.2 times higher.
Empathy is an important variable in increasing the
satisfaction of inpatients.
Based on research conducted by Prabowo, Noer;
aini, & Supriyadi (2016) shows that most respondents
have satisfied empathy (71.9%). There is a
relationship between the quality of service
dimensions of empathy with insurance patient
satisfaction. This is also in line with the study of
Winarno (2015) which found that there was a positive
and significant influence of empathy variables on
Prediction of Inpatient Satisfaction with Service Quality with SEM Method
129
service user satisfaction. Research conducted by
Immas, Saryadi, & Dewi, (2015) found that there was
a significant influence between empathy on patient
satisfaction. Where the better the empathy is given,
the higher the customer satisfaction.
Empathy is one of the factors driving the progress
of the hospital. Because empathy is needed by people
who are sick or who are being treated. If the empathy
given is not appropriate then the patient will not use
services at the hospital let alone recommend to others.
Factors of empathy or personal attention can make an
effective contribution or the greatest contribution to
increasing patient loyalty. The personal attention
factor is thought to be closely related to the level of
customer satisfaction with all facilities and the quality
of service they have received.
The results of this study prove that empathy is
significantly related to the satisfaction of inpatients.
Empathy is shown by health workers (doctors and
nurses) by communicating well with patients with
sympathy, giving more attention to patients that
patients do need attention both physically and
psychologically, health workers always seek approval
when taking action or doing examination. Likewise,
manners and manners are shown by health workers
when they take action. In addition, health workers
provide the opportunity for patients to express
feelings or complaints that are felt. Health workers
explain care and treatment procedures using language
that is easy to understand.
To facilitate management and make decisions
regarding variables that are considered to have a large
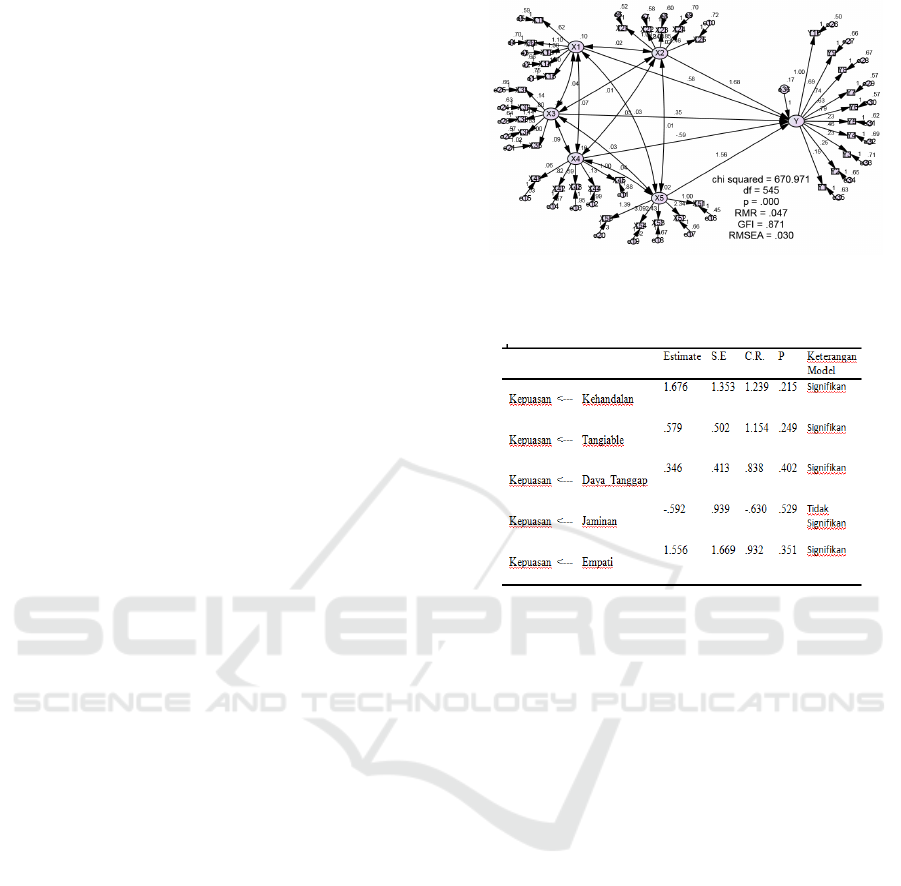
role, modeling using SEM methods is carried out. The
results of testing the structural model to test the
relationship of service quality, satisfaction and trust
are presented in Figure 1 through the model's
Goodness of Fit test. The model suitability test results
on the full SEM model show the results of the
evaluation of the model suitability for the full SEM
model. Of the eight criteria, only two criteria meet the
Goodness of Fit value, namely CMIN / DF with a
value of 0.871 (cut-off value <2.00) and RMSEA
with a value of 0.030 (cut-off value <0.08). The
parsimony principle and the rule of thumb say that the
model can be said to be fit or meet if there are at least
one or two goodness of fit criteria that meet (Rinaldo,
2009). Referring to the principle of parsimony and
rule of tumb, it can be concluded that the model built
is good and acceptable.
Figure 1: Model design using the SS method
Table 3: Effect of service quality on loyalty of Inpatients
The results of the calculation of hypothesis testing
between variables can be seen in Table 3. From the
hypothesis testing Table 3 can be explained as
follows: Hypothesis 1: Reliability significantly
influences the satisfaction of inpatients at the
hospital. The standardized regression weight between
reliability and patient satisfaction is 1,676 with a t /
C.R. = 1,239 (Probability = 0.215). Thus it can be said
that the influence is positive and significant. These
results provide support for the first hypothesis.
Hypothesis 2: Tangiable has a significant effect on
inpatient satisfaction. The standardized regression
weight between reliability and patient satisfaction is
0.346 with a t / C.R value. was 0.838 (Probability was
0.249) thus it can be said that in order to achieve
inpatient satisfaction one of the aspects required is
tangiable. The effect is positive and significant. These
results provide support for the selected hypothesis.
Hypothesis 3: Responsiveness significantly
influences inpatient satisfaction. The standardized
regression weight between reliability and patient
satisfaction is -0.592 with a t / C.R value. was -0.630
(Probability was -0.592). Thus it can be said that
Responsiveness is a very influential factor to achieve
patient satisfaction where the effect is positive and
significant to further provide support for hypothesis
3. Hypothesis 4: Health insurance does not
significantly influence patient satisfaction. The
HIMBEP 2020 - International Conference on Health Informatics, Medical, Biological Engineering, and Pharmaceutical
130
standardized regression weight between reliability
and patient satisfaction is -0.592 with a t / C.R value.
was -0.630 (Probability was 0.351). Thus it can be
said that Empathy is one of the factors that has a
significant influence on achieving patient
satisfaction. Hypothesis 5: Empathy has a significant
effect on patient satisfaction. The standardized
regression weight between reliability and patient
satisfaction is 1,556 with a t / C.R value. was 0.932
(Probability was 0.529). Thus it can be said that
health insurance is one of the factors that does not
have a significant influence on achieving patient
satisfaction. This is evidenced by the positive value
shown by the standardized regression weight.
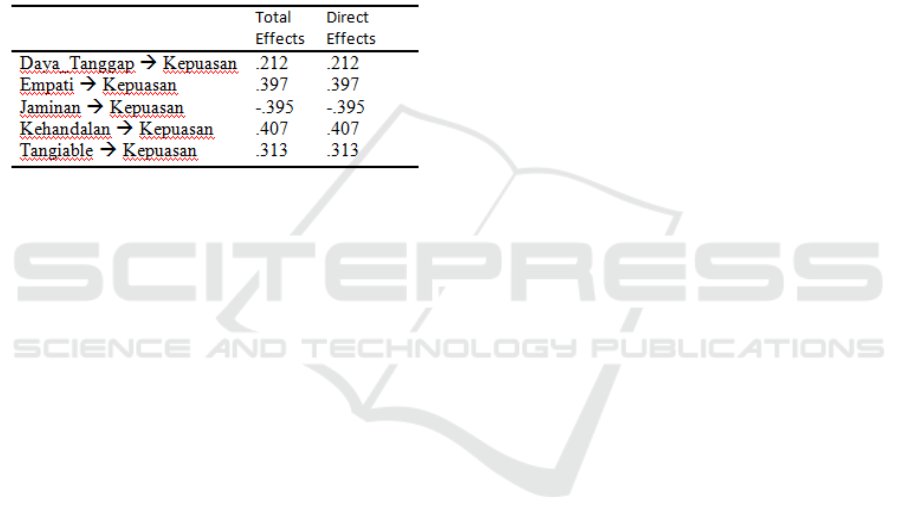
Table 4: Effect of service on satisfaction.
From Table 4 it can be concluded that
responsiveness, empathy, reliability, tangiable have a
direct influence on inpatient satisfaction. Others with
health insurance that has a negative value indicates
that it does not have a positive direct effect that is too
influential on patient satisfaction. If seen from Table
4, the biggest factor for achieving inpatient
satisfaction in hospital was the responsiveness factor
with a total effect of 0.21 which means that the
percentage of satisfaction with responsiveness is
79%.
4 CONCLUSIONS
The results showed that all variables except collateral
affect the satisfaction of inpatients. The most related
variable is reliability which has an Exp (B) / OR value
= 7.656 meaning that patients who state the reliability
of health workers are good, have the opportunity to
feel satisfied with hospital services by 7.6 times
higher than patients who state the reliability of health
workers is not good. Using SEM method, the the
biggest factor for achieving inpatient satisfaction in
hospital was the responsiveness factor with a total
effect of 0.21 which means that the percentage of
satisfaction with responsiveness is 79%.
REFERENCES
Arwani, M. (2011). Pengaruh KualitasPelayanan Fasilitas
dan Harga terhadap kepuasan pelanggan (Studi Kasus
RS PKU Muhammadiyah Gubug). Jurnal Ekonomi
Manajemen, 1(1), 21-28.
Azwar, A. (2016). Menjaga Mutu Pelayanan Kesehatan
(Cetakan 3). Jakarta: Pustaka Sinar Harapan.
Burhanuddin, N. (2016). Hubungan Mutu Pelayanan
Kesehatan Dengan Kepuasan Pasien Rsud Syekh Yusuf
Gowa. Jurnal MKMI, 12(1), 41-46.
Depkes RI. (2005). Indikator Kinerja Rumah Sakit. Jakarta:
Departemen Kesehatan Republik Indonesia.
Fatas, I. A. (2017). Analisis tingkat kepuasan pasien rawat
inap terhadap Mutu pelayanan di rumah sakit Hidayah
Boyolali (Fakultas Passcasarjana Universitas
Muhammadiyah Surakarta). Retrieved from
http://eprints.ums.ac.id/48719/24/Naskah Publikasi-
ardo.pdf
Ferdinand, A. 2006. Structural Equation Modelling dalam
Penelitian Manajemen. Badan Penerbit Diponegoro,
Semarang.
Ghozali. (2015). Structural Equation Modelling (SEM)
Metode Alternative dengan Partial Least Square (PLS).
Edisi 4, Semarang : Badan Penerbit Universitas
Diponegoro.
Kusumandari, D., Risqyawan, M., Yazir, M., Turnip, M.,
Darma, A. and Turnip, A., 2018. Application of
convolutional neural network classifier for wireless
arrhythmia detection, Journal of Physics: Conference
Series, Volume 1080 (2018) 012048 doi:
10.1088/1742-6596/1080/1/012048.
Immas, H. A. P., Saryadi, & Dewi, R. S. (2013). Pengaruh
Kualitas Pelayanan terhadap Kepuasan Pasien di
Rumah Sakit Islam Kota Magelang. Jurnal Ilmu
Administrasi Bisnis, 2(3), 110-116.
Isnindar, Saputra, I., & Robiyanto. (2013). Analisis Tingkat
Kepuasan Pasien Rawat Inap Di Ruangan Penyakit
Dalam Terhadap Pelayanan Di Instalasi Farmasi
Rumah Sakit Periode Desember 2011-Februari 2012.
Jurnal Manajemen Dan Pelayanan Farmasi, 3(4), 231-
248.
Mukti, W. Y., Hamzah, A., & Nyorong, M. (2013).
Pengaruh Mutu Layanan Kesehatan Terhadap
Kepuasan Pasien Rawat Inap Di Rumah Sakit
Woodward Kota Palu. Jurnal AKK, 2(3), 35-41.
Nova, R. F. (2010). Pengaruh Kualitas Pelayanan Terhadap
Kepuasan Pasien Rawat Inap Pada Rumah Sakit Pku
Muhammadiyah Surakarta. Fakultas Ekonomi
Universitas Sebelas Maret Surakarta.
Nursalam. (2011). Manajemen Keperawatan. Aplikasi
dalam Praktik Keperawatan Profesional. In Salemba
Medika (Edisi 3).
https://doi.org/10.1001/archinte.165.22.2659
Prabowo, S., Noer;aini, I., & Supriyadi. (2016). Hubungan
Mutu Pelayanan Perawat Dengan Kepuasan Pasien
BPJS Di Unit Rawat Inap RSUD Tugurejo Semarang.
Program Studi S1 Ilmu Keperawatan STIKES
Telogorejo Semarang.
Prediction of Inpatient Satisfaction with Service Quality with SEM Method
131

Rahmawati, Febriana, A., & Stefanus, S. (2013). Mutu
Pelayanan Kesehatan Berdasarkan Dimensi Dabholkar
di Ruang Rawat Inap Penyakit Dalam. Jurnal
Administrasi Kesehatan Indonesia, 1(2), 132-139.
Rosjid, H. (2012). Analisis Kepuasan Pasien Rawat Inap
terhadap Mutu Pelayanan Rumah Sakit Umum Nirmala
Suri Sukoharjo dengan metode Servqual. Program
Pasca Sarjana Universitas Indonesia.
RSIA Stella Maris. (2019). Laporan Kinerja RSIA Stella
Maris Medan Tahun 2017-2018. Medan.
Sakti, V. D. S. (2009). Analisis Kepuasan Pasien Rawat
Inap Terhadap Kualitas Pelayanan Kesehatan Ditinjau
Dari Status Sosial Ekonomi. Universitas Sanata
Dharma.
Tjiptono, F., & Chandra, G. (2015). Service, Quality &
Satisfaction. In Edisi 4. Yogyakarta: ANDI.
Triwahyuni, C. (2012). Pengaruh Mutu Pelayanan
Terhadap Kepuasan Pasien Rawat Inap RSU Bunda
Thamrin Medan. Fakultas Kesehatan Masyarakat
Universitas Sumatera Utara.
Turnip, A., Andrian, Turnip, M., Dharma, A., Paninsari, D.,
Nababan, T., Ginting, C.N., 2020. An application of
modified filter algorithm fetal electrocardiogram
signals with various subjects, International Journal of
Artificial Intelligence, vol. 18, no., 2020.
Turnip, A., Ilham Rizqywan, M., Kusumandari, D., et al.,
2018. Classification of ECG signal with Support Vector
Machine Method for Arrhythmia Detection, Journal of
Physics: Conference Series, Vol. 970 (2018) 012012
doi: 10.1088/1742-6596/970/1/012012.
Turnip, A., Kusumandari, D., Pamungkas, D., 2018. Drug
Abuse Identification based EEG-P300 Amplitude and
Latency with Fuzzy Logic Calssifier, IEEE International
Conference on Applied Engineering, (ICAE), 3-4 Oct.
2018, DOI: 10.1109/INCAE.2018.8579378.
Warda, A., Junaid, & Fachlevy, A. F. (2016). Hubungan
Persepsi Mutu Pelayanan Dengan Tingkat Kepuasan
Pasien Puskesmas Perumnas Di Kota Kendari Tahun
2016. Naskah Publikasi Halu Oleo, 1(1), 3-9.
Winarno, T. (2015). Pengaruh Kualitas Pelayanan
Terhadap Kepuasan Pasien Di RSUD Sragen. Fakultas
Ekonomi Dan Bisnis Universitas Muhammadiyah
Surakarta.
Wijaya, C., Andrian, M., Harahap, M., Turnip, A., 2019.
Abnormalities State Detection from P-Wave, QRS
Complex, and T-Wave in Noisy ECG, Journal of
Physics: Conference Series, Volume 1230, (2019)
012015. doi:10.1088/1742-6596/1230/1/012015.
HIMBEP 2020 - International Conference on Health Informatics, Medical, Biological Engineering, and Pharmaceutical
132
