
Decision Making Model for Choosing Normal Maternity or Cesarean
Section with Machine Learning Approach
Rimin, Ermi Girsang, and Sri Lestari R. Nasution
Faculty of Medical, Universitas Prima Indonesia, Indonesia
Keywords: Choice of delivery, Normal delivery, cesarean section.
Abstract: Globally, the number of cesarean section has almost doubled, namely 12% in 2000 to 21% in 2015. While
more than 50 developing countries have cesarean birth rates> 27%. Normal childbirth actually has many
advantages over cesarean section, but data in various hospitals shows an increase in cesarean section rates.
The purpose of this study was to identify the relationship of factors that influence mothers with the decision
to choose normal delivery or cesarean section. An evaluation of 3,121 respondents with 118 samples was
conducted. Statistical evaluation using univariate and bivariate analysis with chi-square test, and multivariate
analysis with multiple logistic regression at 95% confidence level ( = 0.05) was performed. Whereas the
model of the relationship of the main factors in decision making in the selection of maternity scenarios was
built using machine learning approach. Statistical evaluations indicate that there are only three variables (i.e.,
culture, lifestyle, and perception, p ≤ 0.009) that have a relationship with the decision of the mother to choose
normal delivery or cesarean section. The factor with the greatest relation is perception (Exp (B) / OR was
3.305).
1 INTRODUCTION
Delivery of cesarean section is becoming a trend now
not only for mothers who have medical indications,
but also those who do not experience medical
indications (reasons for wanting to adjust the desired
date and day). Another reason is that labor is fast,
does not experience pain such as giving birth
normally and can maintain a slim body appearance
(Kasdu, 2015).
A systematic review published studies from the
first year of records through August 2018 in PubMed,
Scopus, and Web of Science showed that the reasons
of maternal request for cesarean section were fear of
childbirth, fear of labor pain, anxiety for fetal
injury/death, pelvic floor and vaginal trauma, urinary
incontinence, doctors suggestion, time of birth,
experience of prior bad delivery, previous infertility,
anxiety for gynecologic examination, anxiety for loss
of control, anxiety for lack of support from the staff,
fear of fecal, avoid long labor, emotional aspecs, body
weight of the infant at birth and abnormal prenatal
examination. The results of studies on demographic
reasons of maternal request for cesarean section were
advanced maternal age, occupation, parity, maternal
obesity, education, family status, decreasing level of
religiosity, number of living children, household
income and age at marriage (Jenabi E et al, 2019)
Excessive and unnecessary use of cesarean
section is growing as a major problem for women’s
health for which both developed as well as
developing countries. There is no evidence to show
any benefits either to mother or to infant when the
procedure is not medically indicated (Panda et al.,
2017).
Globally, infants born with cesarean section
increased by 12% in 2000 to 21% in 2015 (Marleen,
2018). The high rate of cesarean delivery makes
WHO set the average standard for cesarean delivery
in a country around 5-15% per 1000 births in the
world (Suryati, 2012). WHO also reviewed 110,000
births from nine countries in Asia during 2007-2008,
showing that 27% of births were performed cesarean
section. A similar survey conducted in Latin America
found that 35% of pregnant women were born
through cesarean section (Sihombing, 2017).
Around 23 million cesarean deliveries were
performed globally in 2012. The international health
care community previously considered the 10% and
15% levels to be ideal for cesarean section (Hamilton,
2018). More than 45 countries globally have cesarean
birth rates <7.5%, while more than 50 developing
88
Rimin, ., Girsang, E. and R. Nasution, S.
Decision Making Model for Choosing Normal Maternity or Cesarean Section with Machine Learning Approach.
DOI: 10.5220/0010289200880095
In Proceedings of the International Conference on Health Informatics, Medical, Biological Engineering, and Pharmaceutical (HIMBEP 2020), pages 88-95
ISBN: 978-989-758-500-5
Copyright
c
2021 by SCITEPRESS – Science and Technology Publications, Lda. All rights reserved

countries have cesarean birth rates> 27% (Molina et
al., 2015).
In 2017 in the United States, around 32% of
women in the hospital were delivered by cesarean
section (Hamilton, 2018). Primary cesarean delivery
and repetition means that the mother giving birth at
the first delivery in a cesarean section will do the
same thing in the next delivery (Menacker, Declercq
& Macdorman, 2016).
The incidence of cesarean section birth at the
request of the mother and her contribution to the
increase in cesarean section rate is not known with
certainty, but it is estimated that around 2.5% of all
deliveries in the United States are cesarean section at
the request of the mother (Meredith, Birsner, & Flint,
2019). In a retrospective cohort study of 66,266
mothers giving birth in China, there were 24.7% of
deliveries with cesarean section at the request of the
mother (Liu, Landon, Cheng, & Chen, 2015).
It was found that the USA (84,5%) and Australia
(77,3%) had the highest proportion of obstetricians
who would perform a cesarean section on maternal
request in uncomplicated pregnancies, while Spain
(15%) and Canada (23%) had lowest proportion
(Loke et al., 2019). Behind a maternal request for a
planned cesarean section are various rationales and
life experiences needing carefully targeted attention
and health care (Eide et al, 2019). Women who
requested a cesarean section had higher antepartum
depression and anxiety levels (Olieman et al., 2017).
The study of cesarean section rate among doctors
in S.V. Medical College, Tirupati indicates that the
rapid socio-economic changes and the outlook
towards medical intervention by the women, families
and society are increasingly responsible for the
current high incidence of cesarean section. For
doctors point of view it is a defensive medicine to
have a better outcome (Radha et al., 2015).
The number of cesarean section in Indonesia also
continues to increase both in government hospitals
and in private hospitals. According to the Indonesian
Demographic and Health Survey Data (SDKI) in
1991-2007 there was an increase in cesarean section
births, which was between 1.3% -6.8% (Ministry of
Health Republic of Indonesia, 2018a). The results of
the 2018 Riskesdas show that cesarean delivery rates
were 9.8% of the total 49,603 births during 2014-
2017, with the highest proportion in DKI Jakarta
(19.9%) and the lowest in Southeast Sulawesi (3.3%)
(Ministry of Health) RI, 2018b). The standard of
caesarean delivery according to the Ministry of
Health is 40% (Ayuningtyas, Oktarina, Misnaniarti,
& Sutrisnawati, 2018).
One of the effects of cesarean section is pain and
results in changes in tissue continuity due to
abdominal surgery. According to Hillan in
(Anggorowati & Sudiharjani, 2011) that 68% of post-
sectio caesarean mothers have difficulty caring for
infants, difficulty moving up and down from bed and
arranging a comfortable position during
breastfeeding due to pain, thereby delaying
breastfeeding from the beginning of the baby
(Batubara, 2008). Cesarean section is associated with
an increased risk of uterine rupture, abnormal
placentation, ectopic pregnancy, stillbirth, and
preterm birth. (Sandall, 2018). After cesarean section
there can be infection, bleeding, formation of blood
clots in the legs, pelvic organs or lungs, injury to the
intestine and / or bladder and reactions to drugs or
anesthesia (Kasdu, 2015). The emergence of various
postoperative complications after cesarean does not
dampen the interest of the mother to give birth in a
cesarean section, although there are no medical
indications (Menacker et al., 2006).
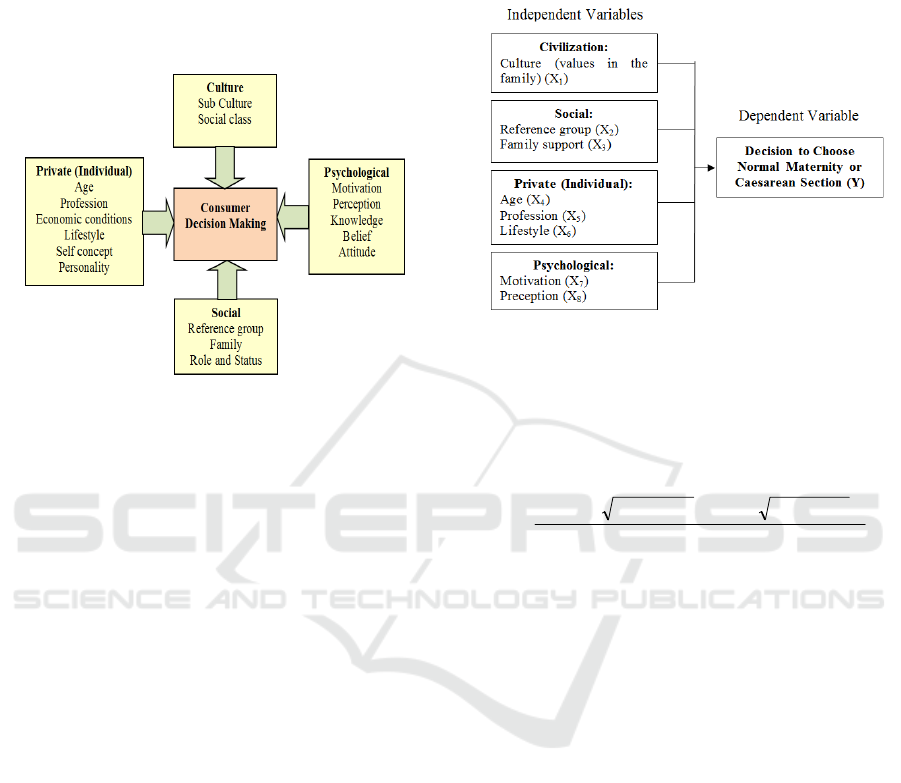
The decision to choose a health service facility in
a hospital are influenced by several factors /
components (Figure 1). According to Kotler and
Armstrong, the factors that influence the decision to
choose service facilities are social factors, cultural
factors, individual factors and psychological factors.
Social factors consist of reference groups, family, role
and status. Cultural factors include culture, sub-
culture, social class. Individual factors include age,
occupation, economic conditions, lifestyle,
personality and self-concept. Psychological factors
include motivation, perception, knowledge, beliefs
and attitudes (Kotler & Armstrong, 2014; Turnip et
al, 2020; Wijaya et al, 2019).
Based on interviews conducted in the initial
survey of 10 mothers who gave birth, namely 5
normal births, and 5 cesarean delivery mothers,
normal delivery mothers said that they wanted to feel
a true mother can give birth to a normal baby, afraid
of having cesarean delivery, costs cheaper, during
pregnancy there are no significant problems or
disorders of pregnancy so they want to give birth
normally.
Mothers who choose cesarean delivery say fear of
pain or fear of pain experienced by many mothers
who give birth normally, want to give birth according
to a beautiful date, want to give birth on a special day
like according to their wedding date, in addition he
also has a less pleasant experience on normal delivery
before. There are also mothers whose reason because
of a husband's request to give birth by cesarean
section so that the shape of the vagina does not change
after delivery, and the body shape of the mother can
Decision Making Model for Choosing Normal Maternity or Cesarean Section with Machine Learning Approach
89
be slim like before pregnancy. The medical doctor has
actually explained to the mother who will give birth
about the procedure and the negative effects of
cesarean section delivery and the existence of a code
of ethics about cesarean delivery if done without
medical indications, but many mothers who still want
to do it.
Figure 1: Theoretical Framework for Decision Making
(Kotler & Armsrtong, 2014)
In this study, the decision making model for
choosing normal maternity or cesarean section with
fuzzy method is performed. The relationship between
the factors that influenced the mother in deciding on
a normal delivery or cesarean section in relation to the
characteristics of the respondents was evaluated.
2 METHOD
This research was a quantitative analytic study with
cross sectional research design. The study was
conducted at the Stella Maris Hospital in Medan in
November 2019. The number of deliveries (normal
and cesarean section) from January 2019 - October
2019 was 3,121 deliveries (1,064 normal deliveries,
2,057 cesarean section divided into 403 cesarean
section deliveries without medical indication and
1,654 cesarean section cesarean with medical
indications). The research sample obtained by 118
respondents. Sampling technique by accidental
sampling.
The conceptual framework of this study consists
of independent and dependent variables. The
independent variable consists of cultural factors
consisting of Culture (values in the family); Social
factors consist of reference groups, family support;
Private (individual) factors consist of age, profession,
lifestyle; Psychological factors consist of motivation
and perception. The dependent variable is the
decision to choose normal delivery or cesarean
section. The full research conceptual framework can
be seen in Figure 2.
Figure 2: Research Scheme
The sample is a portion taken from the whole
object studied and is considered to represent the entire
population (Notoatmodjo, 2015). The sample of this
study was a portion of the population whose size was
taken using the Lemeshow formula as follows:
2
2
12/1
1)1(
PoPa
PaPaZPoPoZ
n
Where n is the sample size, Z
(1
is the standard
deviation of the alpha for = 0.05 à Z= 1.96, Z
(1
is the standard deviation of beta for = 0.10 à Z =
1,282, Po is the proportion of the prevalence of
cesarean section without medical indication, Pa is the
estimated maternal cesarean section without medical
indication, Pa-Po is the proportion difference of 0.10.
Validity test is used to measure the validity of an
instrument used (able to express what is measured).
This test was conducted at Sarah Medan General
Hospital as many as 30 women. The test conducted
is to determine the correlation between the questions
with the total construct score or variable. A
construct is declared valid if there is a positive and
significant correlation in the Pearson Product
Moment test. The correlation value must be greater
than 0.361 or the Corrected Indicator-Total
Correlation value in SPSS output greater than 0.361
(Ghozali, 2015). Univariate data analysis, bivariate
using chi-square and multivariate tests using
multiple logistic regression tests with a confidence
level of 95% ( = 0.05).
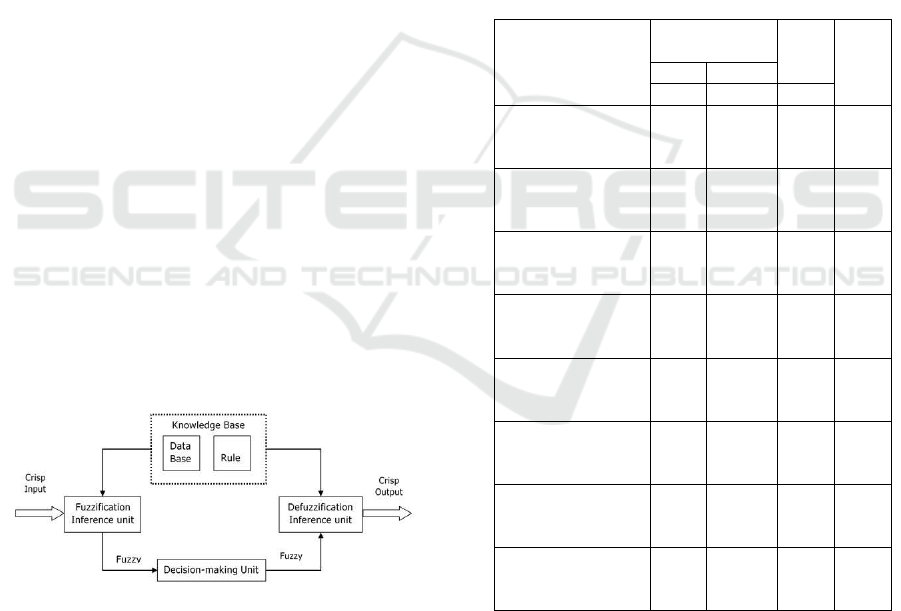
Fuzzy Logic (Fuzzy Logic) or commonly also
called Samar Logic is an appropriate way to map an
input space into an output space based on the concept
HIMBEP 2020 - International Conference on Health Informatics, Medical, Biological Engineering, and Pharmaceutical
90
of fuzzy sets. Among the inputs and outputs are black
boxes. Inside the black box there is an unknown
process, it can be approached with a linear system
approach, econometrics, interpolation, expert
systems or fuzzy logic. Fuzzy logic as the main
component of soft computing builders, has proven to
have excellent performance to solve problems that
contain uncertainty (Kusumandari et al, 2018; Turnip
et al, 2018). Its implementation is broad, both in the
fields of engineering, psychology, social, and also in
the economic field. This research is used to make
decisions for Choosing Normal Maternity or
Caesarean Section.
The Crisp set is defined by the items in that set. If
a is a member of A, then the value associated with a
is 1. However, if a is not a member of A, then the
value associated with a is 0. Notation A = {x P (x)}
indicates that A contains item x with P (x) is correct.
If XA is a characteristic function of A and property P,
then it can be said that P (x) is true, if and only if XA
(x) = 1. To design a fuzzy system the following steps
need to be carried out: (i) Define the functional and
operational characteristics of the model. (ii) In this
section, it is necessary to consider what
characteristics the existing system has, and then
formulate the characteristics of operations to be used
in the fuzzy model. (iii) Decomposing the model
variables into fuzzy sets. From the variables that have
been formulated, fuzzy sets are formed without
ignoring the domain. (iv) Making fuzzy rules. The
rules on fuzzy show how a system operates. How to
write rules in general are: If (X1 is A1). ... (Xa is An)
Then Y is B where (.) is an operator (OR or AND), X
is scalar and A is a linguistic variable. The block
diagram of fuzzy interference system is shown in
Figure 3.
Figure 3: Block diagram of fuzzy interference system.
3 RESULTS AND DISCUSSIONS
Characteristics of respondents involved in data
collection are the latest education and the number of
births. The observations showed that the majority of
respondents had an undergraduate education of 49
respondents (41.5%), the minority had a midle high
school education of 1 respondent (0.8%). Based on
the number of births, the majority of respondents gave
birth to their first child as many as 59 respondents
(50.0%), the minority gave birth to a fifth child of 1
respondent (0.8%).
Based on the results of bivariate analysis with the
Chi-Square test obtained variables that have a
significant relationship with the selection of normal
maternity or cesarean section with a value <0.05
namely culture (p = 0.005), reference group (p =
0.008), family support (p = 0.003), lifestyle (p =
0.021), motivation (p = 0.003) and perception (p =
0.002). Whereas the unrelated variable because it has
a value of p> 0.05 is age (p = 0.253), and occupation
(p = 0.701).
Table 1: Relationship of each Independent and Dependent
Variable (Normal and CS is C-Section).
Variables
Childbirth
Metho
d
p-
value
NCS
ff F
Age (years):
20-35
> 35
63
6
41
8
104
14
0,253
Profession:
Working
Not Workin
g
44
25
29
20
73
45
0,701
Culture:
Follow
Not Follow
44
25
18
31
62
56
0,005
Reference group:
Follow
Not Follow
39
30
15
34
54
64
0,008
Family support:
Support
Not Su
pp
ort
63
6
34
15
97
21
0,003
Lifestyle:
Lifestyle
Not Lifest
y
le
13
56
19
30
32
86
0,021
Motivation:
High
Low
40
29
14
35
54
64
0,003
Perception:
Good
Not Goo
d
56
13
26
23
82
36
0,002
Furthermore, multivariate analysis with multiple
logistic regression tests showed that out of 8 research
variables, there were 6 variable logistic regression
candidates, p <0.25, namely culture, reference group,
family support, lifestyle, motivation and perception.
While the variables that were not included in the
model candidate because it has a value of p> 0.25
were age and occupation. The results of multiple
Decision Making Model for Choosing Normal Maternity or Cesarean Section with Machine Learning Approach
91

logistic regression tests (Table 2) show that of the 6
variables tested about 3 variables related to the
selection of normal maternity or cesarean section
namely culture (values in the family), lifestyle and
perception.
The most dominant variable related to the
selection of normal childbirth or cesarean section is
the perception variable with the value Exp (B) / OR =
3.305 meaning that mothers with good perceptions,
have the opportunity to choose normal childbirth by
3.3 times higher than mothers with poor perception.
Table 2: Multiple Logistic Regression Test Results.
Variable B Sig. Exp(B)
95%CI for
Exp(B)
Culture
Lifestyle
Perception
Constan
t
1,130
1,260
1,195
-1,427
0,009
0,009
0,008
0,007
3,096
1,284
3,305
1,333-7,193
1,110-6,732
1,359-8,037
3.1 Culture Factors
The results of this study indicate that there was a
relationship between culture and the mother’s
decision to choose a normal delivery or cesareaen
section. Mothers who follow the culture in the family
which always give birth with normal delivery, have
the opportunity to choose normal delivery by 3 times
higher than mothers who do not follow the culture.
Culture is the result of human creativity form one
generation to the next generation which greatly
determines the behaviour of the members in their
life as a society. Culture is complex which includes
science, artistic beliefs, morals, customs, habits and
norms that occurs in the society. According to
Kotler, values in the family is included in the culture
(Kotler, 2014).
The culture in the family influence a person to
make a decision. Many groups can influence a
person’s behaviour especially in the family. A
person’s reference group consists of all groups that
have direct (face-to-face) or indirect influence on a
person’s attitude or behaviour, especially in the
famiy. Groups of direct influence on a person are
called membership groups. This is a group in which a
person participates and interacts (Tjiptono, 2014).
The results of this study indicate that culture is
related to the mother’s decision to choose normal or
caesarean section. According to researchers’
assumptions, this is because the habits that occur in
the family will be carried out by other family
members. Likewise in the case of childbirth, other
family members will follow the culture in the family
when they are about to give birth. Usually families
who have normal childbirth habits, in choosing a
birth, the respondent will also choose to have a
normal birth. Likewise, families who have the habit
of giving birth by caesarean section will also choose
to give birth by caesarean section. This is also due to
the type of delivery chosen after getting information
from family or closest relatives, as well as
suggestions from the family or relatives who suggest
choosing childbirth that is usually done by the family.
Culture in the family or relatives has a major
influence on the decision of the mother to choose type
of delivery, whether nomal or caesarean delivery,
especially without medical indications.
3.2 Lifestyle Factors
The results of this study indicate that there was a
relationship between lifestyle and the mother's
decision to choose a normal delivery or cesarean
section. Mothers who do not follow a lifestyle, have
the opportunity to choose normal childbirth by 1.2
times higher than mothers who follow a lifestyle.
Reasons that oftenly given by patients to deliver labor
with cesarean section were not resistant to pain, worry
about damage to the birth canal which is also a sexual
organ and a factor of trust in dates and numbers.
The doctor's reason for fulfilling patient requests
is generally to respect and pay attention to the
patient's autonomy rights and the Medical Practice
Law No. 29 of 2004 Article 52 paragraph d. (fear of
being blamed if something bad happens to the mother
and baby). Reasons that are not allowed are financial
considerations (GoI, 2004).
To prevent the misuse of the cesarean section at
the request of the patient or family by an Obstetrician
and Gynecology specialist, the following signs
should be made: The patient must submit a request to
the doctor for cesarean section. Next the doctor must
explain that at that time vaginal delivery is still
possible and cesarean section is no better / safer than
vaginal delivery. The signs as above must be stated
clearly and clearly in the cesarean section request
sheet at the request of the patient / family, which is
incorporated in the informed consent sheet and
permission for action (POGI, 2017).
Lifestyle is a lifestyle of someone in the world
expressed in one's activities, interests and opinions
(Kotler & Amstrong, 2014). Delivery of cesarean
section has become a way of life, especially for young
people. There was a trend of an increase in cesarean
section in a number of hospitals, whereas the clinical
risk for mothers giving birth was greater than the risk
of vaginal delivery. But the perception of the
community, especially young people, about cesarean
section delivery is a fast and painless way of birth as
HIMBEP 2020 - International Conference on Health Informatics, Medical, Biological Engineering, and Pharmaceutical
92

experienced in normal childbirth (Simanjuntak,
2012).
The results of this study indicate that lifestyle was
related to the mother's decision to choose normal
delivery or cesarean section. According to the
researchers' assumptions, lifestyle is a personal factor
(individual) of the mother herself, especially those
who choose cesarean section without medical
indications that assume cesarean section is a modern
way to deal with the pain during childbirth. As for
mothers who choose normal childbirth, assume that
with normal childbirth, she will become a whole
mother. As it is the case now, lifestyle returns to
nature which means that everything in natural is more
interesting and has great benefits for itself.
3.3 Perception Factors
The results of this study indicate that there was a
relationship of perception with the decision of
mothers to choose normal delivery or cesarean
section. Mothers who have a good perception have a
chance to choose normal delivery by 3.3 times higher
than mothers with poor perception. Perception is the
process that people go through in choosing,
organizing and interpreting information to form a
meaningful picture of the world. Someone which
motivated is ready to act. How the person acts is
influenced by their perception of the situation (Kotler
& Armstrong, 2014).
The results of this study indicate that perception
was related to the mother's decision to choose normal
delivery or cesarean section. According to the
researchers' assumptions, mothers who had the
perception that childbirth was painful decided to
choose cesarean section while mothers who had the
perception that giving birth normally were a pleasure.
Especially if he does not have a medical indication for
cesarean delivery then he prefers to give birth
normally. Normal delivery process is longer and
painful, but now there are many therapeutic
techniques that can be used to reduce pain during
normal labor such as hypnobirthing, Entonox gas,
ILA (Intrathecal Labor Analgesia) and others. Giving
birth normally through a long process involves a
mother's hard work and results in physical fatigue.
However, many benefits are obtained by giving birth
normally, such as being able to leave the hospital
more quickly, avoiding the risks caused by surgery,
the mother can directly interact with the baby, not too
worried about the next pregnancy or childbirth and so
forth. Cheap and painless normal delivery perceptions
need to be explained to mothers since pregnancy,
especially for young mothers so that more mothers
give birth normally and take classes in hospitals such
as pregnancy exercise, hypnobirthing, etc.
3.4 Machine Learning Approach
In the implementation phase, three processes were
carried out, namely application testing,
documentation, and analysis of test results.
Application testing aims to see the results of
applications that have been made whether running
well or not. Tests conducted were black box testing
(Turnip et al, 2018). This test was run to observe
whether the program has successfully received input,
processed, and produced the appropriate output
without looking at the application source code.
In analyzing the problem, the first thing to do was
to determine what parameters were used as input to
the system. Second, observations made by the author
indicate that what will be used as input reference was
the calculation obtained from the evaluation variables
in the form of culture, reference groups, family
support, life style, motivation, and preception. Third,
how the input values of these variables can be
identified by ANFIS to produce an output so that the
problem in predicting the decision for choosing
normal maternity or cesarean section is resolved.
Decision making prediction application is an
application that can predict maternity choices only by
entering input variables as a result of measurement
(Figure 4). Prediction of maternity choices can be
done by taking the unique value of the maternity
variable which will be converted into a certain value
which is the identity of each decision and through a
process of matching or matching training data. The
database used was training data from maternity
choices.
In the process of evaluating maternity choices
preceded by taking the value of variables that have
been determined by the Region of Interest.
Furthermore, the value will be converted into a new
value that is searched for the average value and will
be used as input parameters in ANFIS.
The training of 80 training data uses six input
membership function linear trimf output curves with
40 epochs (Figure 5), and a hybrid optimization
method. After the training process was completed, the
ANFIS Architecture is formed as Figure 6.
Membership function and parameters formed from
the training process are shown in Figure 7.
Decision Making Model for Choosing Normal Maternity or Cesarean Section with Machine Learning Approach
93
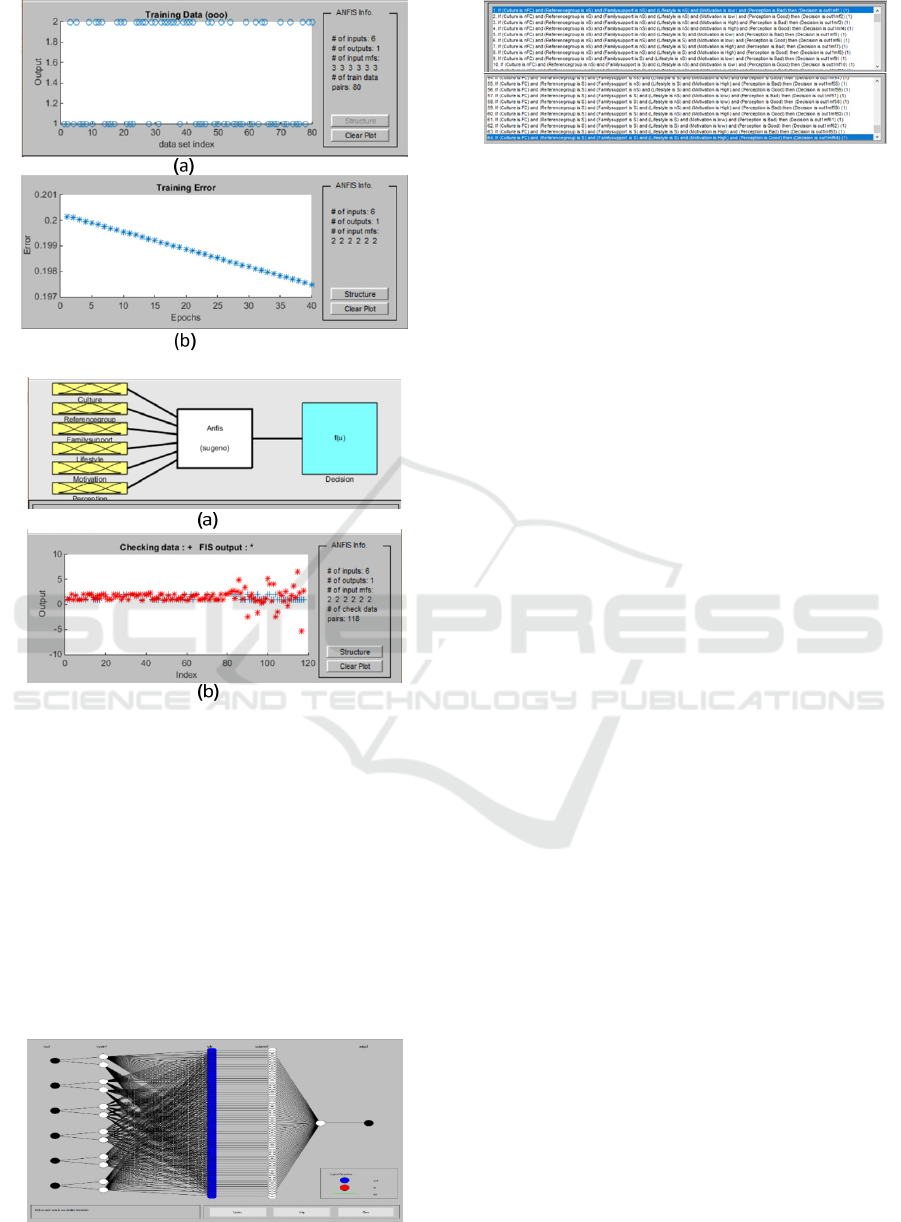
Figure 4: Trainig data and Training Error
Figure 5: Membership function and FIS output.
In testing the prediction choice of maternity
applications using the ANFIS method. The application
can identify 111 correctly from a total of 118 input
data. The overall success percentage was 94.24%.
From 80 training data trained, all images were correctly
identified. This shows the percentage of success
identifying data that has been trained by 100%.
Meanwhile, from 38 data that have not been trained or
have not yet gone through the ANFIS training process
there are 36 results that are correctly identified so that
the percentage of success in identifying the data that
has not been trained is 94.24%.
Figure 6. Adaptive neural network architecture.
Figure 7: The applied rules for modeling.
4 CONCLUSIONS
There is a cultural relationship (values in the family),
lifestyle and perception with the mother's decision to
choose normal delivery or cesarean section. There is
no relationship between the reference group, family
support, age, occupation and motivation with the
mother's decision to choose a normal delivery or
cesarean section. The most dominant variable related
to the mother's decision to choose a normal delivery
or cesarean section in this study is the perception
variable. Mothers who have good perception, have
the opportunity to choose normal delivery by 3.3
times higher than mothers whose perceptions are not
good.
Based on the results of the study concluded that to
predict maternity choice decisions can be done using
the Adaptive Neuro Fuzzy Inference System method
as a matching tool with the values of variables that
have been trained. From the results of testing of input
data, this application has an overall success rate of
94.24%. With this application, maternity choice
decisions can easily be predicted based on variable
values that are set without having to retake data.
REFERENCES
Anggorowati, & Sudiharjani, N. (2011). Mobilisasi Dini
dan Penyembuhan Luka Operasi pada Ibu Post Sectio
Caesarea (SC) di Ruang Dahlia Rumah Sakit Umum
Daerah Kota Salatiga. Departemen Keperawatan
Maternitas Dan Anak PS Ilmu Keperawatan FK Undip.
Ayuningtyas, D., Oktarina, R., Misnaniarti & Sutrisnawati,
N. N. D. (2018). Etika Kesehatan pada Persalinan
Melalui Sectio Caesarea Tanpa Indikasi Medis. Jurnal
MKMI, 14(1), 9–16.
Batubara, S. (2008). Hubungan Pengetahuan, Nyeri Sectio
Caesarea dan Bentuk Puting dengan Pemberian Air
Susu Ibu Pertama Kali pada Ibu Post Partum. Jurnal
Keperawatan Sudirman (The Soedirman Journal of
Nursing, 3(2), 24–34.
Eide KT., Morken, NH., & Baerie K. (2019). Maternal
Reasons for Requesting Planned Cesarean Section in
HIMBEP 2020 - International Conference on Health Informatics, Medical, Biological Engineering, and Pharmaceutical
94

Norway: A Qualitative Study. BMC Pregnancy and
Chilbirth, 19:102.
Ghozali, I (2015). Aplikasi Analisis Multivariat dengan
Program SPSS (Cetakan 7). Semarang: Universitas
Diponegoro Press.
Hamilton, B. E. (2018). Births: Provisional Data for 2017.
NVSS. Vital Statistics Rapid Release.
Jenabi E et al. (2019). Reasons for Elective Cesarean
Section on Maternal RequestL A Systematic Review. J
Matern Fetal Neonatal Med, 1-6.
Kasdu, D. (2015). Operasi Caesar: Masalah dan Solusinya
(Cetakan 3). Jakarta: Puspa Swara.
Kemenkes RI. (2018a). Data Survei Demografi Kesehatan
Indonesia (SDKI) Tahun 2017. Jakarta: Kementerian
Kesehatan Republik Indonesia.
Kemenkes RI. (2018b). Riset Kesehatan Dasar (Riskesdas)
Tahun 2018. Jakarta: Kementerian Kesehatan Republik
Indonesia.
Kotler, P. (2014). Manajemen Pemasaran di Indonesia :
Analisis, Perencanaan, Implementasi dan Pengendalian
(Cetakan 2). Jakarta: Salemba Empat.
Kotler, P., & Armstrong, G. (2014). Prinsip-prinsip
Pemasaran (Edisi 13). Jakarta: Erlangga.
Kusumandari, D., Risqyawan, M., Yazir, M., Turnip, M.,
Darma, A. and Turnip, A., 2018. Application of
convolutional neural network classifier for wireless
arrhythmia detection, Journal of Physics: Conference
Series, Volume 1080 (2018) 012048 doi:
10.1088/1742-6596/1080/1/012048.
Liu, X., Landon, M. B., Cheng, W., & Chen, Y. (2015).
Cesarean Delivery on Maternal Request in China: What
are the Risks and Benefits? Am J Obstet Gynecol,
212(817), el-9.
Loke AY., Davies L., Mak YW. (2019). Is It the Decision
of Women to Choose a Cesarean Section as the Mode
of Birth? A review of Literature on the Views of
Stakeholders. BMC Pregnancy and Childbirth, 19:286.
Marleen, T. (2018). The Lancet: Cesarean Section Use has
Almost Doubled Globally Since 2000.
http://www.thelancet.com/journals/
lancet/article/PIIS0 140- 6736.
Menacker, F., Declercq, E., & Macdorman, M. F. (2006).
Cesarean Delivery: Background, Trends and
Epidemiology. Seminars in Perinatology.
https://doi.org/10.1053/ j.semperi.2006.07.002
Meredith, L., Birsner, M. D., & Flint, T. P. M. D. (2019).
Cesarean Delivery on Maternal Request. ACOG
Committee Opinion No. 761. American College of
Obstetricians and Gynecologists. Obstet Gynecol,
133e73-7.
Molina, G., Weiser, T. G., Lipsitz, S. R., Esquivel, M. M.,
Uribe-Leitz, T., Azad, T., & Shah, N. (2015).
Relationship Between Cesarean Delivery Rate and
Maternal and Neonatal Mortality. JAMA - Journal of
the American Medical Association, 314(21), 2263–
2270.
Notoatmojo, S. (2015). Metodologi Penelitian Kesehatan
(Cetakan 2). Jakarta: Rineka Cipta.
Olieman RM., Siemonsma F., Bartens MA., Niegel SG.,
Scheele F., & Honig A. (2017). The Effect of an
Elective Cesarean Section on Maternal Request on
Peripartum Anxiety and Depression in Women with
Chilbirth Fear: A Systemic Review. BMC Pregnancy
and Childbirth, 17:195.
Panda SR., Jain M., Jain S (2017). Rising Trend in
Caesarean Section Rate: A Community Heath Hazard.
Biomed J Sci & Tech Res. Vol 1 – Issue 5, 1476-1478.
Pemerintah RI. (2004). Undang-Undang Praktek
Kedokteran No. 29 tahun 2004. Jakarta: Lembaran
Negara Republik Indonesia Nomor 116.
POGI. (2017). Panduan Etik dan Profesionalisme Obstetri
dan Ginekologi di Indonesia. SK PB POGI No.
003/SK/PB.POGI/2017. Perkumpulan Obstetri dan
Ginekologi Indonesia.
Radha K., Devi GP., Manjula RV., Chandrasekharan PA
(2015). Study On Rising Trends Of Caesarean Section
(C-Section): A Bio-Sociological Effect. Journal of
Dental and Medical Sciences. Vol 14, Issue 8 Ver II,
10-13.
RSIA Stella Maris. (2019a). Data Persalinan Normal dan
Seksio Sesarea Tahun 2017 dan 2018. Medan.
RSIA Stella Maris. (2019b). Data Persalinan Normal dan
Seksio Sesarea Tahun 2019 (Januari 2019 - Oktober
2019). Medan.
Sandall et al (2018). Short-term and Long-term Effects of
Caesarean Section on the Health of Women and
Children. Lancet 392(10155): 1349-1357.
Sihombing, N. (2017). Determinan Persalinan Sectio
Caesarea di Indonesia (Analisis Lanjut Data Riskesdas
2013). Jurnal Kesehatan Reproduksi, 8(1), 63–75.
Simanjuntak, R. (2012). Persalinan Seksio Sesarea
(Cetakan 2). Jakarta: Sagung Seto.
Suryati, T., 2012. (Analisis Lanjut Data Riskesdas 2010)
Persentase Operasi Caesaria di Indonesia Melebihi
Standard Maksimal, Apakah Sesuai Indikasi Medis?
Buletin Penelitian Sistem Kesehatan, 15(4), 331–338.
Tjiptono, F. (2014). Manajemen Jasa (Cetakan 1).
Yogyakarta: Andi Offset.
Turnip, A., Andrian, Turnip, M., Dharma, A., Paninsari, D.,
Nababan, T., Ginting, C.N., 2020. An application of
modified filter algorithm fetal electrocardiogram
signals with various subjects, International Journal of
Artificial Intelligence, vol. 18, no., 2020.
Turnip, A., Ilham Rizqywan, M., Kusumandari, D., et al.,
2018. Classification of ECG signal with Support Vector
Machine Method for Arrhythmia Detection, Journal of
Physics: Conference Series, Vol. 970 (2018) 012012
doi: 10.1088/1742-6596/970/1/012012.
Turnip, A., Kusumandari, D., Pamungkas, D., 2018. Drug
Abuse Identification based EEG-P300 Amplitude and
Latency with Fuzzy Logic Calssifier, IEEE International
Conference on Applied Engineering, (ICAE), 3-4 Oct.
2018, DOI: 10.1109/INCAE.2018.8579378.
Wijaya, C., Andrian, M., Harahap, M., Turnip, A., 2019.
Abnormalities State Detection from P-Wave, QRS
Complex, and T-Wave in Noisy ECG, Journal of
Physics: Conference Series, Volume 1230, (2019)
012015. doi:10.1088/1742-6596/1230/1/012015.
Decision Making Model for Choosing Normal Maternity or Cesarean Section with Machine Learning Approach
95
