
Identification of Influence Factors on Waiting Time of
Prescription Services for Outpatient
Dorra Ribta Alam, Ermi Girsang*, Sri Lestari R. Nasution
Faculty of Medicine,Universitas Prima Indonesia, Indonesia
Keywords: Waiting time, prescription service, hospital pharmacy.
Abstract: Waiting time is one of the minimum standards for pharmaceutical services in a hospital. From many studies,
there are still many pharmaceutical services that do not meet the established time standards. The purpose of
this study was to identify the factors that influence the waiting time for prescription services in Outpatient
Pharmacy. Analytical research uses cross-sectional design. With a sample of 100 prescriptions both finished
drugs and concoctions taken by simple random sampling method. Data analysis used univariate analysis,
bivariate analysis with Chi-Square Test and multivariate analysis with multiple logistic regression at 95%
confidence level (α = 0.05). The involved variableswere Type of Drugs, Number of Drug Items, Work Shift,
and Patient Status.It appears that the factors that influence the waiting time for prescription services awere
the number of drug items (p = 0.013) and patient status (p = 0.000). The most dominant variable was the
patientstatus with Exp (B) / OR about 15,546, which means patients with collateral status have a 15.5 times
higher chance of experiencing an extended prescription service compared to patients who pay in cash.
1 INTRODUCTION
Patient waiting times for hospital services are
identified by the World Health Organization (WHO)
as one of the benchmarks of the health care system.
Patient satisfaction plays a significant role in
determining the health outcomes and in the quality
of health-care services provided by any health-care
organization.It is also directly associated with the
patient–provider relationship and with thec
ompliance of treatment plans of the patients. Patient
satisfaction is measured by using several indicators
that include services provided by the health-care
professionals, cleanliness, quietness, and wait times.
Prolongation of waiting time has long been
something that is complained of by the public and
seen as one of the things that has the potential to
cause dissatisfaction with patients (Alrasheedi, K.F,
et al, 2019, Odili et al., 2017). A patient’s
experience of waiting for long periods of time can
completely influence his/her perceptions of service
quality. A close relationship between patient
satisfaction and waiting time has been studied in
many studies (Xie et al., 2017; Sun, Jing. et all.,
2017, Luis Margusino-Framiñán et al.,2017,
Sengupta, Mitali, et al., 2019). The 2017 report from
the Institute of Medicine’s Report on the US
"Crossing The Quality Chasm" underlines a
framework of 6 principles that must be met in order
to remain competitive in the field of health. One of
these principles is the ability to provide timely
services and reduce delays that can harm patients.
Pharmacy unit provides product services and
services in the form of prescription services.
Prescription services as the frontline of
pharmaceutical services to patients must be managed
properly, because the quality of pharmaceutical
prescription services is generally associated with
speed in providing services.An increasing number of
patients visiting outpatient care units will increase
increasing challenges for the pharmacy unit to
continue to work effectively in providing excellent
service to patients (Amerine, et al, 2017). A slow
service will cause a long queue, causing an
extension of the waiting time for drug services.
Several studies have been carried out where
prescription services are still found that are not in
accordance with established standards (Himawan,
Vanji Budi, et al., 2018). The minimum service
standard set by the Kepmenkes is <30 minutes for
finished drugs and <60 minutes for compound drugs.
From these standards, we will get the level of
efficiency, effectiveness and sustainability of
Pharmacy services through prescription service
Alam, D., Girsang, E. and R. Nasution, S.
Identification of Influence Factors on Waiting Time of Prescription Services for Outpatient.
DOI: 10.5220/0010286300230029
In Proceedings of the International Conference on Health Informatics, Medical, Biological Engineering, and Pharmaceutical (HIMBEP 2020), pages 23-29
ISBN: 978-989-758-500-5
Copyright
c
2021 by SCITEPRESS – Science and Technology Publications, Lda. All rights reserved
23

waiting times, as well as the level of comfort and
perception of Pharmacy services through patient
satisfaction. The speed of service is target service
time can be completed within the time taken
determined by the organizer unit service.
Various methods have been carried out to
improve pharmaceutical services in terms of
reducing waiting times for prescription services
(Johann Daniels, et al., 2018, Alam et al., 2018 ,
2015; Loh et al., 2017, Lau, et al. 2018). In a study
conducted by Nanda, et al., 2017, one of the factors
that caused the lengthening of prescription service
waiting times was due to the long queues and the
way that could be done to fix the problems caused
by this long queue was to change the structure of the
queue model. The way to improve the waiting time
is to use a technology-based queuing system and
improve the quality and quantity of human resources
in the pharmaceutical department
(Ulfa et al, 2017;
Turnip et al, 2020; Wijaya et al, 2019). Suryana,
Danyel, 2018, made improvements by proposing the
replacement of a new hospital license and activating
the function of the Quality Control Team in the
Pharmacy Installation.
Previous studies examined prescription waiting
times from the queuing model structure, the quality
and quantity of Human Resources in the pharmacy
unit . This study was designed to observes the effect
of each factor from the pharmacy itself (type of
drug, number of drug items, work shifts) and patient
status (payment status) on the waiting time for
prescription services and to identify the most
dominant factor influencing the waiting time for
prescription services.
2 METHOD
The study was carried at Pharmacy Unit of the
Children's Outpatient Services at the Stella Maris
Hospital in Medan in November - December 2019.
The population in this study was the number of
prescriptions that were received from the pediatric
outpatient services. Determination of the population
is based on the average number of recipes per month
The data obtained by researchers researchers that the
number of outpatient prescriptions for children
served in the Pharmacy Outpatient Services for
Children during January - September 2019 is as
follows: In January 2019 : 3951 prescriptions,
February 2019 : 3350 prescriptions, March 2019 :
3728 prescriptions, April 2019 : 3743 recipes, May
2019 : 3671 recipes, June 2019 : 3717 recipes, July :
recipes, August 2019 : 4809 recipes and in
September : 5442 recipes. Thus the average number
of prescriptions served in the Outpatient Pharmacy
of the Children's Services Unit is 4012 prescriptions.
By using the Slovin formula based on the calculated
population, the number of samples used in this study
is 100 recipes. Samples were taken at random from
outpatients. Data is collected by filling out the
research sheet that has been provided. The
instruments used are digital clock, stationery,
calculator and form fields to write data obtained in
the research sheet.
Prescription service time will be calculated
from the time the recipe is received at the Pharmacy
Unit until the drug is received by the patient.
Through quasi observing prescriptions received in
the Pharmacy Unit for outpatient cases of Child
Services in the Children's Services Outpatient Unit,
second floor of Stella Maris Hospital. Some factors
related to the time of outpatient prescription service
are: Types of prescriptions, number of drug items,
shift workers and patient status. In this study, the
dependent variable (Dependent) is the prescription
service time for outpatients in the Pharmacy
Installation, while the Independent Variable
(Independent) is the type of prescription, the number
of drug items, shift workers and patient status.
The data processing is carried out by carrying
out various stages, as follows:
1. Coding is to group the samples obtained in
accordance with the existing conceptual
framework. The sample is coded to facilitate
identification and input process to the
computer. The author categorizes the data
manually based on the group, namely the type
of prescription, the number of drug items, staff
shifts and the status of the patient into a
working paper including equating units of
time to minutes
2. Editing is to re-examine the completeness and
accuracy of data categorization manually
3. Data Entry is entering data into the computer,
in this study using SPSS
4. Cleaning is checking the data that has been re-
entered to ensure that the data is free from
errors.
Data analysis was carried out univariately to
analyze existing variables descriptively by
calculating the frequency distribution and the
proportions of each dependent and independent
variable. Bivariate analysis is continued using Chi-
Square to determine the relationship between the
dependent variable and independent variables and
multivariate analysis using multiple logistic
regression tests with a confidence level of 95% (α =
HIMBEP 2020 - International Conference on Health Informatics, Medical, Biological Engineering, and Pharmaceutical
24
0.05), to find out which variable most significantly
influences the waiting time for prescription services.
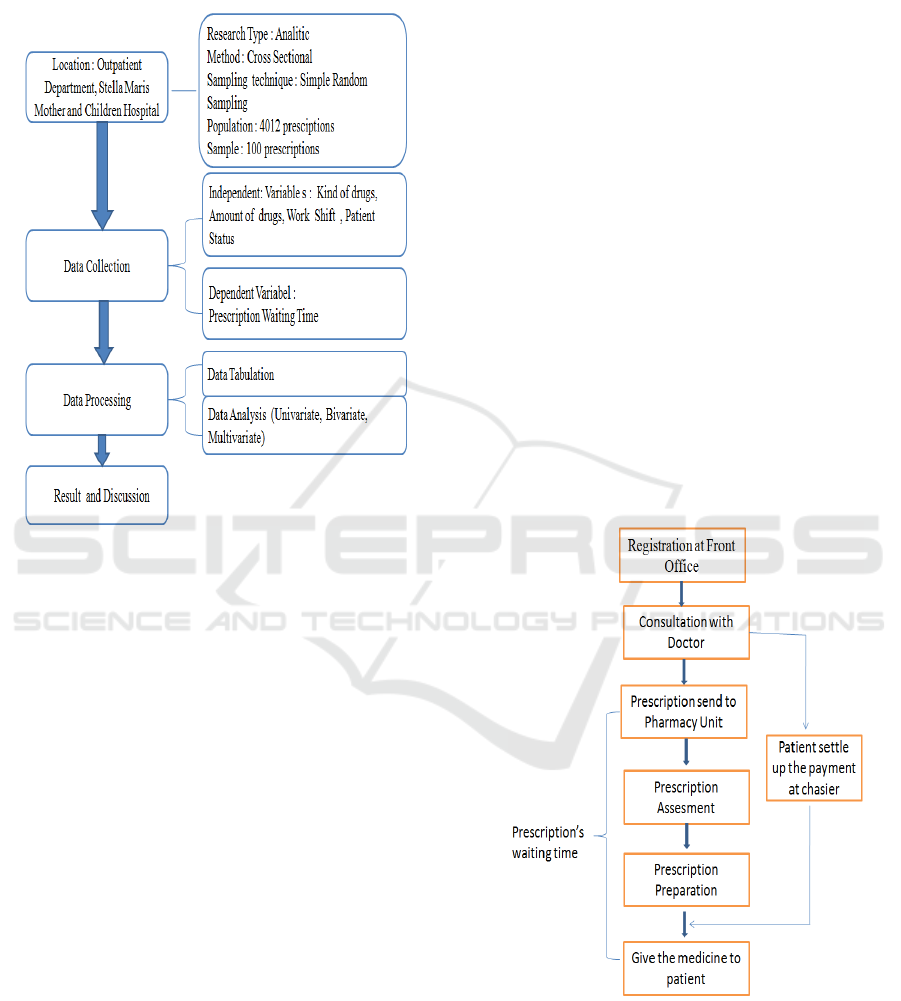
Overall the research is shown in Figure 1.
Figure. 1 The Scheme of Research Procedure
3 RESULT AND DISCUSSIONS
From the observations in the field, the flow of the
outpatient service process (figure 2) can be
explained as follows:
1. Patients registered at the Front Office.
2. Medical staff will conduct an assessment
(body weight, body temperature, patient’s
chief complains, history of allergic)
3. Patient will be served by doctor’s on duty.
4. If the patient needs medicine, the doctor will
give a prescription
5. Prescription is sent through the hospital
system (e-prescription).
6. After prescription are sent to the pharmacy
unit, patients will be asked to complete
payment at the hospital chasier. Patients can
take medicine after completed the payment
7. The pharmacist will open the patient’s
medical record to see the doctor’s prescription
and conduct the prescription assesment.
Prescription review has to accordance with
administrative requirements, pharmaceutical
requirements and clinical requirements.
8. Preparation consists of several stages:
Compounding, an activity of preparing,
weighing, mixing, packaging and giving
etiquette to the container. Etiquette. Drug
packaging. Submission of drugs. Before the
drug is delivered to the patient, a final check
must be made of the suitability of the drug
with the prescription and drug information.
9. After the medicine is finished prepare, the
pharmacy officer will deliver the drug to the
patient by showing proof of payment (if the
patient pays in cash) or there is confirmation
from the guarantor (if the patient is
guaranteed).
10. Patients have to be informed about the
medicine information that at least includes:
how to use the drug, how to store the drug, the
duration of treatment, activities and food and
drinks that must be avoided during therapy.
From the flow described, Waiting time for
prescription services in this research is defined the
time needed from the prescription received by the
pharmacy unit until the medicine is delivered to the
patient / family.
The flow for the prescription waiting time can be
seen in figure 2.
Figure. 2 The Flowchart of Outpatient Department Service
Identification of Influence Factors on Waiting Time of Prescription Services for Outpatient
25
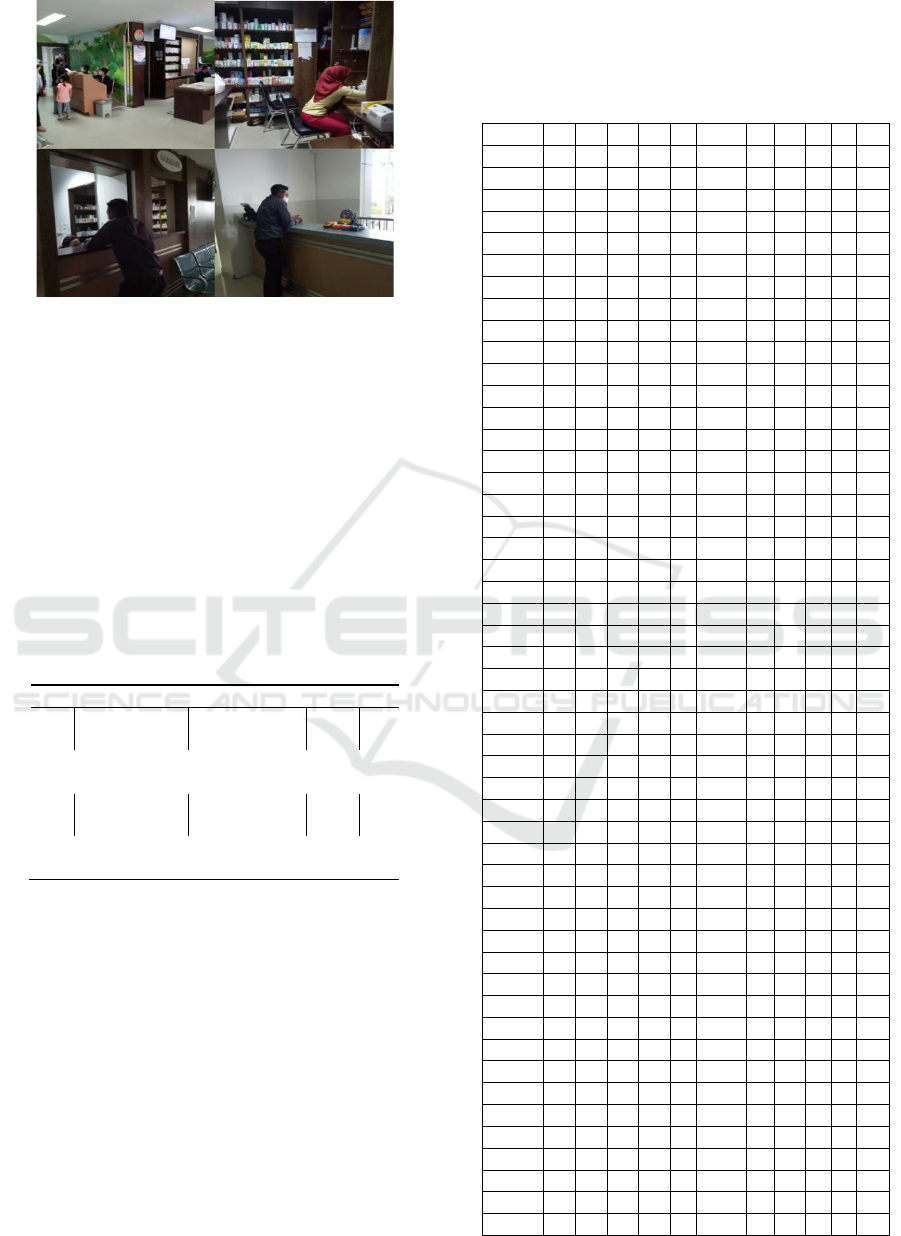
Figure. 3 Pictures of research process
The study was conducted by direct observation
in the field of prescriptions that entered the
children's outpatient services. Based on data from
100 samples taken, the frequency distribution of
each variable is 50% of finished drugs and 50% of
concoctions. The number of drug items in the
majority is large (55%), minority is small (45%).
The majority of work shifts are morning (59%), the
afternoon minority (41%) and the majority are cash
patients (87%), the minority is guaranteed (13%).
Shown Table 1.
Table 1: Frequency Distribution of Each Independent
Variable
No Independen Variables f %
1 Type Of
Drug
Fixed
Concoction
50
50
50
50
2 Items Few
Many
45
55
45
55
3
Shift Morning
Noon
59
41
59
41
4 Patient’s
status
Cash
Guarantee
87
13
87
13
Data taken from prescription are independent
variables (Table 1) patient status (A), work shift (B),
type of drug (C), number of drug items (D) and
Dependent variable was waiting time (E). Each
variable was given 2 categories: patient cash status
with code 1 and guarantee with code 2; morning
shift work with code 1 and afternoon with code 2;
Type of fixed drug with code 1 and concoction drug
with code 2; The number of drug items was few with
code 1 and many with code 2; Standard waiting time
to code 1 and not standard to code 2. The waiting
time periodwas from the time the prescription
received at the pharmacy to the medicine being
delivered to the patient. The standard time is <30
minutes for finished drugs and <60 minutes for
compound drugs. The measured data is given in
Table 2.
Table 2: The measured data for each variables of
evaluated prescription.
NO A B C D E NO A B C D E
1 1 1 1 2 2 51 1 1 2 2 1
2 1 1 1 2 2 52 1 1 2 1 1
3 1 1 1 1 1 53 1 1 2 1 1
4 1 1 2 2 1 54 1 1 1 1 1
5 1 1 2 1 1 55 1 1 1 1 1
6 2 1 2 2 2 56 1 1 2 1 1
7 2 1 2 2 2 57 1 1 2 2 1
8 1 1 1 2 2 58 1 1 2 2 1
9 1 1 1 2 1 59 1 1 1 1 1
10 1 1 1 1 1 60 1 1 1 2 1
11 1 1 2 2 1 61 2 1 1 1 1
12 1 1 2 2 1 62 1 1 1 2 1
13 1 1 2 1 1 63 1 1 2 2 1
14 1 1 1 2 1 64 1 1 1 2 2
15 1 1 2 2 1 65 1 1 1 2 1
16 1 1 1 1 1 66 1 1 1 1 1
17 1 2 2 1 1 67 1 1 2 2 1
18 1 2 1 1 1 68 1 1 1 1 1
19 1 2 1 1 1 69 1 1 2 2 1
20 1 2 2 1 1 70 2 1 2 2 1
21 1 2 1 1 1 71 2 1 1 2 2
22 1 2 1 2 1 72 1 1 1 2 2
23 1 2 2 2 1 73 1 1 1 2 2
24 1 2 2 1 1 74 1 1 1 2 2
25 1 2 1 2 1 75 1 2 1 1 1
26 1 2 2 1 1 76 2 2 2 2 2
27 1 2 2 1 1 77 1 2 1 1 1
28 1 2 2 1 1 78 1 2 1 2 2
29 1 2 1 1 1 79 1 2 2 1 2
30 1 2 1 1 2 80 1 2 2 2 1
31 1 2 2 2 2 81 1 2 1 1 1
32 1 2 2 2 1 82 1 2 1 2 1
33 1 2 1 1 1 83 1 2 1 1 1
34 2 2 1 2 2 84 2 2 1 1 1
35 1 2 1 2 1 85 1 2 2 1 1
36 1 2 1 1 2 86 1 2 2 2 1
37 1 2 1 1 1 87 2 2 1 2 2
38 1 2 1 1 1 88 1 2 2 2 1
39 1 2 2 2 1 89 1 1 2 2 1
40 2 2 1 2 2 90 1 1 2 1 1
41 1 2 2 2 1 91 1 1 2 2 1
42 1 2 2 1 1 92 1 1 1 2 1
43 1 2 1 2 1 93 1 1 2 2 1
44 1 1 2 1 1 94 1 1 1 1 1
45 2 1 1 1 2 95 1 1 2 2 1
46 1 1 1 1 1 96 1 1 1 2 2
47 1 1 2 2 1 97 2 1 2 2 2
48 1 1 2 2 1 98 2 1 2 2 2
49 1 1 2 1 1 99 1 1 1 1 2
50 1 1 2 2 1 100 1 1 2 1 1
HIMBEP 2020 - International Conference on Health Informatics, Medical, Biological Engineering, and Pharmaceutical
26

Data management was done by testing the
characteristics of each variable (Columns A, B, C, D
and E), then a bivariate test (Chi-square) was used to
determine the effect of the independent variables
(Columns A, B, C, D) on the dependent variable
(Column E). After finding a variable with a p-value
<0.05, it was continued with the Multiple Logistic
Regression test to find the most dominant factor
influencing the waiting time for prescription service.
From the data that has been processed, it appears
that the variable Drug Type (C): from 100
prescription samples, found 68% (34 prescriptions)
of finished drugs and 84% (42 prescriptions) of
concoction drugs that are in accordance with the
standards. Whereas 32% (16 prescriptions) of
finished drugs and 16% (8 prescriptions) of
concoction drugs did not meet the established time
standard. This means that for each drug category>
50% was still in accordance with the expected time
standard. It was in line with the chi-square
calculation where a p-value of 0.101 was obtained,
by mean that there was no effect of the type of drug
with prescription service waiting times (Table 3).
The number of drug items (D) prescribed by
doctors varies from 1-6 types of drugs. The mean
number of drugs prescribed was 2.77. For
prescriptions prescribed drugs <2.77 (small
category), those that were in accordance with the
standard are 88.9% and those that do not meet the
standard of 11.1%. For those who are prescribed>
2.77 (many categories), those that comply with the
standard are 65.5% and those that do not meet the
standard 34.5%. It appears that the more the number
of drugs prescribed, the higher the percentage of the
number of prescriptions whose waiting time does not
meet the established standards. These results were in
line with the Chi-Square test between types of drugs
to the waiting time for prescription services that get
p-value of 0.013, by mean that there was an
influence of the number of drug items to the waiting
time for prescription services (Table 3).
For the Work Shift variable (B), a total of 59
samples were taken on the work shift morning and
41 samples at the afternoon shift. Of the 59 recipes
in the morning shift that were in accordance with the
standards as many as 44 recipes (74.6%) and those
that did not comply with the standard were 15
recipes (25.4%). For 41 recipes in the afternoon
work shift that were in accordance with the standard
as many as 32 recipes (78%) and those that were not
in accordance with the standard were 9 recipes
(22%). Comparison of the percentage obtained in the
morning shift and the afternoon shift is almost the
same between those in accordance with the
standards and those that do not comply with the
standards. Statistical test results were in line with
using the Chi-Square test obtained p-value of 0.825
meaning that there was no effect of work shifts on
prescription service waiting times (Table 3).
Of the 100 samples obtained data for patient
status variables, 87 samples are private patients who
pay in cash and 13 samples are patients with
payments guaranteed by partner companies and
insurance. It appears that there were more patients
with cash payments than patients with collateral. Of
the 87 prescriptions for patients using the cash
payment method, 73 prescriptions (83.9%) were in
accordance with the standard and those that did not
comply with the standard were 14 prescriptions
(16.1%). For 13 recipes with a guarantee payment
method, 10 recipes (76.9%) were not in accordance
with the standard while 3 recipes (23.1%) were in
accordance with the standard. These results were in
accordance with the results of statistical tests using
the Chi-Square test obtained p-value of 0.000
meaning that there was an influence of patient status
on the waiting time for prescription services (Table
2).Based on the results of bivariate analysis obtained
independent variables significantly related to waiting
time for prescription services which the number of
drug items (p = 0.013) and patient status (p = 0.000).
The complete Chi-Square statistical test results can
be seen in Table 3.
Table 3: Effects of Each Dependent and Independent
Variables
Varia-
bles
Standard Out of
Standard
Qty
p-
value
f % f % F %
Type of
Drug :
Fixed
Concoc-
tion
34
42
68
84
16
8
32
16
50
50
100
100
0.1
01
Items:
Few
Many
40
36
88.9
65.5
5
19
11.1
34.5
45
55
100
100
0.0
13
Shift:
Mor-
ning
After-
noon
44
32
74.6
78
15
9
25.4
22
59
41
100
100
0.8
25
Patients
Status:
Cash
Guaran-
tee
73
3
83.9
23.1
14
10
16.1
76.9
87
13
100
100
0.0
00
After bivariate testing, it was continued with
multivariate testing with multiple logistic regression
to obtain the results as listed in Table 3.
Identification of Influence Factors on Waiting Time of Prescription Services for Outpatient
27

Table 4: Significant Multiple Logistic Regression Test
Results
Variables B Sig Exp(B) 95%CIfor
Exp(B)
Typeof
Drug
1.301 .033 3.672 1.113‐12.114
Patient
status
2.744 .000 15.546 3.606‐ 67.030
Constant ‐6.509
The most influential variable in this study is the
patient status variable which has an Exp (B) / OR
value = 15,546, which means patients with collateral
status have a 15.5 times higher chance of
experiencing extended prescription service time
compared to patients with cash status (without
guarantee).
Independent patients (without guarantee) can
make payments directly to the cashier. As for
patients with guarantees, the hospital billing
department must inform the guarantor in advance.
The billing process is considered complete when the
hospital billing staff has received confirmation from
the guarantor about the approval of the guarantee for
the services, procedures or drugs given to the
patient. Therefore, the difference in prescription
service time between independent and guaranteed
patients is the time needed to receive confirmation
from the guarantor of the cost of patient services. At
this time the hospital is doing all the confirmation
processes manually. To make improvements,
communication should be made with stakeholders so
that it can speed up the assessment and clarification
process related to the patient's condition. The
process that is carried out manually takes longer.
With the rapid development of technology, this
process should also be done using applications or e-
claims, so as to accelerate the process of hospital
services, especially in prescription services. Because
outpatients cannot receive drugs before the
clarification process is completed.
The variable number of drug items that have the
value Exp (B) / OR = 3.672 means that patients with
many drug items have a 3.6 times higher chance of
experiencing an extended prescription service time
compared to patients with a small number of drug
items.
The average number of prescriptions provided is
2.77, meaning that if the number of drugs prescribed
by a doctor is greater than 2.77, it will affect the
time required by the pharmaceutical staff to prepare
the prescription. The large number of items will
affect the addition of time in the numbering phase,
the stage of prescription entry, the stage of taking
fixed drugs and the stage of making concoction
drugs into capsules, packs, and liquids so that it
takes a longer time than those with fewer items.
The number of drug items related to the waiting
time for prescription services is caused by several
things, among others, outpatient pharmaceutical
facilities that are too narrow, thus limiting the space
for officers. The more the number of drugs
prescribed, the more time is needed to input the use
of drugs into the system. Therefore, it is need to
improve the pharmaceutical facilities in accordance
with established standards. Urge doctors through the
medical committee to prescribe drugs rationally and
reduce polypharmacy.
4 CONCLUSIONS
In this study, the infuence of six-variable on the
waiting time for prescription services was identified.
Patient status was the most dominant influence on
waiting time for prescription service (p-value =
0.000) and Exp (B) / OR = 15,546. Prescription
types about 68% of drugs and 84% of concoction
drugs are in accordance with the standard service
time (p-value = 0.101, no effect on the waiting time
for prescription services). The number of drug items
was 34.5% prescription with the category of the
number of drugs was still not according to the
standard (p-value = 0.013, there was an effect of the
number of drug items on the waiting time for
prescription services with Exp (B) / OR = 3,672).
Morning work shift, 74.6% prescription and
afternoon shift 78% are in accordance with the
standard (p-value = 0.82, there was no affect the
waiting time for prescription service).
REFERENCES
Alam, S. Osama , M. Iqbal, Sawar, 2018, Reducing
Pharmacy Patient’s Waiting Time, International
Journal of Healthcare Quality Assurance, Vol. 31 No.
7, 834-844.
Alrasheedi, K.F., et al., 2019. The Association Between
Wait Times and Patient Satisfaction: Findings From
Primary Health Centers in the Kingdom of Saudi
Arabia, Health Services Research and Managerial
Epidemiology, Volume 6: 1-7.
Bhattacharjee, P. and Ray, P. K., 2014. ‘Patient flow
modelling and performance analysis of healthcare
delivery processes in hospitals: A review and
reflections’, Computers & Industrial Engineering, 78,
pp. 299–312.
Committee on Quality Healthcare in America and Institute
of Medicine, 2017, Crossing the quality chasm a new
HIMBEP 2020 - International Conference on Health Informatics, Medical, Biological Engineering, and Pharmaceutical
28

health system for the 21
st
century. Washington DC.
National Academy Press.
Davidson, K. W., Shaffer, J., Ye, S., Falzon, L., Emeruwa,
I. O., Sundquist., 2017. Interventions to improve
hospital patient satisfaction with healthcare providers
and systems: A systematic review. BMJ Quality&
Safety, 26(7), 596–606.
Febrianta , Nanda Surya, Sri Sundari , Dwi Pudjaningsih,
2017, Analisis Waktu Tunggu Pelayanan Farmasi
Rawat Jalan Dengan Metode Antrian di RS PKU
Muhammadiyah Bantul, International Journal Of
Scientific And Research Publications, Volume 7, Issue
9
Fitriah,N.,Ika, Nandytia.,Wiyanto, Sastra , 2016. Penyebab
dan Solusi Lama Waktu Tunggu Pelayanan Obat di
Instalasi Farmasi Rawat Jalan Rumah Sakit. Jurnal
Kedokteran Brawijaya Vol. 9, Supplemen No. 3, pp
245-251.
George, S., Kamath, R., D’Souza, B. C., & Kamath, S.,
2017. Factors influencing patients in hospital selection
and satisfaction with inpatient services. Pakistan
Journal of Medical and Health Sciences, 11(4), 1653–
1656.
Himawan, Vanji Budi, et all., 2018. System Effectivity of
Pharmacy Services Queue Time in Outpatient
Pharmacy Depot RSD Dr. Soebandi Jember. Health
Notions, 2 (5) : ISSN 2580-4936.
Johann Daniels, et all., 2018. Assesing the impact of a
waiting time survey on reducing waiting times in
urban primary care clinics in Cape Town, South
Africa, Journal of Public Health in Africa , 8(639).
Ishijima H, Eliakimu E, Mshana JM. 2016. The “5S”
approach to improve a working environment can
reduce waiting time: Findings from hospitals in
Northern Tanzania. TQM J. ;28(4):664-680.
Kalubowila, K. C., Perera, D., Senathilaka, I.,
Alahapperuma, C., Withana, R. D., & Kapparage, P.
D., 2017. Patient satisfaction of services of the
outpatient department, Base Hospital, Panadura.
Journal of the College of Community Physicians of Sri
Lanka, 23(2), 63–70.
Kementrian Kesehatan Republik Indonesia, 2008.
Keputusan Menteri Kesehatan No.
129/MENKES/SK/II/2008 tentang Standar Pelayanan
Minimal Rumah Sakit. Jakarta. Kementerian
Kesehatan.
Lau, BT, Nurul-Nadiah-Auni AR, Ng SY, Wong SN.
2018. Satisfaction of patients receiving value added-
services compared to traditional counter service for
prescription refills in Malaysia. Pharmacy
Practice;16(1):1075.
Luis Margusino-Framiñán et al., 2017. Implementation of
Specialized Pharmaceutical Care Hospital Outpatient
Clinics in a Hospital Pharmacy Department. Farmacia
Hospitalaria .Vol. 41 l Nº 6 l 660 – 666.
Odili et al., 2017. Patients’ Satisfaction with Pharmacy
Services in a Secondary Health Care Facility In Benin
City, Nigerian Journal of Pharmaceutical and Applied
Science Research, 6(1):65-72.
Purwandari NK, Suryoputro A, Arso SP., 2017. Analysis
of Waiting Time for Outpatient Prescription Service at
Pharmacy Depot Islamic Hospital of Sultan Agung
Semarang (Analisis Waktu Tunggu Pelayanan Resep
Pasien Rawat Jalan Di Depo Farmasi Gedung Mceb
RS Islam Sultan Agung Semarang). Jurnal Kesehatan
Masyarakat (e-Journal); 5(1):103-110.
Ronen, B., Pliskin, J. S. and Pass, S., 2018. The Hospital
and Clinic Improvement Handbook: Using Lean and
the Theory of Constraints for Better Healthcare
Delivery. New York: Oxford University Press
Sengupta, Mitali, et all., 2019. Waiting Time: The
Expectations and Preferences of Patients in a
Paediatric OPD. Journal of Health Management, 21(3)
427–442.
Sun, Jing., et all., 2017. Reducing Waiting Time and
Raising Outpatient Satisfaction in a Chinese Public
Tertiary General Hospital- an Interrupted Time Series
Study. BMC Public Health; 17:668.
Suryana, Danyel , 2018. Efforts to Reduce Drug Waiting
Time for Outpatient Patients with Lean Hospital
Analysis in Outpatient Pharmacy Installation at Atma
Jaya Hospital. JurnalAdministrasi Rumah Sakit. 4(2)
Turnip, A., Andrian, Turnip, M., Dharma, A., Paninsari,
D., Nababan, T., Ginting, C.N., 2020. An application
of modified filter algorithm fetal electrocardiogram
signals with various subjects, International Journal of
Artificial Intelligence, vol. 18, no., 2020.
Wijaya, C., Andrian, M., Harahap, M., Turnip, A., 2019.
Abnormalities State Detection from P-Wave, QRS
Complex, and T-Wave in Noisy ECG, Journal of
Physics: Conference Series, Volume 1230, (2019)
012015. doi:10.1088/1742-6596/1230/1/012015.
Wu, Nai-Chun, et all. 2018 The Revolution of Hospital
Outpatient Pharmacy Fill Prescription Operation
Pracedure Reform. Management Review. Vo. 37, 147-
167
Xie, zhenzhe., Or, Calvin., 2017. Associations Between
Waiting Times, Service Times, and Patient
Satisfaction in an Endocrinology Outpatient
Departement : A Time Study and Questionnaire
Survey. The Journal of Healthcare Organization,
Provision, and Financing; 54: 1-10.
Identification of Influence Factors on Waiting Time of Prescription Services for Outpatient
29
