
Identification of Service Quality Factors and Patient Satisfaction
Level toward Specialist Doctor Treatment
Susanna Halim, Sri Lestari Ramadhani Nasution, Crismis Novalinda Ginting, and Ermi Girsang*
Faculty of Medical, Universitas Prima Indonesia, Indonesia
Keywords: Quality of service, Patient satisfaction, Tangibles, Responsiveness, Empathy, Control, Confirmation.
Abstract: One of the patient dissatisfaction problems in medical services is an ineffective communication between
patients and doctors which impacts on subsequent visits. To increase the patient satisfaction level, the quality
factors of a specialist doctors treatment are identified. This study used the cross sectional method with
quantitative analytic to the questionnaire of primary respondents. Respondent population are 191 outpatients
in specialist polyclinic unit with 66 samples. Sampling was done by non-random (non-probability) sampling
with purposive sampling. Logistic regression was used to analyze the respondent's data. The results of the
bivariate analysis showed good and satisfied results namely tangibles about 96.2%, responsiveness about
94.6%, empathy about 94.4%, control about 94.7%, trust about 81.2%, self-disclosure about 80.6%, and
confirmation about 96.4%. While the results of multivariate analysis showed that there were only 5 variables
that significantly affected patient satisfaction (p<0.05), namely the tangibles variable (OR=2.455),
responsiveness (OR=4.573), empathy (OR=4.841), control (OR=3.970), and confirmation (OR=3.656). The
highest result for bivariate was shown in the confirmation about 96.4% and for multivariate was on emphaty
with OR value 4.841.
1 INTRODUCTION
The basic nature of a hospital is the fulfillment of the
patients needs and demands in their health problems
solving. Patients always expect an excellent treatment
that is responsive, comfortable, ready and fast toward
patient illness complaints (Hatibie, 2015). Patients
have the right to choose a hospital based on the
quality of health services so that patients can satisfy
their needs as patients (Depkes R.I., 2013). If the
patient is dissatisfied (such as waiting too long, not
friendly, less skilled, less reliable), will make the
patient disappointed, such as research on outpatients
in several hospitals (Rensiner, 2018; Ariffin, 2017
and David, 2014). According to Aziati and Liddy,
almost all patients (94%) believe that waiting time
negatively affects daily life (Aziati, 2018; and Liddy,
2017; Hassan, 2015). Based on satisfaction factors,
patients can also create public perceptions about the
image of a hospital (Depkes R.I., 2014). The average
patient waiting time was 70.18 minutes and was
considered to be a long waiting time category (> 60
minutes) was shown by Laeliyah N., et al’ research in
the outpatient installation of Indramayu District
Hospital. The patient satisfaction level including
dimensions of tangibles, empathy, assurance, and
responsiveness are considered quite satisfied
categories, while the reliability dimension is
considered to be satisfied, based on the five
dimensions of service quality. So the waiting time for
outpatient services has a relationship with patient
satisfaction that is p about 0.042 or chi-square
correlation value about 4.135 (Laeliyah, 2017).
The success of a hospital is not only seen in the
completeness of the facilities that are superior, the
attitude and services of human resources are also
elements that have a significant effect on the services
produced and perceived by patients. Patients will turn
to other hospitals that meet their expectations, this is
because patients are a very valuable asset in
developing the hospital industry (Vonikartika, 2018;
Turnip et al, 2020; Wijaya et al, 2019). One of the
human resources who provide health services in a
hospital is a specialist doctor. However, medical
service arrangements, especially specialist doctors,
still have various obstacles, namely that specialist
staff are lacking and have not been evenly distributed
in various regions in Indonesia. An imbalance of
medical personnel, facilities and infrastructure,
various regulations that have not been implemented
Halim, S., Ginting, C. and Girsang, E.
Identification of Service Quality Factors and Patient Satisfaction Level toward Specialist Doctor Treatment.
DOI: 10.5220/0010282900050016
In Proceedings of the International Conference on Health Informatics, Medical, Biological Engineering, and Pharmaceutical (HIMBEP 2020), pages 5-16
ISBN: 978-989-758-500-5
Copyright
c
2021 by SCITEPRESS – Science and Technology Publications, Lda. All rights reserved
5

properly, and the behavior of doctors as medical
personnel cause problems such as lack of
communication between doctors and patients which
ultimately greatly affects the quality of hospital
medical services (Azwar B, 2005). Patients usually
always compare or ask others recommendations to
choose a doctor for treatment (therapy). Aspects
related to service quality include responsiveness,
reliability (Supartiningsih, 2017; Pathak, 2017;
Aliman, 2016; Hanggraningrum, 2017), empathy and
assurance (Tacoh, 2013), and the appearance of the
hospital (tangibles) (Parasuraman, 1994; Suaib et al.,
2011).
Patient satisfaction will be fulfilled if the doctor's
professional behavior in providing health services is
as expected by the patient or family. Stages of
specialist doctors providing health services include
history, physical examination, therapy, and
termination (E. Gusti, 2016). Specialists in providing
health services that are friendly, comfortable, caring
and able to accommodate the needs of patients are
demands that must be met by the hospital. Even
though in reality, the implementation of health
services is still oriented towards the interests of
providers rather than the interests of patients and the
community (Murtiana, 2016). Outpatient medical
facilities as one of the busiest in Malaysia found that
the highest patient satisfaction is in the service factor
or tangibles priority, especially technical quality,
accessibility, and comfort but satisfaction in terms of
service orientation by doctors is low, especially
communication during consultations, time spent with
doctors, and interpersonal behaviour (Ganasegeran,
2015; Baequny, 2009; Kaban, 2014).
According to the research of Lucas et al, about 70
to 80% of medical errors are strongly related to
human error (Lucas, 2017). Hamdan’s research on
service quality factors covering 4 dimensions, namely
infrastructure, procedures, interactions, and personal,
found that patient satisfaction greatly affects patient
loyalty (Hamdan, 2019). Some studies have argued
that patient satisfaction is needed to guide patient
loyalty (Singh, 2018, Meesala, 2018 and Yacob,
2016). Basic training on communication skills in
sustainably and patient activation programs must be
established to increase patient satisfaction (Azizam,
2015). Agustin N et al have tested the effect of service
quality with word-based communication in pleasing
patients, the results show that better quality will make
patients more satisfied. Satisfied patients will be
motivated to speak and this will increase the number
of patients (Agustin, 2018).
Research by Kashkoli SA et al on eight
dimensions of responsiveness (i.e, dignity,
communication, confidentiality, autonomy,
immediate attention, social support, quality of basic
facilities, and provider choice) and found that the
responsiveness of the hospital has a strong influence
on overall patient satisfaction. Health care facilities
should consider incorporating responsiveness efforts
into their strategic plans. It is recommended that
patients should be involved in their treatment process
and have the right to choose their doctor (Kashkoli,
2017). Research by Chandra S et al. about some factor
related to patient satisfaction with 410 outpatients, the
relationship between interpersonal skills, and
physician communication attitudes, patient trust and
patient satisfaction were found, but found no
relationship with waiting time. However, patients
state that to get a satisfactory consultation, it is worth
to be wait (Chandra, 2019; Mayasari, 2015). Other
studies have shown that patients who have a longer
waiting experience tended to perceive their health
services as less accessible and patients less able to
accept. In addition, spending more time receiving
care services does not always correlate with more
positive service perceptions. Although the waiting
problem is difficult to solve by actually reducing
waiting time, it could be possible to better manage it
such as how patients feel about the length of time they
have to wait and the amount of time they spend
receiving the service. Doctors and nurses can also be
encouraged to give empathy and respect to patients,
provide personal space for patients to talk with
doctors when needed, and treat patients family
members or friends in friendly ways (Xie, 2017).
In previous studies, the majority found discussion
related to patient satisfaction with service quality in
terms of waiting time, length of treatment, and
communication with doctors that included tangible,
responsiveness, reliability, assurance, and empathy.
In this study, the author examined the quality of
specialist doctor’s services and the relatioship
between patent satisfactions with doctors’ services in
the dimensions of tangible, responsiveness, empathy,
control, trust, self-disclosure, and confirmation were
evaluated with a case study by a specialist.
2 METHOD
Based on the Helsinki declaration, the research
protocol No. 004 / KEPK / UNPRI / 2019 has been
approved by the Health Research Ethics Commission
(KEPK), Universitas Prima Medan with KEPKKN
Registration Number: 1271012S Registered /
Accredited. The research was conducted with
quantitative analytics. Analytical research aims to
HIMBEP 2020 - International Conference on Health Informatics, Medical, Biological Engineering, and Pharmaceutical
6

evaluate the factors that influence the quality of
treatments (services) and the patient satisfaction level
with the services of obgyn and pediatrician specialist
with case studies of outpatient in Royal Prima
General Hospital unit at 2019 (Figure 1). The author
choosed pediatrician and obstetrician because the
questionnaire was first tested for validity and
reliability in the pediatrician and obstetrician
Polyclinic Installation at Stella Maris Hospital, in
order to get the same type of categories for the
samples. The research design with cross sectional
method was supported by data directly through filling
the questionnaire. The respondent populations used
were 191 patients with sample of 66 patients.
Sampling was done by non-random (non-probability)
sampling, which sampling is not based on predicted
probability, but is solely based on mere practicality.
With a purposive sampling technique, the researcher
takes a sample based on a particular consideration
made by the researcher herself based on the
characteristics or traits of the population that have
been known beforehand without making comparisons
(Notoatmodjo, 2018).
The sample in this study is determined based on
the formula of determination sample for survey
research. The large sample was calculated using the
Slovin formula, as follows:
2
dN 1
N
n
(1)
Description: n = the number of samples; N = the number of
population; d = Precision 10 %.
Based on the calculation results that the number
of samples was 66 patients.
The inclusion patients criteria for selected sample
were handled by Obstetrics and Gynecology
specialists and Pediatricians, able to communicate
well (can read and write), willing to be respondents,
if they have a physically weak condition or children,
then those who fill out the questionnaire were their
families. While the exclusion patient criteria were
general practitioners, did not answer the
questionnaire in full (unable to read and write), were
not willing to be respondents, and patients who were
medical personnel. The data collection instrument
used was a questionnaire (observation form). In order
to be directed observation and to obtain the really
needed data, it is also necessary to conduct an
observation by using the list of questions like sheets
or checklists that provided in advance. The
requirements for the questionnaire are relevant to the
objectives and research hypotheses, easy to ask, easy
to answer, avoid interviewer bias, generate
standardized data and the data obtained is easily
processed.
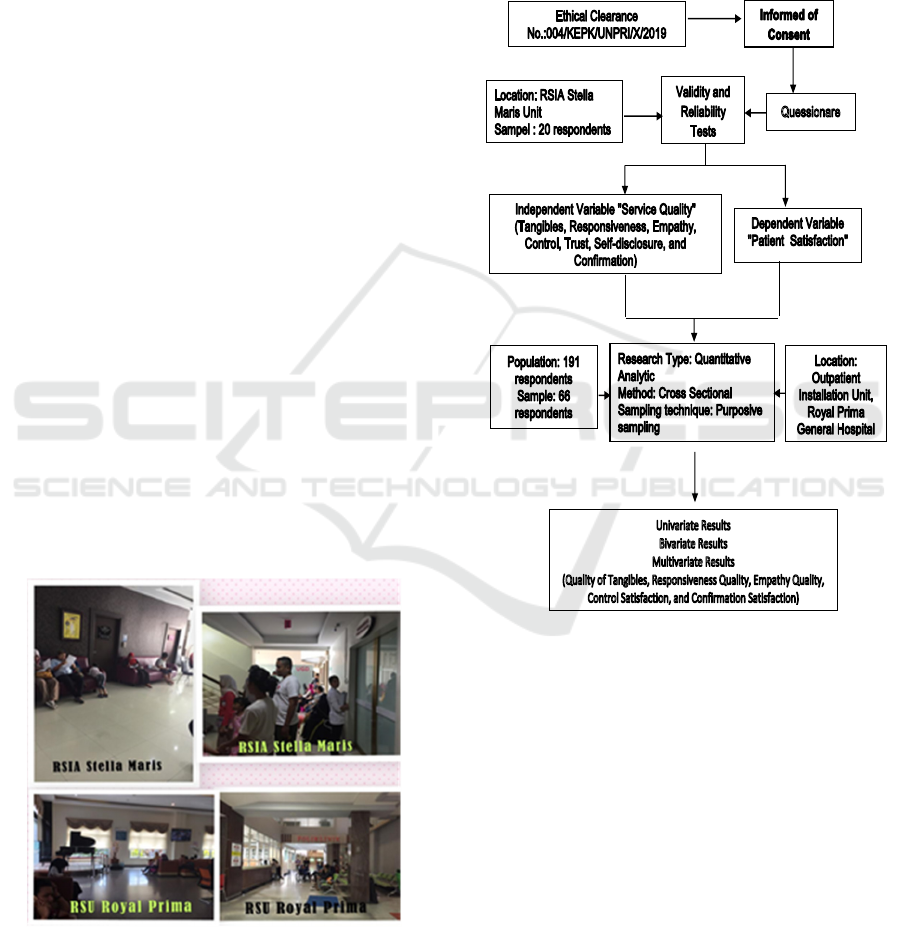
As shown in Figure 2, primary data in this study
include the identity of respondents and the services of
specialist doctors consisting of direct evidence
(tangibles), responsiveness, empathy and patient
satisfaction (ie, in terms of empathy, control (guided),
trust, self-disclosure, and confirmation) obtained
through a questionnaire that has been prepared in
advance. A questionnaire was first tested for validity
and reliability to determine the extent to which the
questionnaire could be used as a measurement tool
that represents the cause and variable variables due to
the research. The questionnaire test was conducted on
20 outpatients in the pediatrician and obstetrician
Polyclinic Installation at Stella Maris Hospital.
Validity is an indzex to show a measuring
instrument capability of measuring well
(Notoatmodjo, 2018; Pohan, 2015). Validity test is
done by using the correlation technique with Pearson
Product Moment Correlation Coefficient (r),
determining the correlation between the questions
with the total construct score or variable. A construct
is declared valid if there is a positive and significant
correlation. The correlation value must be greater
than 0.03 or the value of the Corrected Indicator Total
Correlation in the SPSS output is greater than 0.30
(Ghozali, 2016). Reliability is an index that shows the
confidence level in a measuring instrument or the
level of reliability (Notoatmodjo, 2018; Pohan,
2015). To determine the reliability of a variable, a
statistical test was performed using the Cronbach's
Alpha coefficient with the reliability requirement in
the form of a Cronbach's Alpha value > 0.6.19
(Kaban, 2014). Reliability calculations are performed
only on questions that already have a validity test
(Notoatmodjo, 2018).
The questionnaire that had been tested for validity
and reliability was then filled in by 66 samples at the
Royal Prima Hospital. The process of processing data
by computer is carried out through the following
stages: editing, coding, data entry or processing, and
data cleaning (filtering) to find out the missing data,
data variation, and data consistency. The statistical
processing and analysis of data obtained was done by
computerization using Statistical Package for Social
Sciences (SPSS) tools. Initially the data was tested for
normality to determine the test performed.
Univariate analysis aims to explain or describe the
characteristics of each research variable
(Notoadmodjo, 2018), to get a description of the
frequency distribution of sociodemographic
characteristics, like sex, ages, educations,
occupations, and payment model.
Identification of Service Quality Factors and Patient Satisfaction Level toward Specialist Doctor Treatment
7
Bivariate analysis used quadratic kai test intended
to find out wheather there is or not a relationship
between the two variables namely the dependent
variable and the independent variable, reluctantly
using the chi square test with the significance level
(a=0.05), with the following criteria: Ho is rejected if
p<a (0.05) then there is a relationship between the
independent variable and the dependent variabel , Ho
is accepted if p>a (0.05) then there is no relationship
between the independent variable and dependent
variable (Sugiyono,2017). Quadratic test can be done
if the test requirements are met, i.e no more than 20%
of cells that have an expectation value of less than 5
withdrawal conclusions are carried out based on the p
value of Pearson Chi-Square (Trihendradi, 2013). If
the quadratic test requirements are not met, the
Fisher’s absolute test is used (Hastono&Sabri, 2010).
Conclusions drawn on the Fisher’s absolute test are
based on the p value of the Fisher’s Exact Test
contained in the exact Sig column (2-sided) (Dahlan,
2011). If p<a value is obtained, either from the square
test or Fisher’s absolute test, then it is said that there
is a significant relationship between the two variables
tested. (Dahlan, 2011).
Multivariate analysis was performed to see
whether there was an influence between the
independent variables together with the dependent
variable using logistic regression tests of significance
(a)=0.05,with the criteria: Ho was rejected if p<a
(0.05) then there is an influence between the
independent variables with the dependent variables.
Ho was accepted if p>a (0.05) then there is no
influence between the independent variables with the
dependent variables.
Figure 1: Respondents and data collection at the hospital.
Logistic regression is an approach to making
predictive models or commonly referred to as
Ordinary Least Squares (OLS) regression.
Researchers predict the dependent variable on a
dichotomy scale. The dichotomy scale in question is
a nominal data scale with two categories, for
example: Yes or No, Good or Bad, or High and Low
(Ghozali, 2016).
Figure 2: Scheme of Research Process.
3 RESULTS AND DISCUSSIONS
3.1 Validation and Reliability
The results of the validity test against tangibles and
responsiveness as in Table 1 shows that of the 10
questions that were tested for validity, 9 questions
were declared valid as seen from the value of r-count
(rc) > r-table (rt) (> 0.333) and there was 1 question
declared invalid (Cannot be used as a question in the
study because the calculated value < rtable (<0.333).
While the empathy validity test results show that 10
questions were declared valid since the value of rc >
rt.
Collecting Data
Processing Data
HIMBEP 2020 - International Conference on Health Informatics, Medical, Biological Engineering, and Pharmaceutical
8

Table 1: Test Results of Validity of Tangibles,
Responsiveness, and Empathy (rt = 0.333).
No
Tangibles Responsiveness Empathy
rc v rc v rc v
1 0.446 + 0.223 ‐ 0.865 +
2 0.566 + 0.517 + 0.665 +
3 0.855 + 0.575 + 0.750 +
4 0.381 + 0.727 + 0.797 +
5 0.701 + 0.875 + 0.738 +
6 0.786 + 0.785 + 0.787 +
7 0.297 ‐ 0.713 + 0.846 +
8 0.846 + 0.761 + 0.819 +
9 0.604 + 0.704 + 0.685 +
10 0.622 + 0.687 + 0.822 +
The results of the validity test as in Table 2 show
that from the 5 questions carried out it was found that
the five questions were declared valid on the control
variable, trust, self-disclosure and confirmation due
to rc > rt (> 0.333).
Table 2: Results of Full Validity, Trust, Self-disclosure, and
Confirmation Tests (rt = 0.444).
No
Control Trust
Self-
Confirmation
disclosure
rc v rc v rc v rc v
1 0.773 + 0.783 + 0.953 + 0.727 +
2 0.810 + 0.823 + 0.953 + 0.806 +
3 0.795 + 0.790 + 0.915 + 0.737 +
4 0.602 + 0.697 + 0.834 + 0.747 +
5 0.795 + 0.912 + 0.597 + 0.768 +
Based on Table 3 the reliability test results on
valid questions show that tangibles, responsiveness,
empathy, control, trust, self-disclosure and
confirmation are reliable because the Cronbach's
Alpha value > 0.6.
Table 3: Test Results of Tangibles, Reliability,
Responsiveness, Empathy, Control, Self-disclosure, and
Confirmation.
Variable Cronbach‘s
Alpha
N of
Items
Tangibles 0.753 11
Responsiveness 0.757 11
Empathy 0.778 11
Control 0.796 6
Satisfaction 0.810 6
Self-Openness 0.818 6
Confirmation 0.795 6
3.2 Measured Data using
Questionnaire
The questionnaire weight value from 66 samples are
shown in Table 4. The measured data are categorized
into two groups based on who is ordinal ie satisfied
or dissatisfied as in Table 4. . S is Sample, Ta is
Tangibles, R is Responsiveness, Em is Emphaty, Co
is Control, Tr is Trust, SD is Self Disclosure, and Cf
is Confirmation.
Test of ordinal scale from 10 questions service
quality of specialist doctor (tangibles, responsiveness
and emphaty), that is, the group called not good if the
the questionnaire weight value are between 9-27,
while the group called good if the value are between
28-50. Whereas for outpatient satisfaction variable
which has 5 questions namely control, trust, self
disclosure, and confirmation, it is also divided into
two ordinal scales, namely the group called not
satisfied if the questionnaire weight value is between
5-15, and the group called satisfied if the
questionnaire weight value is between 16-25.
Identification of Service Quality Factors and Patient Satisfaction Level toward Specialist Doctor Treatment
9

Table 4. The recorded data (questionnaire weight value)
from 66 respondents using questionnaire.
Description: S is Sample, Ta is Tangibles, R is
Responsiveness, Em is Emphaty, Co is Control, Tr is
Trust, SD is Self Disclosure, and Cf is Confirmation.
3.3 Univariate Analysis
Table 5 shows the univariate analysis about the
characteristics distribution of involved respondents in
the research. It was found that of the 66 observed
respondents, majority of respondents were female
about 78.8%. Respondents aged between 19-30 years
and 31-42 years were 39.4%. Respondents with high
school education were 40.9%, unemployed about
6.4%, treatment payments using the BPJS model were
72.7%.
Table 1: Test Results of Validity of Tangibles,
Responsiveness, and Empathy (rt = 0.333).
Variable n=66 %
Sex
Female
Male
52
14
78.8
21.2
Ages ( years )
19-30
31-42
43-54
55-70
26
26
8
8
39.4
39.4
12.1
9.1
Educations
No Education
Elementary
school
Middle School
High School
Diploma
Bachelo
r
2
1
2
27
10
24
3.0
1.5
3.0
40.9
15.2
36.4
Occupation
Unemployee
Employee
entrepreneur
Others
24
13
12
17
36.4
19.7
18.2
25.8
Payment Model
General
BPJS
Insurance
Compan
y
12
48
3
3
18.2
72.7
4.5
4.5
3.4 Bivariate Analysis
The Chi Square test with a significance level (α) =
0.05 was used to test the relationship between patient
satisfaction level and the quality with the services of
specialist doctors (Sugiyono, 2017). The purpose of
the bivariate analysis is to obtain a relationship
between the independent variables (service quality
which includes: tangibles, responsiveness, empathy
and control satisfaction, satisfaction of trust,
satisfaction of self-disclosure, and satisfaction of
confirmation) with the dependent variable (patient
satisfaction level). Table 6 is a cross tabulation
between all observed variables (i.e., Tangibles
qualilty, responsiveness, empathy, control, trust, self-
disclosure, and confirmation) towards patient
satisfaction level.
STaREmCoTrSDCfSTaREmCoTrSDCf
1363640202020203436364019202018
2383941202119173545454025252525
3393843212122203645454425252525
4383640202020203736415022222520
5363640202020203836365021202020
6363640202020203936364420202020
7374545202522214039404723222221
8444550202020204145454024202322
9363640202022244245454325252525
10 38 36 40 20 20 20 20 43 40 40 40 22 24 23 21
11 36 36 40 20 20 20 20 44 34 45 50 25 20 25 22
12 36 37 40 20 20 20 20 45 36 36 40 20 20 20 20
13 36 38 47 20 20 22 21 46 38 43 43 23 21 22 22
14 45 45 50 25 25 25 25 47 37 36 40 20 20 20 15
15 44 45 50 25 25 25 25 48 45 45 50 25 20 20 20
16 39 37 40 24 25 25 25 49 36 36 40 20 20 20 20
17 39 38 45 20 25 23 22 50 39 40 45 22 22 22 23
18 40 40 45 23 30 22 21 51 41 41 42 20 20 20 20
19 36 40 41 20 21 20 21 52 36 36 40 20 20 20 20
20 31 37 39 16 17 21 18 53 42 38 40 20 24 21 19
21 36 40 22 20 20 20 20 54 38 43 40 20 20 20 20
22 38 41 40 20 20 20 20 55 36 36 40 20 20 20 20
23 36 44 45 23 22 22 23 56 36 36 40 20 20 20 18
24 36 36 40 20 20 20 21 57 34 36 38 20 20 20 20
25 31 36 50 20 20 20 20 58 37 45 47 23 24 23 25
26 36 35 49 20 20 20 17 59 36 36 40 20 20 20 20
27 39 36 50 20 20 20 20 60 34 36 40 20 20 20 20
28 36 43 50 25 25 21 20 61 43 45 50 25 25 25 25
29 36 45 42 25 25 25 25 62 36 38 40 23 23 20 19
30 38 45 41 25 25 24 21 63 36 43 44 24 24 23 21
31 38 45 50 25 25 25 25 64 36 36 40 20 20 20 20
32 45 45 50 25 25 25 25 65 45 45 50 25 25 25 25
33 39 45 44 20 25 21 24 66 45 43 50 23 24 23 24
Subjet34‐66Subject1‐33
HIMBEP 2020 - International Conference on Health Informatics, Medical, Biological Engineering, and Pharmaceutical
10

3.4.1 Tangibles Factors
From the 66 observed respondents, there were 52
respondents who rated the quality of tangibles as
good with 96.2% of whom were satisfied, while the
remaining 3.8% felt not satisfied with the service.
Furthermore, there were 14 people who rated the
quality of tangibles as not good with 71.4% of them
feel dissatisfied and the remaining 28.8% feel
satisfied with the service. In the results of analysis
with chi square obtained the p value of 0.001 (p < α),
it can be concluded that the variable quality of
tangibles had a significant relationship with patient
satisfaction towards the services of specialist doctors.
The data that obtained from questionnaire showed the
dimension of direct evidence (tangibles) is considered
good and the patient feels satisfied with the doctor
including appearance, friendliness, choice of
language (easy to understand or not), special
attention, touch, cleanliness, neatness and uniform
use, politeness, friendliness, and desire to help are
embodiment of the quality of service from doctors
that can be directly felt by patients. Whereas the
variable quality of tangibles that considered not good
but the patient was satisfied with the doctor's service
was about 28.8%, this is because the Hospital used in
this study had 2 different buildings in the same place
namely Building A and Building B . Building A is an
outpatient polyclinic located on the 2nd floor, while
Building B is on the 1st floor. Directions to the
outpatient installation polyclinic for both buildings
are oftenly illegible or rarely read by patients, so
patients or their families are oftenly confused looking
for the location of the separated polyclinic in the
building.
3.4.2 Responsiveness Factors
In the responsiveness quality, there were 56
respondents who rated the responsiveness well where
94.6% of them were satisfied, while the remaining
5.4% felt dissatisfied with the service. Furthermore,
there were 10 people who rated the responsiveness as
not good, where 90.0% of them felt dissatisfied with
the service, while the remaining 10.0% were satisfied
with the service. In the results of the analysis with chi
square obtained p value of 0.001 (p < α), it can be
concluded that the variable quality of responsiveness
had a significant relationship with patient satisfaction
towards the doctor's service. The questionnaire
results showed that the influence between the
dimensions of responsiveness (doctor's
responsiveness) is considered good with a good level
of satisfaction if able to examine patients
immediately, quickly provide treatment or action,
able to listen to and respond to every patient's
complaint, answer every question about a patient's
illness, take action accordingly procedures, provide
opportunities to ask patients, quickly serve when
patients need immediate help, able to respond quickly
to resolve patient complaints, provide clear and easy
to understand information, and always ask for patient
complaints (Muninjaya, 2011). The responsiveness
quality variable is not good but the level of patient
satisfaction is as much as 10%, this is due to the long
waiting time of the patient. Obstetricians often
perform cesarean section or delivery assistance in
childbirth patients which coincides with the clinic
schedule.
3.4.3 Emphaty Factors
In the empathy quality, there were 54 respondents
who rated the quality of empathy as good with 51
people (94.4%) of them were satisfied, while the
remaining 5.6% were less satisfied with the service.
Furthermore, there were 12 people who rated the
quality of empathy as not good with 75.0% of them
feel dissatisfied and only 25.0% who were satisfied
with the service. The results of analysis with chi
square obtained p value of 0.001 (p < α), which means
that the quality of empathy variables is significantly
related to the services of a specialist. The
questionnaire results showed that the influence of
empathy variables on specialist medical services on
the patient satisfaction level is caused by patients feel
care which includes explanation of the treatment to be
carried out, an explanation of the drugs to be taken,
an efforts to calm the patient's anxiety about his
illness, concern for each patient's complaint, giving
adequate service time, doctor's introduction to new
patients, providing guidance / consultation about the
disease and its prevention to patients, well
communication with patients, listening to patient
complaints with attention with a sense of willing to
help. This shows that there are patients who have
expressed good care for doctors and there are also
patients who have not expressed good care for a
doctor treatment. This can be seen in the empathy
quality variable is not good but the level of patient
satisfaction is as much as 25% satisfied.
3.4.4 Control Factors
In the Control quality, there were 57 respondents who
were satisfied with the guidance, of which 94.7%
were also satisfied with the service and only 5.3%
were less satisfied with the service. Furthermore,
there were 9 people (100 %) who rated dissatisfied
with the quality of control with overall feel
Identification of Service Quality Factors and Patient Satisfaction Level toward Specialist Doctor Treatment
11

dissatisfied with service. The results of the analysis
with chi square obtained p value of 0.001 (p < α),
which means that control satisfaction variables are
significantly related to the services of specialist
doctors. The questionnaire results showed that the
influence of the guided variable on the patient
satisfaction level occurs because the patient feels
satisfied with the ability to handle patient complaints
in appropriately, the ability to provide an explanation
of their illness, friendly and polite doctor's attitude,
the speed in taking action, readiness to serve at any
time.
3.4.5 Trust Factors
In the guided quality, there were 64 respondents who
were satisfied with trust where 52, 81.2% of them
were satisfied and 18.8% were not satisfied with the
quality of service. Furthermore there are 2
respondents who are satisfied with the sense of trust
with all of them feel dissatisfied with the quality of
service. In the results of analysis with chi square
obtained p value of 1,000 (p > α), which means that
trust has an unsignificant relationship with patient
satisfaction.
3.4.6 Self-disclosure Factors
In the self-disclosure quality, there were 62
respondents who were satisfied with self-disclosure
where 80.6% of them were satisfied and 19.4% were
dissatisfied with the service. Found 4 respondents
who were dissatisfied with self-disclosure who also
felt dissatisfied with the service. In the results of the
analysis with chi square obtained p value of 1.090 (p
> α), by mean the self-disclosure satisfaction variable
had an unsignificant relationship to the satisfaction of
specialist medical services.
3.4.7 Confirmation factors
In the confirmation quality, there were 56
respondents who were satisfied with the
confirmation, of which 96.4% were also satisfied and
3.6% were dissatisfied with the service. Furthermore,
there were 10 respondents who were dissatisfied with
confirmation who also felt dissatisfied with the
service. In the results of analysis with chi square
obtained p value of 0.001 (p < α), which means that
the satisfaction confirmation variable had a
significant relationship with the services. The
questionnaire results showed that satisfaction
confirmation is caused by the patient feel satisfied
with the speed at which the doctor arrives in the room,
satisfied with the delivery and request of patient's
approval for all given medical actions, honesty in
providing information about the patient's condition,
timeliness as promised to the patient, convenience to
be found and contacted when patients need it.
Table 6: Bivariate Analysis.
Patient Satisfaction
Level
p-
value
Satisfy Not
Satisfy
n
% n %
Tangibles
Good 50 96.2 2 3.8 0.001
Not good 4 28.6 10 71.4
Responsiveness
Good 53 94.6 3 5.4 0.001
Not good 1 10 9 90
Emphaty
Good 51 94.4 3 5.6 0.001
Not good 3 25 9 75
Control
Good 54 94.7 3 5.3 0.001
Not good 0 0 9 100
Trust
Good 52 81.2 12 18.8 1
Not good 2 100 0 0
Self-disclosure
Good 50 80.6 12 19.4 1.09
Not good 4 100 0 0
Confirmation
Good 54 96.4 2 3.6 0.001
Not good 0 0 10 100
3.5 Multivariate Analysis
In multivariate analysis, what is involved is a variable
that has a bivariate value of p < 0.05. From the
bivariate test results, it is obtained that only the
variable quality of tangibles, responsiveness,
empathy, control satisfaction and confirmation can be
performed multivariate analysis. The variables that
have p values < 0.05 are considered influential in this
multivariate model. Table 7 shows the final model of
the influence of the variable quality of tangibles,
responsiveness, empathy, control satisfaction and
confirmation on the satisfaction of specialist doctors.
In Table 7, B is unstandardized beta, this value
represents the slope of the line between the predictor
variable and the dependent variable
(BrownMath.com). SE is Standard Error (estimated
parameter) of the standard deviation of its sampling
distribution (Everitt, 2003). Wald is constraints on
HIMBEP 2020 - International Conference on Health Informatics, Medical, Biological Engineering, and Pharmaceutical
12

statistical parameters based on the weighted distance
between the unrestricted estimate and its
hypothesized value under the null hypothesis, where
the weight is the precision of the estimate (Fahrmeir,
2013; Ward, 2018). DF is degrees of freedom or the
number of values in the final calculation of a statistic
that are free to vary (Animated Software, 2008).The
p-value is the probability of obtaining results as
extreme as the observed results of a statistical
hypothesis test, assuming that the null hypothesis is
correct (Beers B, 2020). OR is Odd Ratio, the
measure of the relationship between exposure and an
outcome (Szumilas, 2010). The results show that all
variables have p-value < 0.05, so all independent
variables significantly influence the dependent
variable.
3.5.1 Quality of Tangibles
Based on the results of multivariate analysis with
logistic regression obtained variable quality of
tangibles significantly influence the services of
specialist doctors with p < 0.05. Tangibles is the
manifestation of services from doctors that can be felt
directly by patients. The tangibles service includes a
good appearance, friendliness to the patient, use of
language that is easily understood, special attention to
the patient, always checking the patient's condition,
cleanliness, neatness, and uniform harmony in
carrying out the task, providing polite service, always
giving a smile to the patient , friendly, greet politely
and want to help.
In the quality of tangibles, in providing services a
specialist doctor must be polite, patient, friendly, not
hesitant, attentive to sufferers, always provide help
given, fostering good relations with nurses who
handle patients, establishing good relations with
patients and their families in order to arise the
patient's trust in the doctor (Azwar A, 2010).
3.5.2 Quality of Responsiveness
Based on the results of multivariate analysis with
logistic regression obtained responsiveness quality
variables significantly influence the service of
specialist doctors with p < 0.05. The dimension of
responsiveness is the ability of doctors to help
patients and their readiness to serve patients in
providing services. Responsiveness services
measured in this study include the speed of
responding to the wishes of patients, giving responses
and good answers to patients, delivering clear
information. Based on the results of the analysis of
the effect between the quality of responsiveness of
specialist doctor services with the level of patient
satisfaction shows that there is an influence between
the dimensions of doctor service responsiveness with
the level of satisfaction. This means that the patient
has a good perception that is if the specialist doctor is
able to examine the patient immediately, be quick to
provide treatment or action, be responsive to every
patient's complaint, answer every question about the
patient's disease clearly, take action according to the
procedure, give the opportunity to ask the patient,
speed services when patients need help, the ability to
quickly respond to patient complaints, provide clear
and easy to understand information, and always ask
for patient complaints, then considered to have
quality service (Muninjaya, 2011).
3.5.3 Quality of Emphaty
Based on the results of multivariate analysis with
logistic regression obtained emphaty quality
variables significantly influence the service of
specialist doctors with p < 0.05. The results obtained
are supported by the results of a study conducted by
Tacoh (2013) about the relationship between doctor
services and the level of patient satisfaction using the
dimensions of service quality and other explanations
so that the results obtained that respondents who care
for good doctor's care by 87.5%. For health official
services, the quality of health services is more related
to the dimensions of staff care to meet patient needs,
good communication, concerns and hospitality in
serving, and / or healing patients' illnesses.
In the quality of empathy, the technical
competence of specialist doctors or other health
professions related to patients includes attention,
care, and the effects of health service outcomes.
Patients see quality health services as a health service
that can meet perceived needs and be organized in a
manner that is polite, timely, responsive and able to
cure complaints and prevent the development or
spread of disease (Azwar A, 2010).
3.5.4 Quality of Control
The results of multivariate analysis with logistic
regression of control satisfaction variables obtained a
significant relationship with the services of specialist
doctors with p <0.05. The doctor and patient
communicate is a health communication form of
interpersonal and complex. In evaluating
communication control patterns between doctors and
patients, they describe four basic forms of
relationships, namely: standard, paternalistic,
consumerist, and mutualistic. The standard
relationship is characterized by a lack of control on
Identification of Service Quality Factors and Patient Satisfaction Level toward Specialist Doctor Treatment
13

both sides (doctors and patients), and is far from ideal.
The paternalistic form is characterized by the
relationship of the dominant doctor while the patient
is passive, whereas consumerism is associated with
the opposite (focus on the rights and obligations of
the doctor to the patient). Finally, the form of
mutualistic relationships is characterized by sharing
in decision making, and often suggests the best type
of relationship to understand each other (Berry D,
2007). Creating a good interpersonal relationship is a
prerequisite for medical services.
3.5.5 Quality of Confirmations
Multivariate analysis using logistic regression
resulted that the satisfaction variable significantly
influenced the service of specialist doctors with p <
0.05. Confirmation is the display of individual
responses that indicate understanding and has been
given. Confirmation is a kind of feedback that makes
the process of interpersonal communication complete
with the feedback aspect that communication has
been understood and gives rise to an agreement in
agreement with messages. Conversely,
"confirmation" if the contents are not responded in
accordance with what is ordered is an antagonist to
the contents of the message. According to Northous
and Northouse, Confirmation is information that is
valued by sincere recognition of the quality of
communication that has been developed between
doctors and patients. Confirmation is a sincere
appreciation for the benefits of information that has
been given previously.
Table 7: Multivariate Final Model with Logistic Regression
Analysis.
Variables B S.E Wald Df
p-
value
OR
Quality of
Tangibles
1.510 0.961 5.106 1 0.001 2.455
Quality of
Respon
siveness
2.511 0.413 4.210 1 0.001 4.573
Quality of
Emphaty
2.744
0.620
6.230
1
0.031
4.841
Control
Satisfication
1.876
0.305
5.847
1
0.012
3.970
Confirmation
Satisfication
1.777
0.285
7.900
1
0.001
3.656
4 CONCLUSIONS
The examination results of each variable (i.e.,
Tangibles, responsiveness, empathy, control
satisfaction, and confirmation satisfaction) to the
regression coefficient (𝛽) or OR values are all
positive, which means that each variable has the
opportunity to increase patient satisfaction with the a
specialist doctor services about 2.455; 4.573; 4.841;
3.97; and 3.656 times higher when compared to the
variables quality that is not good.
The results of the bivariate analysis showed good
and satisfied results namely 96.2% for tangibles,
94.6% for responsiveness, 94.4% for empathy, 94.7%
for control, 81.2% for trust, 80.6% for self-disclosure,
and 96.4% for confirmation. While the results of
multivariate analysis showed that there were only 5
variables that significantly affected patient
satisfaction, namely the tangibles variable,
responsiveness, confirmation with p-value=0.001,
empathy (p-value=0.031), and control (p-value=
0.012).
REFERENCES
Agustin, N., Hernawati, S., Viphindrartin, S., 2018. Effects
of Service Quality on Word of Mouth through
Satisfaction in Outpatient at Sakinah Islamic Hospital
in Mojokerto Regency, Heal. Notions. 2(3): 311-315.
Aliman, N.K., Mohamad, W.N., 2016. Linking Service
Quality, Patients’ Satisfaction and Behavioral
Intentions: An investigation on Private Healthcare in
Malaysia, Elsevier Ltd. 224: 141-148.
Ariffin, F., Azraii, AB., Kamaruddin, KN., 2017. An
assessment of patient waiting and consultation time in
aprimary healthcare clinic. Malaysian Fam. Physician
HIMBEP 2020 - International Conference on Health Informatics, Medical, Biological Engineering, and Pharmaceutical
14

Off, J. Acad. Fam. Physicians Malaysia, Malaysia.
12(1): 14-21.
Aziati, A.H.N., Hamdan, N.S.B., 2018. Application of
queuing theory model and simulation to patient flow at
the outpatient department, International Conference on
Industrial Engineering and Operations Management,
3016-3028.
Azizam, NA., Shamsuddin, K., May-Jun., 2015. Healthcare
Provider – Patient Communicatio: A Statisfaction
Study in yhe Outpatient Clinic at Hospital Kuala
Lumpur, Malays J Med Sci. 22(3): 56-64.
Azwar A., 2010. Pengantar Administrasi Kesehatan
(Introduction to Health Administration), Binarupa
Aksara, Tangerang.
Azwar B., 2005. Menjadi Pasien Cerdas (Terhindar dari
Malpraktik) [Be a smart Patient (Avoid Malpractice)],
Kawan Pustaka. Jakarta.
Baequny A., 2009. Analisis Tingkat Kepuasan Peserta
Askes Sosial PT. Askes Terhadap Pelayanan Dokter
Keluarga di Kota Pekalongan Tahun 2009 (Analysis of
the Satisfaction Level of PT. Askes ‘s social Askes
Paticipants to the Service of Family Doctors in the city
of Pekalongan in 2009), University of Diponegoro,
Beers, B., P-Value Definition. https://investopedia.com.
Updated on 19th February, 2020.
Berry D., 2007. Health Communication: Theory and
Practice. McGraw-Hill Education, New York.
Chandra, S., Ward, P., Mohammadnezhad, M., July 2019.
Factors Associated with Patient Satisfaction in
Outpatient Department of Suva Sub-Divisional Health
Centre, Fiji, 2018: A Mixed Method Study, Frontiers in
Public Health. 7(183) : 1-10.
Dahlan., Sopiyudin., 2011. Statistik untuk Kedokteran dan
Kesehatan (Statistics for Medicine and Health),
Salemba Medika. Jakarta, 5
th
edition.
David., Hariyanti, T., Widayanti, E., 2014. Hubungan
Keterlambatan Kedatangan Dokter Terhadap Kepuasan
Pasien di Instalasi Rawat Jalan (Relationship of Late
Doctor’s Arrival to Patient Satisfaction in Outpatient
Installation), J. Kedokteran Brawijaya. 28 (1): 31-35.
Depkes R.I., 2013. Kualitas Pelayanan terhadap Pasien
Rawat Jalan (Quality of Care for Outpatients), diunduh
pada tanggal 16 Agustus 2019 dari
http://www.google.com
Depkes R.I., 2014. Konsep Rumah Sakit (Hospital
Concept), diunduh tanggal 16 Agustus 2019 dari
http://www.google.com
E, Gusti Sigar Maulana., Adhani, R., Heriyani, F., 2016.
Faktor yang mempengaruhi kehilangan gigi pada usia
35-44 tahun di kecamatan juai kabupaten balangan
(Factors Affecting Tooth Loss at the ages of 35-44
years in the District of Juai, Balangan Regency),
Dentino. 1: 98–103.
Everitt, B.S., 2003.The Cambridge Dictionary of Statistics.
CUP. ISBN978-0-521-81099-9.
Fahrmeir., Ludwig., Kneib., Thomas., Lang., Stefan.,
Marx., Brian., 2013. Regression, Models, Methods and
applications. Berlin: .Springer. 663. ISBN 978-3-642-
34332-2.
Ganasegeran, K., Perianayagam, W., Manaf, RA., Manaf,
RA., Jadoo, SAA., 2015. Al-Dubai, SAR. Patient
Satisfaction in Malaysia’s Busiest Outpatient Medical
Care, The Sciebtific World Journal. 1-6.
Ghozali, Imam., 2016. Aplikasi Analisis Multivariate
Dengan Program IBM SPSS 23 (Multivariate Analysis
Application with the IBM SPSS 23 Program),
Publishing by Univercity of Diponegoro. Semarang, 8
Th
edition.
Glossary of Statistical Terms, Retrieved 21 August 2008.
Degrees of Freedom. Animated Software.
Hamdan, NS. , Musa, H., Selamat, AS., Rashid, N., 2019.
Investigating Factors of Service Quality Influencing
Patient Satisfaction towards Patient Loyalty,
International Journal of Aqdvanced Science and
Technology. 28(14): 452-459.
Hanggraningrum, MD., Hariyanti, T., Rudijanto, A., 2017.
The Effect of Service Quality on Outpatient
Satisfaction of Dr. Soegiri General Hospital Lamongan,
JAM. 15 (4): 643-649.
Hassan, H., Rahman, MS., Sade, AB., 2015. Contemporary
Healthcare Experience in Malaysia Hospitals, J. Appl.
Bus. Econ., 17(4): 89-94.
Hastono, S.P., & Sabri, L., 2010. Statistik Kesehatan
(Health Statistics), Rajawali Pers. Jakarta.
Hatibie, TWJ. , Rattu, AJ. , Pasiak, T., 2015. Analisis
Faktor-Faktor yang Berhubungan dengan Kepuasan
Pasien di Instalasi Rawat Jalan Bedah RSUP Prof. Dr.
R. D. Kandou Manado (Analysis of Factors related to
Patient Satisfaction in Outpatients Surgery of RSUP
Prof. Dr. R. D. Kandou Manado), J Public Health
Science Unsrat 5: 302–310.
Kaban R., 2014. Pengaruh Komunikasi Dokter Terhadap
Kepuasan Pasien di Rawat Inap Kelas III Rumah Sakit
Umum Haji Medan Provinsi Sumatera Utara Tahun
2013 (Influence of Doctor Communication on Patient
Satisfaction in Class III Inpatient at General Hospital
Haji Medan in the Province of North Sumatra in 2013),
Helvetia Medan’s High Health Sciences.
Kashkoli, SA. , Zarei, E., Daneshkohan, A., Khodakarim,
S., 2017. Hospital responsiveness and its effect on
overall patient satisfaction: A cross-sectional study in
Iran, Int. J. Health Care Quality Assurance. 30 (8): 728-
736.
Laeliyah, N., Subekti, H., 2017. Waktu Tunggu Pelayanan
Rawat Jalan dengan Kepuasan Pasien terhadap
Pelayanan di Rawat Jalan RSUD Kabupaten Indramayu
(The Relationship between Waiting Time to Patient
Satisfaction for Outpatient Services at Indramayu
Regency Onshore General Hospital), Jkesvo. 1(2). 102-
112.
Liddy, C., Poulin, PA., Hunter, Z., Smyth, C., Keely, E.,
2017. Patient Perspectives on wait times and the impact
on their life: A waiting room survey in achronic pain
clinic, Scand. J. Pain., 17: 53-57.
Lucas, A., Edwards, M., 2017. Development of Crisis
Resource Management Skills: A Literature Review,
Clin. Simul. Nurs. , 13 (8): 347 – 358.
Mayasari, F., 2016. Analisis Hubungan Waktu Pelayanan
dan Faktor Total Quality Service terhadap Kepuasan
Identification of Service Quality Factors and Patient Satisfaction Level toward Specialist Doctor Treatment
15

Pasien di Poliklinik Kebidanan dan Kandungan RSIA
Anugerah Medical Centre Kota Metro Tahun 2015
(Analysis of the Relatioship of Service Time and Total
Quality Service Factors to Patient Satisfaction at the
Midwifery and Obstetric Clinic RSIA Anugerah
Medical Center Metro City in 2015), Jurnal ARSI. 214-
230.
Meesala, A., Paul, J., 2018. Service quality, consumer
satisfaction and loyalty in hospitals: Thinking for the
future, J. Retail. Consum. Serv. 40: 261-269.
Muninjaya G., 2011. Manajemen Kesehatan (Health
Management). Jakarta, Medical Book Publisher EGC.
Murtiana, E., Majid, R., Jufri, NN. Hubungan Mutu
Pelayanan Kesehatan kepada Kepuasan Pasien BPJS di
RSUD Kota Kendari Tahun 2016 (Relationship
between The Quality of Health Services to BPJS Patient
Satisfaction at the Kendari City General Hospital in
2016), JIMKESMAS. 1(4).
Northouse LL, Northouse PG., 1998. Health
Communication—Strategies for Health Professionals,
Stamford: Appleton & Lange, 3
rd
edition.
Notoatmodjo, S., 2018. Metodologi penelitian kesehatan
(Methodology of Health Research), Publisher PT
Rhineka Cipta. Jakarta, 3
rd
edition. 115-187.
Parasuraman A, Zeithaml VA, Berry LL, 1994.
Reassessment of Expectations as a Comparison
Standard in Measuring Service Quality: Implications
for Further Research, J Mark. 58: 111.
Pathak, P., 2017. An Analysis of Outpatients’ Perceived
Service Quality and Satisfaction in Selected Private
Hospitals of Kathmandu, J. Business and Social
Sciences Research (JBSSR). 2(1&2): 69-84.
Pohan, IS., 2015. Jaminan Mutu Layanan Kesehatan.
Dasar-Dasar, Pengertian dan Penerapan (Health
Service Quality Assurance. The Basics, Understanding
and Application), Publisher EGC. Hal, 76-77, 143-150.
Rensiner, Azwar, VY., Putra, AS., 2018. Analisa Faktor
Kualitas Pelayanan Terhadap Kepuasan Pasien Rawat
Jalan RSUD Dr.Acmad Darwis (Analysis of Service
Quality Factors on Outpatient Satisfaction of Dr.Acmad
Darwis Terrestrial General Hospital), J Kesehatan
Andalas. 7: 1-8.
Singh, B., Singhi, R., 2018. SERVQUAL impact on overall
satisfaction and brand loyalty: An empirical study in
Delhi-NCR hospital, Int. J. Healthc. Technol. Manag.,
17(1): 49-60.
Stats without Tears Statistics Symbol Sheet.
https://brownmath.com . 2018, 14 February.
Suaib, Indar, Jafar, N., 2011. Pengaruh Kualitas Pelayanan
Terhadap Kepuasan Pasien Di Ruang Rawat Inap Rsud
Syekh Yusuf Kabupaten Gowa (The Effect of Service
Quality on Patient Satisfaction in the Inpatient Room of
the Sheik Yusuf Ash- Land General Hospital Gowa
Districts), Universitas Hasanuddin. Makassar District,
2(4); 43-56.
Sugiyono, 2017. Statistika Untuk Penelitian (Statistics for
Research), Publisher Alfabeta. 28
th
edition. 389 pages.
Supartiningsih S., 2017. Kualitas Pelayanan dan Kepuasan
Pasien Rumah Sakit: Kasus Pada Pasien Rawat Jalan.
(Quality of Hospital Patient Satisfaction Services:
Cases in Outpatients), J Medicoeticolegal dan Manaj
Rumah Sakit 1018196/JMMR 2016. 6 (1): 9–15.
Szumilas, M., 2010. Explaining Odds Ratios, J Can Child
Adolesc Psychiatry. 19(3): 227-229.
Tacoh, T.S., Pangemanan, J.M., Rumampuk, J.F., 2013.
Hubungan Antara Pelayanan Dokter Dengan Kepuasan
Pasien Di Instalasi Rawat Inap A Badan Layanan
Umum Rumah Sakit Umum Pusat Prof. DR. R.D.
Kandou Kota Manado (The Relationship between
Doctor’s Service and Patient Satisfaction in the
Inpatient Ward A Public Service Agency Central
General Hospital Prof. Dr.D.R. Kandou, Manado City),
Universitas Sam Ratulangi Manado, Epub
Turnip, A., Andrian, Turnip, M., Dharma, A., Paninsari, D.,
Nababan, T., Ginting, C.N., 2020. An application of
modified filter algorithm fetal electrocardiogram
signals with various subjects, International Journal of
Artificial Intelligence, vol. 18, no., 2020.
Wijaya, C., Andrian, M., Harahap, M., Turnip, A., 2019.
Abnormalities State Detection from P-Wave, QRS
Complex, and T-Wave in Noisy ECG, Journal of
Physics: Conference Series, Volume 1230, (2019)
012015. doi:10.1088/1742-6596/1230/1/012015.
HIMBEP 2020 - International Conference on Health Informatics, Medical, Biological Engineering, and Pharmaceutical
16
