
Who Wants to Use an Augmented Reality Shopping Assistant
Application?
Daniel Mora
1
, Robert Zimmermann
2
, Douglas Cirqueira
3 a
, Marija Bezbradica
3 b
,
Markus Helfert
4 c
, Andreas Auinger
2 d
and Dirk Werth
1
1
Artificial Intelligence Lab, AWS Institute for Digitized Products and Processes, Saarbr
¨
ucken, Germany
2
Digital Business Management, University of Applied Sciences Upper Austria, Styer, Austria
3
School of Computing, Dublin City University, Dublin, Ireland
4
Innovation Value Institute, Maynooth University, Maynooth, Ireland
Keywords:
Digital Shopping Assistant, Recommender Systems, Explainable Artificial Intelligence, Retail Sales, Digital
Retail, Brick-and-Mortar.
Abstract:
Brick-and-mortar retailers need to stay competitive to the convenience provided by online channels. Tech-
nologies, such as personalized shopping assistants on smartphones can empower customers in-store towards a
similar experience as in an online scenario. For instance, an augmented reality shopping assistance application
with explainable recommendations (XARSAA) can mimic the behavior of recommender systems in personal-
izing offers to consumers in physical shops. However, before deploying such technologies, it is essential that
retailers get to know the demographics of their customer base. Existing literature rarely addresses the influence
of customers demographics towards XARSAA technologies. Therefore, we follow a design science approach,
and develop an instantiation of a XARSAA artifact, which is artificially evaluated through a controlled online
user experiment with 315 participants. Results illustrate multiple demographics which influence customers
attitude towards an augmented reality shopping assistant application in brick-and-mortar stores. Additionally,
we provide insights into the design of such technology to guide researchers in its implementation.
1 INTRODUCTION
Brick-and-mortar businesses are currently struggling.
For example, emblematic companies such as J. Crew,
GNC, and Brook Brothers, went bankrupt, leading
some researchers to describe the situation as the ”re-
tail apocalypse”. Still, physical stores certainly pro-
vide value to customers on their shopping journey,
taking a crucial role in the product information search
point (Pimenidis et al., 2019); To counter the ”retail
apocalypse,” the sector and literature propose tradi-
tional retailers to transition into omnichannel retail.
This retail model leverages technologies (e.g., rec-
ommender systems, explainable artificial intelligence,
augmented reality, and smart devices) in order to cre-
ate digital services around the customer experience
a
https://orcid.org/0000-0002-1283-0453
b
https://orcid.org/0000-0001-9366-5113
c
https://orcid.org/0000-0001-6546-6408
d
https://orcid.org/0000-0002-2672-0896
(Lemon and Verhoef, 2016).
One manifestation of this is a personalized digi-
tal assistant that boosts the customer journey (Parise
et al., 2016) as it allows retailers to suggest tailored
options that can positively stimulate the customer. For
instance, digital shopping assistants, levering explain-
able recommendations, are well regarded to enhance
sales and profit online (Cirqueira et al., 2019a), as
they provide customers with personalized offers and
reasons, which clarify and improve their decision-
making toward purchases (Zimmermann et al., 2019),
leading to higher satisfaction and retention (Gao et al.,
2019).
However, research exploring the impact of
explainable recommendations in brick-and-mortar
stores it is still scarce, which is why retail managers
and practitioners lack guidance on how to implement
such technology into their customers’ customer jour-
ney in the most effective way.
An essential requirement for such technology
would be to identify a typical user profile of cus-
Mora, D., Zimmermann, R., Cirqueira, D., Bezbradica, M., Helfert, M., Auinger, A. and Werth, D.
Who Wants to Use an Augmented Reality Shopping Assistant Application?.
DOI: 10.5220/0010214503090318
In Proceedings of the 4th International Conference on Computer-Human Interaction Research and Applications (CHIRA 2020), pages 309-318
ISBN: 978-989-758-480-0
Copyright
c
2020 by SCITEPRESS – Science and Technology Publications, Lda. All rights reserved
309

tomers who want to use explainable recommendations
in brick-and-mortar stores (Peker et al., 2017). Addi-
tionally, retailers usually assess their customer groups
based on demographics (Antony et al., 2018). Such
analysis is essential as it influences the types of prod-
ucts, offers, and bundles which a retailer can plan
(Wetzlinger et al., 2017). Furthermore, when im-
plementing novel technologies in-store, it is funda-
mental to assess the potential acceptance of different
customer profiles for such technologies (Ren et al.,
2018).
Hence, this study investigates how customers’
demographics influence the perception of an aug-
mented reality shopping assistance application with
explainable recommendations (XARSAA). Conse-
quently, we address the following research question:
I: Which customer demographic influences the cus-
tomer perception of an XARSAA? II: Which demo-
graphics does the target audience of an XARSAA
have?
We tackle the research questions following a de-
sign science approach, mainly focused on the stages
of problem and objectives identification, development
and artificial evaluation. We instantiate an XARSAA
application and assess the feasibility of such an in-
stantiation in increasing perceived usefulness, infor-
mativeness, irritation, purchase intention, and trust in
the technology in-store, based on the model of (Haus-
man and Siekpe, 2009), and (Hoffman et al., 2018).
The instantiation is evaluated following an artificial
evaluation approach, through a controlled online user
experiment with 315 participants.
The paper is structured as follows: Section 2
presents related work. Section 3 illustrates the re-
search methodology and details on the study develop-
ment. Section 4 provides the study results. Section 5
discusses results and main findings, followed by sec-
tion 6 which focus on the current limitations of the
study, as well as future work. Closing, the section 7
concludes the paper.
2 RELATED WORK
We review the state-of-the-art trends in the retail do-
main, as well as previous approaches in deploying
recommender systems in physical stores as the un-
derline mechanism to provide personalized shopping
assistance. This allows us to identify limitations in
the current corpus and draw motivation for our study,
as the investigation of the feasibility of an XARSAA
prototype in-store, also integrating Explainable Arti-
ficial Intelligence (XAI) methods.
2.1 Digital Retail
The concept of the digitization of retail has become
quiet the trend starting with e-commerce and internet-
based companies, such as Amazon.com, Otto.com,
and many others. It expanded into different channels
and customer touchpoints such as smartphones and
social media.
Consequently, retailers rapidly began to target
customers across different channels, giving birth to
what is now known as the multi-channel retail ap-
proach. In turn, this is slowly morphing into om-
nichannel retail, which integrates all channels and
touchpoints into a single seamless customer expe-
rience. In parallel, companies have started adopt-
ing customer experience at the center of the business
model, and digital technologies are deployed to en-
hance that experience (Parise et al., 2016), (Rigby,
2011).
Accordingly, McKinsey’s Consulting affirms that
with omnichannel retailing, retailers can do person-
alized advertising and promotion via devices, such as
the increasingly ubiquitous devices (MacKenzie et al.,
2013); smartphones as the archetype of this devices
(Pimenidis et al., 2019), which can also be enhanced
by technologies that are prognostic to revolutionary
the retail sector, such as, Augmented Reality (von
Briel, 2018).
In (Parise et al., 2016), the authors acknowledge
the problem of meeting customers’ expectations in
brick-and-mortar and evaluate how digital technolo-
gies can aid in the improvement of customer expe-
rience and in the transition to omnichannel retail.
The authors consider in-store touchpoints essential,
and identify digital shopping assistance as one of the
key solutions to battle brick-and-mortar challenges to
meet customers’ expectations. The digital shopping
assistant provides a more holistic experience for the
customers in the physical stores, boosting utilitarian
value through efficiency in information search and
product comparison, as well as hedonic value creating
a more immersive experience leveraging technologies
such as augmented reality, thus, stimulating the cus-
tomer perception of fun, pleasure, and enjoyability
(Juaneda-Ayensa et al., 2016) – crucial factors influ-
encing customers’ shopping experience.
2.2 Explainable Recommendations
Recommender engines have helped online commerce
in the past decades, providing customers with a more
personalized experience, which has led to a high-
impact on retails sales and customer retention (Am-
atriain and Basilico, 2015), (MacKenzie et al., 2013)
WUDESHI-DR 2020 - Special Session on User Decision Support and Human Interaction in Digital Retail
310

(Cirqueira et al., 2019b). The recommender systems
work as a type of information filtering that lever-
age machine learning techniques, to determine users’
preferences to generate a ranked list of products rel-
evant for the users, based on their past behavior and
similarities to other customers, as well as patters in
items information (Mora et al., 2020). These engines
allow enterprises to better understand how they can
target customers or potential buyers, understanding
customer experience throughout the customer journey
(Lemon and Verhoef, 2016). Recommender systems
provides utilitarian value for the users as it boosts ef-
ficiency on information searches, and product com-
parison (Pimenidis et al., 2019) – key stages on the
path-to-purchase (Shankar et al., 2011), with the po-
tential to enhance the digital sales conversion.
While AI empowers recommender systems, re-
searchers have also considered the value of Explain-
able AI supporting in such application. Explainable
AI research aims to enable understanding of AI pre-
dictions, while keeping good learning performance
(Adadi and Berrada, 2018). Explainable AI has the
potential to support decision-making of AI users, and
enhance their experience and trust while dealing with
automated partners (Cirqueira et al., 2020). In the
context of recommender systems, explainable rec-
ommendations aim to enhance shopping experience,
through high quality and intuitive recommendations,
which are easy to consume (Wang et al., 2018). In-
deed, it has been shown that such explanations in-
crease purchase intention (Chen et al., 2019). In
(Zhang and Chen, 2018), the authors classify expla-
nations in the context of recommender systems within
five types: 1) User or Item-Based; 2) Feature-Level;
3) Textual; 4) Visual; and 5) Social.
User or Item-Based explanations regard similar
users and products to recommend items to a user.
Feature-level refers to important features of a prod-
uct, which a customer usually considers to make pur-
chases. Textual explanations are presented as natural
language sentences for a user to read. Visual expla-
nations highlight features on the image of a product
which are important for recommendations. Social ex-
planations are connected to friends and social media
activities to illustrate how a particular product is per-
ceived to a user. Those have been explored in the sce-
narios of restaurants (He et al., 2015), E-commerce
shopping (Cheng et al., 2019), movies recommenda-
tion (Huang et al., 2019).
However, it is lacking the assessment of explain-
able recommendations with augmented reality for re-
tailers’ assessment of such technologies when dealing
with different customer profiles and demographics in-
store.
3 RESEARCH METHODOLOGY
This research follows a Design Science Research
methodology (Peffers et al., 2007). That methodol-
ogy is suitable when taking and information systems
perspective for a study, which considers the require-
ments of users for the development of a system fulfill-
ing such requirements with an organization (Gregor,
2006; Creedon, 2016). Furthermore, it provides clear
steps for identifying the problems within an organiza-
tion, and for assuring rigor and relevance of a research
outcome by analyzing the state of the art and practice,
and to assure a problem is relevant for practitioners
and industry. In addition, the methodology guides the
development of an artefact to solve the problem, and
the interaction with practitioners to guarantee it is ful-
filling the research requirements.
In our study, we focus on investigating the impact
of an application on customers attitude moderated by
demographics, which might affect their willingness
for shopping in-store. Given those aspects and con-
nection to our research goals, we adopt this method-
ology to guide the development of this study, focused
on the stages of problem and objectives identification,
development, and artificial evaluation step.
We started by investigating the problem, based on
the literature review described in section 2 and discus-
sions with practitioners within the PERFORM Train-
ing Network (Perform, 2020), which is a Horizon
2020 project and consortium composed of retailers
and universities. We perceived the problem as the lack
of understanding how customer demographics influ-
ence customers acceptance of an XARSAA in-store.
This is a barrier for retailers aiming to invest in in-
novative technologies in their physical shops. The
research objective was then settled as to develop an
XARSAA tool as an artifact, and assess the perfor-
mance of its instantiation, moderated by demograph-
ics influencing the users attitude towards such a tool
in-store.
Therefore, from the literature review and discus-
sions with practitioners, the requirements for devel-
oping the XARSAA are to develop an XARSAA:
R1) within a mobile user-interface; R2) based on past
shopping data of customers; R3) enabling explainable
recommendations for shopping in-store; R4) to eval-
uate the developed XARSAA artefact through its in-
stantiation regarding the attitude of users moderated
by their demographics.
Who Wants to Use an Augmented Reality Shopping Assistant Application?
311
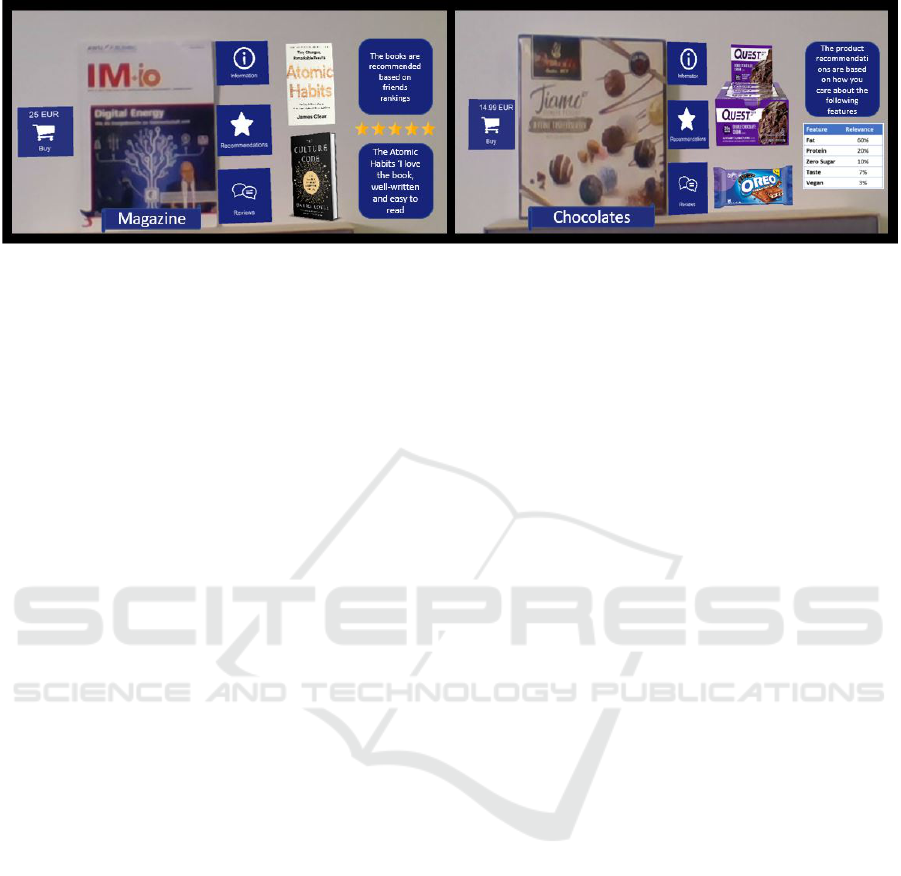
Figure 1: Smartphone-based artifact illustration leveraring AR recommendations enhanced by XAI for the participants.
3.1 Mobile-based Augmented Reality
Shopping Assistance Application
For development of the artifact and its instantia-
tion, the proposed XARSAA, which customers can
use throughout their shopping journey in brick-and-
mortar stores, is developed as an application running
on an android-based smartphone device. In our sce-
nario, while the app is deployed by the retailer, the
device is owned by the customer. Thus, the device
has access to personal information, which is needed to
provide tailored recommendations (e.g., social media,
historical purchase data). We conceptualize the arti-
fact instantiation to provide augmented content, an-
chored around the product of interest, and it displays
recommendations, offers, and comparison of items on
the smartphone as shown in Figure 1, besides to a buy
option.
In this stage of the prototype development, the
XARSAA leverages the smartphones camera to first
detect the customers’ object of interest (product-
item), then the application can monitor the user’s
cameras field of view to determine which product is
being examined by users at each point in time, as well
to track the item in the physical space under the cam-
era field of view overtime. The involved object recog-
nition can be realized using SDKs such as Vuforia
(Microsoft, 2019). Furthermore, the application dis-
plays multiple digital buttons (UI) anchored around
the product to trigger and display relevant content us-
ing augmented reality.
3.2 Survey
Because of the early stage of our artifact, artificial
artifact evaluation was conducted by using an online
survey as this is the first evaluation and an online sur-
vey provides a fast and efficient way to get a suffi-
cient number of participants. In the survey, partici-
pants were introduced to the concept of an XARSAA
instantiation with the help of pictures and videos.
To measure participants attitude towards an
XARSAA we adopted a questionnaire design pro-
posed by Hausman and Siekpe (Hausman and Siekpe,
2009). Consequently, we measured the participants
attitude towards the XARSAA with the constructs
“Usefulness” (4 items), “Entertainment” (3 items),
“Informativeness” (3 items), “Irritation” (3 items)
and “Purchase Intention” (4 items). Additionally,
we measured trust towards an XARSAA adopting a
scale from Hoffman et al. (Hoffman et al., 2018)
(6 items). Items were measured using a 5-point
Likert-type scale ranging from “Completely Dis-
agree” to “Completely Agree” and the sequence of
questions was randomly shuffled to avoid order bias.
Complementing, we asked participants open ques-
tions to get their general sentiment (“Yes, I agree” /
”No, I disagree”) about the presented XARSAA (5
items) as well as questions about their demographics
(“Age”,”Gender”,”Income”,”Shopping Type”, “Edu-
cation”). The questionnaire was conducted using
the software Surveygizmo (SurveyGizmo, 2020). An
overview of all questions asked can be found in Table
3.
3.3 Participants
We recruited participants using a crowd-sourcing
provider called Clickworker (Clickworker, 2020a) as
this provider ensures a high level of qualification of
their crowd workers by requiring the use of real per-
sonal data, testing of writing and language skills and
a constant evaluation of their workers results (Click-
worker, 2020b).
In total, we recruited 315 participants from the
DACH region (Germany, Austria and Switzerland).
To enrich the quality of our sample, we excluded par-
ticipants who took less than seven minutes to com-
plete our survey, used the same IP multiple times to
answer the survey, or entered only one word or ran-
dom letters in the open questions as the credibility of
these participants is questionable. The resulting sam-
WUDESHI-DR 2020 - Special Session on User Decision Support and Human Interaction in Digital Retail
312

Table 1: Statistical Tests.
Construct n Age Gender Income Shopping Type Education
Usefulness 251 0.370
R
0.005
M
0.031
K
0.604
K
0.694
K
Entertainment 251 0.432
R
0.057
M
0.112
K
0.087
K
0.969
K
Information 251 0.338
R
0.173
M
0.007
K
0.040
K
0.851
K
Irritation 251 0.357
R
0.674
M
0.016
K
0.848
K
0.418
K
PI 251 0.160
R
0.002
M
0.082
K
0.006
K
0.505
K
Trust 251 0.631
R
0.002
M
0.445
K
0.192
K
0.528
K
Q1 240 <0.001
T
0.142
C
0.724
M
0.746
M
0.147
M
Q2 231 0.106
T
0.411
C
0.793
M
0.327
M
0.137
M
Q3 230 0.349
T
0.073
C
0.370
M
0.990
M
0.887
M
Q4 213 0.901
T
0.037
C
0.710
M
0.029
M
0.719
M
Q5 229 0.325
T
0.080
C
0.430
M
0.361
M
0.814
M
Note: R (Regression), T (T-Test), M (Mann-Whitney-U-Test), C (Chi Squared),
K (Kruskal-Wallis-Test), PI (Purchase Intention)
Table 2: Bonferroni adjusted post-hoc tests and effect sizes.
D-C Group Comparison n1/n2 M1/ M2 T/Z/Chi Sig. d
Age - Q1 Yes-No 109/131 34.03/39.92 3.929 <0,001 0.509
Gender - Usefulness Female-Male 131/118 3.18/3.55 -2.788 0.005 0.357
Gender - PI Female-Male 131/118 2.92/3.31 -3.056 0.002 0.393
Gender - Trust Female-Male 131/118 3.0/3.26 -3.066 0.002 0.395
Income - Information <1000e- 1000e-1999e 63/84 3.41/3.90 -3.235 0.018* 0.554
Income - Irritation 1000e-1999e- 2000e-2999e 84/53 2.20/2.79 -3.194 0.021* 0.567
Shopping Type - PI NAF-VF 25/42 2.6/3.42 -3.412 0.006* 0.917
Shopping Type - Q4 Yes-No 96/117 2.90/2.61 -2.189 0.029 0.303
Note: D - C (Demographic - Construct), M (Mean), Q (Question; see Appendix), d (Cohens’s d),
NAF (Not at All Frequently), VF (Very Frequently), PI (Purchase Intention),
* (Bonferroni Adjusted)
ple included 251 participants between the age of 18
to 69 (mean age = 37.43, SD = 12.06) of which 131
(52.2%) were female, 118 (47%) were male, and 2
(0.8%) were divers. Looking at the participant’s ed-
ucation, 16 (6.4%) had “Some secondary education
(high school)”, 69 (27.5%) “Completed secondary
education (graduated high school)”, 97 (38.6%) had
“Some undergraduate education (college or univer-
sity)”, and 69 (27.5%) “Completed postgraduate edu-
cation (masters or doctorate)”. From the participants,
63 (25.1%) had a monthly net income of less than
1000 e, 84 (33.5%) earned between 1000 eand 2000
e, 53 (21.1%) earned between 2001 eand 3000 e,
29 (11.6%) earned between 3001 eand 4000 e, 15
(6%) earned between 4001 eand 5000 eand 7 (2.8%)
earned more than 5000 e. Participants shopping fre-
quency in the last 30 days was as follows, 25 (10%)
”Not at all frequently”, 63 (25.1%) “Slightly Fre-
quently”, 114 (45.4%) “Moderately Frequently”, 42
(16.7%) “Very Frequently”, and 7 (2.8%) “Extremely
Frequently”.
3.4 Statistics
To analyze for significant impacts of participants de-
mographics on their attitude towards an XARSAA
we performed the following statistical tests: We used
a linear regression to check for a correlation be-
tween “Age” and attitudes, a Mann-Whitney-U-Test
to check for single group differences in “Gender”, and
a Kruskall-Wallis-Test for multiple group differences
in “Income”, “Shopping Type”, and “Education”.
When statistically significant differences were identi-
fied, we complemented the Kruskall-Wallis-Test with
Bonferroni adjusted post-hoc tests to pinpoint the sig-
nificant group differences. Despite having used Lik-
ert scales, we calculated this analyzes using the mean
values of each construct as we regard the psycholog-
ical difference of the items on the used Likert scales
as equal and in such cases, Likert scales can be re-
garded as a continuous scales and their resulting data
as interval data.
Additionally, we analyzed the influence of partic-
ipant’s demographics on their shown sentiment when
Who Wants to Use an Augmented Reality Shopping Assistant Application?
313

answering the open questions using a T-Test (“Age”),
Chi-Squared (“Gender”), and Mann-Whitney-U-Test
(“Income”, “Shopping Type”, “Education”). We ex-
cluded participants who gave no answer or answered
“I don’t know”. When analyzing “Gender” we ex-
cluded participants who answered “Diverse” as their
small sample size (n = 2) does not allow for a robust
statistical analyzes. We tested the effect size of all dis-
covered differences using Cohen’s d’ (Cohen, 1992).
The software SPSS (v. 26) (IBM, 2020) was used to
analyze the survey data.
4 RESULTS
Looking at the results, participants “Age”, “Gender”,
“Income”, and “Shopping Type” had a significant in-
fluence on participants attitude towards an XARSAA
and participants sentiment when answering the open
questions (see Table 1).
In detail (see Table 2), a lower “Age” has a sig-
nificantly positive influence on participant’s desire for
additional feature, showing a medium effect size (Yes:
M = 34.03/ No: M = 39.92/ d = 0.509). “Gender”,
has a significant impact on perceived usefulness (Fe-
male: M = 3.18/ Male: M = 3.55/ d = 0.357), “Pur-
chase Intention” (Female: M = 2.92/ Male: M = 3.31/
d = 0.393), and “Trust” (Female: M = 3.00/ Male:
M = 3.26/ d = 0.395) of an XARSAA, all showing
small effect sizes and Male participants being more
effected. “Income” has a significant influence on per-
ceived “Information” (<1000e: M = 2.20/ 1000e-
1999e: M = 3.90/ d = 0.554), with lower income
participants perceiving the XARSAA less informa-
tive than higher income participants, and “Irritation”
(1000e-1999e: M = 3.41/ 2000e-2999e: M = 2.97/
d = 0.567), with lower income participants perceiving
the XARSAA more irritating than higher income par-
ticipants, both showing medium effect sizes. “Shop-
ping Type” has a significant influence on perceived
“Purchase Intention”, with more frequent shoppers
having a higher purchase intention than less frequent
shoppers, showing a large effect size (Not at All Fre-
quently: M = 2.60/ Very Frequently: = 3.42/ d =
0.917), and the possibility of an XARSAA to motivate
people to go brick-and-mortar shopping, with more
frequent shoppers being more motivated to go shop-
ping than less frequent shoppers, showing a small ef-
fect size (Yes: M = 2.90/ No: M = 2.61/ d = 0.303). In
contrast, participants ”Education” did not have a sig-
nificant impact on participant’s attitude or sentiment
towards an XARSAA.
5 DISCUSSION
Our study could detect multiple demographic influ-
ences on participant’s attitude and participant’s senti-
ment towards an XARSAA.
First, the age of a participant has a significant
influence on the desire for additional features, with
a younger participants requesting more features and
older participants requesting no additional features.
This demonstrates that when designing an XARSAA
it should be taking into consideration to which age
group the XARSAA should be targeted. Younger
users prefer an application with a wide variety of fea-
tures while older users might prefer a more stream-
lined and less complex experience.
Second, the gender of a participant has a signif-
icant influence on the perceived “Usefulness”, “Pur-
chase Intention”, and “Trust” of an XARSAA, with
women having a lower score then men in all these
constructs. This indicates that an XARSAA should
preferably be targeted to male target group. However,
as the observed effect sizes only show a small effect
this difference should not be overestimated.
Third, people with lower income showed a sig-
nificantly lower value in perceived “Information” and
a significantly higher value in perceived “Irritation”
compared to people with higher income. This could
indicate that differing income groups have differing
requirements regarding the type and amount of pre-
sented information of an XARSAA. For example,
people with lower income might value a feature to
compare prices much higher compared to people with
higher income and in turn, people with higher income
could prefer information about the origin of a prod-
uct. Indeed, price comparison has been perceived
to empower consumers with low income previously
(Hamilton, 2009). Although the observed differences
show a medium effect size, it has to be noted that in
each of the two constructs only a single group com-
parison showed a significant difference, which dimin-
ishes the overall strength of the observed effect.
Forth, ”Shopping Type” has a significant influence
on users perceived “Purchase Intention” when using
an XARSAA. In fact, “Very Frequent” shoppers have
a much higher “Purchase Intention” when using an
XARSAA than “Not at all Frequently” shoppers. This
difference shows a high effect size further emphasiz-
ing that an XARSAA should be targeted to frequent
shoppers to further increase their purchase intention
instead of less frequent shoppers who might benefit
less from using an XARSAA. Furthermore, although
having a small effect, more frequent shoppers showed
to be more motivated by the use of an XARSAA to
shop in-store, then less frequent shoppers.
WUDESHI-DR 2020 - Special Session on User Decision Support and Human Interaction in Digital Retail
314

Fifth, participants education does not have an im-
pact on participant’s attitude or participant’s senti-
ment towards an XARSAA, which is why it should
not be taken into consideration when designing an
XARSAA for a specific target group.
Summarizing, we argue that the optimal user
of an XARSAA would be male, as they perceive
an XARSAA as more useful and informative and
trust explainable recommendations more. The user
should not belong to the elderly group to still make
use of a wide variety of features, which would be
used to specifically tailor the information provided
by the XARSAA to people with lower and higher in-
come using in app personalization. Additionally, the
XARSAA should be targeted to frequent shoppers as
these would be motivated even more to shop in brick-
and-mortar stores by using an XARSAA and when
using an XARSAA would also have an increased pur-
chase intention.
6 LIMITATIONS AND FUTURE
WORK
In its current form, our study has some limitations
that are mainly connected with the stage of research,
as well as the design of the artifact and instantia-
tion. First, we restricted our assessment to an arti-
ficial evaluation approach, following the design sci-
ence research framework. Therefore, the study does
not cover a whole design science project and steps,
but it is particularly focused on the stages of identify-
ing the problem, development of an artefact to solve
the problem, and its artificial evaluation.
Thus, in the current form, the instantiation was
not assessed in a real retail environment and as such
misses important characteristics of real retail situa-
tions as for example an assessment of participants
status of flow (Hausman and Siekpe, 2009). Addi-
tionally, our study did not test customers privacy con-
cerns, which need to be further evaluated as usually
customers express higher privacy concerns in person-
alized services than in non-personal ones (Wetzlinger
et al., 2017).
Despite the mentioned issues, recommender sys-
tems and the shopping assistant artifact instantiation
provide clear benefits to enhance user’s experience on
the path-to-purchase, as the system support customers
and provide rich information for decision-making
through the customer shopping journey, which has the
potential to boost brick-and-mortar sales. However,
as our study was focused on the influence of demo-
graphics on the the attitude towards an XARSAA, we
did not measure how an XARSAA competes to a reg-
ular shopping scenario or an augmented reality shop-
ping scenario without explainable AI features. Under-
standing the customer and working on their holistic
experience are some of the major obstacles that re-
tailers need to overcome. Some even go as far as to
call them the most important constraints for the future
of retail (Lemon and Verhoef, 2016).
Thus, we spotted different opportunities to com-
plement the study. In addition, the design science
methodology will be covered fully with iterations in-
cluding practitioners, and the design practice and nat-
uralistic evaluation of the instantiation. For instance,
further investigation should be conducted to evalu-
ate the artifact instantiation in comparison to other
shopping scenarios. Moreover, it is aimed to pro-
vide retailers and developers with the design princi-
ples and practices for such an application, which fos-
ters customer positive attitude towards shopping in-
store. Additionally, the impact of an XARSAA on
brick-and-mortar sales should be evaluated in a real-
case scenario in order to include flow assessment and
measure the impact of privacy concerns.
7 CONCLUSION
Looking at our first research question we conclude,
that a customer’s perception of an XARSAA is in-
fluenced by the demographics “Age”, “Gender”, “In-
come” and “Shopping Type”. Regarding our second
research question, we argue that the optimal user of
an XARSAA would be a younger male who likes
to shop at least frequently. Users with low income
should receive different information then users with
high income. The level of education is not relevant for
designing an XARSAA. These results have various
managerial implications. By understanding the im-
pact of demographics on customers attitude towards
an XARSAA, retailers can decide if such a tool is an
appropriate tool to be used to engage with their main
customer target group and as a consequence if it fits
to the company in general.
As such, brick-and-mortar retailers need to under-
stand that not all customers are alike. Gathering more
information about individual customers than just their
past purchases in the store may allow for more precise
subsequent analyses and predictions. For example,
adults could be differentiated from children in order
to see whether and how their shopping habits differ.
Additionally, with XARSAA Brick-and-mortar
stores have the opportunity to integrate innovative so-
lutions, not by mimicking the e-commerce but by an-
alyzing in-store customer desires and adapting tech-
nologies that have been proven to be key success
Who Wants to Use an Augmented Reality Shopping Assistant Application?
315

factors in modern retail, like recommender systems
(MacKenzie et al., 2013) and technologies that have
the potential to enrich customer experience like AR
(Papagiannidis et al., 2017).
To conclude, retailers needs to focus on solving
the customers’ problem, aiming to create a holistic
experience along the shopping journey. As creating
a shopping assistant which creates a more immersive
experience, and by leveraging machine learning tech-
niques can provide a more personalize in-store experi-
ence to the customers. These shopping assistant, such
as an XARSAA, can enhance the digital transforma-
tion of brick-and-mortar stores and thus, help the shift
in the physical environments in order to blur the per-
ception of channels for customers toward omnichan-
nel retail.
Therefore, as the retail sector moves forward, and
most retailers face challenges to keep up the competi-
tion, this study can help traditional brick-and-mortar
stores managers to create strategies, as well as it gives
insights for the practitioners who are working on the
transition toward the omnichannel model, in order to
strengthen their market position and become more re-
silient to online competition.
ACKNOWLEDGEMENT
This research is a part of the
European Training Network
project PERFORM that has
received funding from the Eu-
ropean Union’s Horizon 2020
research and innovation program under the Marie
Skodowska-Curie grant agreement No 765395. This
research reflects only the authors’ view, the European
Commission is not responsible for any use that may
be made of the information it contains.
REFERENCES
Adadi, A. and Berrada, M. (2018). Peeking inside the black-
box: A survey on explainable artificial intelligence
(xai). IEEE Access, 6:52138–52160.
Amatriain, X. and Basilico, J. (2015). Recommender sys-
tems in industry: A netflix case study. In Recom-
mender systems handbook, pages 385–419. Springer.
Antony, R., Khanapuri, V. B., and Jain, K. (2018). Customer
expectations and moderating role of demographics in
fresh food retail. International Journal of Retail &
Distribution Management.
Chen, X., Zhang, Y., and Qin, Z. (2019). Dynamic explain-
able recommendation based on neural attentive mod-
els. In Proceedings of the AAAI Conference on Artifi-
cial Intelligence, volume 33, pages 53–60.
Cheng, Z., Chang, X., Zhu, L., Kanjirathinkal, R. C.,
and Kankanhalli, M. (2019). Mmalfm: Explainable
recommendation by leveraging reviews and images.
ACM Transactions on Information Systems (TOIS),
37(2):1–28.
Cirqueira, D., Helfert, M., and Bezbradica, M. (2019a).
Towards preprocessing guidelines for neural network
embedding of customer behavior in digital retail. In
Proceedings of the 2019 3rd International Symposium
on Computer Science and Intelligent Control, pages
1–6.
Cirqueira, D., Hofer, M., Nedbal, D., Helfert, M., and
Bezbradica, M. (2019b). Customer purchase behav-
ior prediction in e-commerce: A conceptual frame-
work and research agenda. In International Workshop
on New Frontiers in Mining Complex Patterns, pages
119–136. Springer.
Cirqueira, D., Nedbal, D., Helfert, M., and Bezbrad-
ica, M. (2020). Scenario-based requirements elicita-
tion for user-centric explainable ai. In International
Cross-Domain Conference for Machine Learning and
Knowledge Extraction, pages 321–341. Springer.
Clickworker (2020a). Enterprise online survey software &
tools - surveygizmo.
Clickworker (2020b). Our crowd - the clickworkers.
Cohen, J. (1992). Quantitative methods in psychology: A
power primer. Psychol. Bull., 112:1155–1159.
Creedon, F. (2016). The framework for REVIEWS: an ex-
ploration into design principles for an electronic med-
ical early warning system observation chart. PhD the-
sis, University College Cork.
Gao, J., Wang, X., Wang, Y., and Xie, X. (2019). Ex-
plainable recommendation through attentive multi-
view learning. In Proceedings of the AAAI Conference
on Artificial Intelligence, volume 33, pages 3622–
3629.
Gregor, S. (2006). The nature of theory in information sys-
tems. MIS quarterly, pages 611–642.
Hamilton, K. (2009). Low-income families: experiences
and responses to consumer exclusion. International
journal of sociology and social policy.
Hausman, A. V. and Siekpe, J. S. (2009). The effect of
web interface features on consumer online purchase
intentions. Journal of business research, 62(1):5–13.
He, X., Chen, T., Kan, M.-Y., and Chen, X. (2015). Tri-
rank: Review-aware explainable recommendation by
modeling aspects. In Proceedings of the 24th ACM In-
ternational on Conference on Information and Knowl-
edge Management, pages 1661–1670.
Hoffman, R. R., Mueller, S. T., Klein, G., and Litman, J.
(2018). Metrics for explainable ai: Challenges and
prospects. arXiv preprint arXiv:1812.04608.
Huang, X., Fang, Q., Qian, S., Sang, J., Li, Y., and Xu,
C. (2019). Explainable interaction-driven user model-
ing over knowledge graph for sequential recommen-
dation. In Proceedings of the 27th ACM International
Conference on Multimedia, pages 548–556.
IBM (2020). Ibm spss statistics 26.
WUDESHI-DR 2020 - Special Session on User Decision Support and Human Interaction in Digital Retail
316

Juaneda-Ayensa, E., Mosquera, A., and Sierra Murillo, Y.
(2016). Omnichannel customer behavior: key drivers
of technology acceptance and use and their effects on
purchase intention. Frontiers in psychology, 7:1117.
Lemon, K. N. and Verhoef, P. C. (2016). Understanding
customer experience throughout the customer journey.
Journal of marketing, 80(6):69–96.
MacKenzie, I., Meyer, C., and Noble, S. (2013). How retail-
ers can keep up with consumers. McKinsey & Com-
pany, 18.
Microsoft (2019). Microsoft: Using vuforia engine with
unity.
Mora, D., Jain, S., Nalbach, O., and Dirk, W. (2020). Holo-
graphic recommendations in brick-and-mortar stores.
In 2020. Americas Conference on Information Sys-
tems Proceedings. 12.
Papagiannidis, S., Pantano, E., See-To, E. W., Dennis, C.,
and Bourlakis, M. (2017). To immerse or not? exper-
imenting with two virtual retail environments. Infor-
mation Technology & People.
Parise, S., Guinan, P. J., and Kafka, R. (2016). Solving
the crisis of immediacy: How digital technology can
transform the customer experience. Business Hori-
zons, 59(4):411–420.
Peffers, K., Tuunanen, T., Rothenberger, M. A., and Chat-
terjee, S. (2007). A design science research method-
ology for information systems research. Journal of
management information systems, 24(3):45–77.
Peker, S., Kocyigit, A., and Eren, P. E. (2017). Lrfmp model
for customer segmentation in the grocery retail indus-
try: a case study. Marketing Intelligence & Planning.
Perform (2020). Digital retail perform: A marie
skłodowska-curie training network.
Pimenidis, E., Polatidis, N., and Mouratidis, H. (2019). Mo-
bile recommender systems: Identifying the major con-
cepts. Journal of Information Science, 45(3):387–397.
Ren, Y., Tomko, M., Salim, F. D., Chan, J., and Sanderson,
M. (2018). Understanding the predictability of user
demographics from cyber-physical-social behaviours
in indoor retail spaces. EPJ Data Science, 7:1–21.
Rigby, D. (2011). The future of shopping. Harvard business
review, 89(12):65–76.
Shankar, V., Inman, J. J., Mantrala, M., Kelley, E., and Ri-
zley, R. (2011). Innovations in shopper marketing:
current insights and future research issues. Journal of
Retailing, 87:S29–S42.
SurveyGizmo (2020). Enterprise online survey software &
tools - surveygizmo.
von Briel, F. (2018). The future of omnichannel retail:
A four-stage delphi study. Technological Forecasting
and Social Change, 132:217–229.
Wang, N., Wang, H., Jia, Y., and Yin, Y. (2018). Explain-
able recommendation via multi-task learning in opin-
ionated text data. In The 41st International ACM SI-
GIR Conference on Research & Development in Infor-
mation Retrieval, pages 165–174.
Wetzlinger, W., Auinger, A., Kindermann, H., and
Sch
¨
onberger, W. (2017). Acceptance of personaliza-
tion in omnichannel retailing. In International Con-
ference on HCI in Business, Government, and Orga-
nizations, pages 114–129. Springer.
Zhang, Y. and Chen, X. (2018). Explainable recommenda-
tion: A survey and new perspectives. arXiv preprint
arXiv:1804.11192.
Zimmermann, R., Auinger, A., and Riedl, R. (2019). Smart-
phones as an opportunity to increase sales in brick-
and-mortar stores: Identifying sales influencers based
on a literature review. In Nah, F. F.-H. and Siau, K.,
editors, HCI in Business, Government and Organiza-
tions. eCommerce and Consumer Behavior, volume
11588 of Lecture Notes in Computer Science, pages
82–98. Springer International Publishing, Cham.
APPENDIX
In the following section, all questions of the used
questionnaire in this study are shown in Table 3.
Who Wants to Use an Augmented Reality Shopping Assistant Application?
317
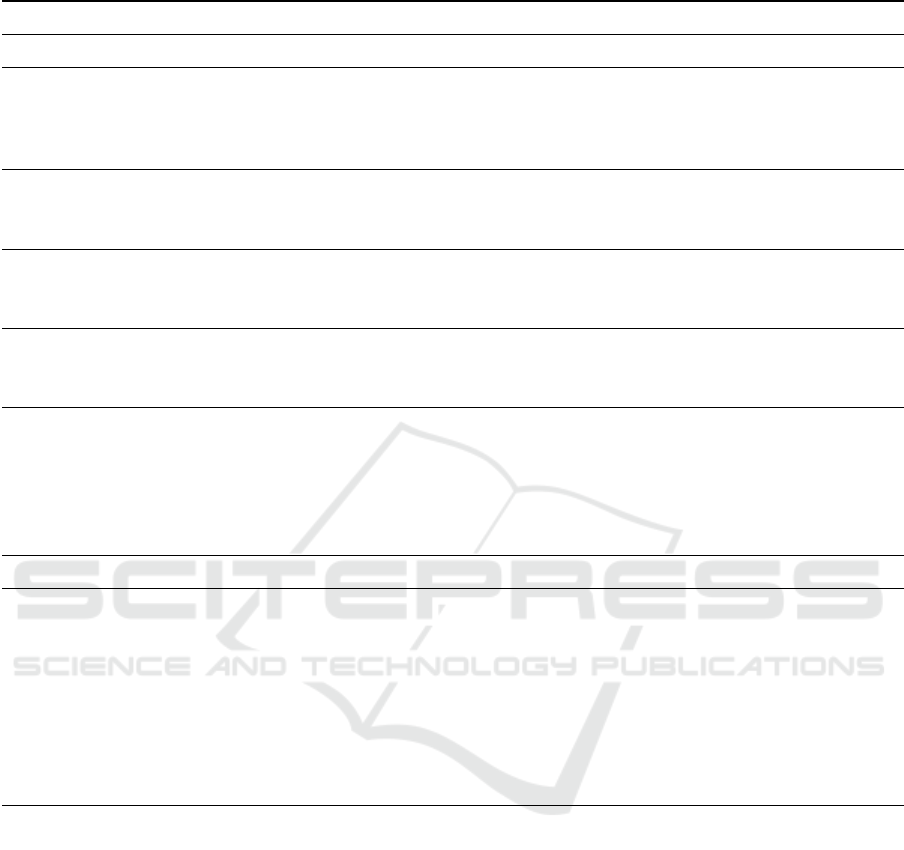
Table 3: Questions to the participants.
Constructs Questions
Attitutes towards XARSAA
Usefulness
Use1 This scenario can improve my shopping performance in-store
Use2 This scenario can increase my shopping productivity in-store
Use3 This scenario can increase my shopping effectiveness in-store
Use4 This scenario seems useful in brick-and-mortar
Enjoyment
Enj1 The shown scenario is enjoyable
Enj2 The shown scenario is pleasing
Enj3 This scenario is entertaining
Informarion
Inf1 The shown scenario offers a good source of product information
Inf2 This scenario supplies relevant information
Inf3 This scenario is informative concerning the shown products
Irritation
Irr1 The shown scenario is annoying
Irr2 The shown scenario is frustrating
Irr3 This scenario is irritating
Purchase Intention
PI1 I would definitely buy products in this scenario
PI2 I would intend to purchase products in this scenario in the near future
PI3 If it would exist today, it is likely that I would purchase products in this scenario
in the near future
PI4 I would expect to purchase products in this scenario in the near future if it
would exist today
Sentiment of participants
Sentiment
Q1 Looking at the presented application, are there features you are missing?
Q2 Do you see any issues or room for improvement when using this app?
If yes, could you give examples?
Q3 Would this application help to make your shopping trip more secure during
COVID-19? If yes, why and if no, why not?
Q4 Would this application motivate you to shop in-store?
If yes, why and if no, why not?
Q5 Did you find the explanations given by the application helpful?
If yes, why and if no, why not?
WUDESHI-DR 2020 - Special Session on User Decision Support and Human Interaction in Digital Retail
318
