
Meme vs. Non-meme Classification using Visuo-linguistic Association
Chhavi Sharma
1
, Viswanath Pulabaigari
1
and Amitava Das
2
1
Department of Computer Science Engineering, Indian Institute of Information Technology, Sri City, India
2
Wipro AI Labs, Bangalore, India
Keywords:
Meme, Multi-modality, Social Media.
Abstract:
Building on the foundation of consolidating humor with social relevance, internet memes have become an
imperative communication tool of the modern era. Memes percolate through the dynamic ecosystem of the
social network, influencing and changing the social order along the way. As a result, the status quo of the social
balance changes significantly, and at times channelized in unwanted directions. Besides flagging harmful
memes, detecting them amongst the disparate multi-modal online content is of crucial importance, which has
remained understudied. As an effort to characterize internet memes, we attempt to classify meme vs non-
meme, by leveraging techniques like Siamese network and canonical correlation analysis (CCA), towards
capturing the feature association between the visual and textual components of a meme. The experiments
are observed to yield impressive performance, and could further provide insights for applications like meme
content moderation over social media.
1 INTRODUCTION
A meme is an object depicting societal sentiment,
passed from one individual to another by imitation
or other types of interaction. Memes are available
in various forms including, but not limited to pho-
tographs, videos, or twitter posts that have signifi-
cant impact on social media communication (French,
2017; Suryawanshi et al., ). The most prominent
amongst different formats are memes with images
along-with textual content embedded in them. Due
to the multi-modal nature of the memes and the ob-
jective with which the image and text information is
combined, it is often challenging to understand the
content from either of the input component alone (He
et al., 2016). Therefore, it is important to process in-
put features from both modalities to recognize the in-
tended meaning of the message being communicated
in a meme. Unfortunately, the significant negative
impact resulting on social media due to the spread
of hate and offensive content could be attributed to a
large section of the memes being communicated with
different ill intentions, which is why detecting memes
and tagging them as per the level of harm they pose to
the social balance becomes crucial. But due the ambi-
guity that multimodal nature of the memes possess, it
becomes difficult to flag memes against non-memes,
and harmful against non-harmful ones.
Research community from the domains of com-
puter vision, natural language processing and multi-
media information retrieval, have started to take note
of the challenges involved when processing infor-
mation from internet memes and the pressing need
to address them (Bauckhage, 2011; Bordogna and
Pasi, 2012; Chew and Eysenbach, 2010; JafariAs-
bagh et al., 2014; V and Tolunay, 2018; Truong et al.,
2012; Tsur and Rappoport, 2015). Additional chal-
lenging dimension is added by the complex nature of
the semantics involved in the message being commu-
nicated within a meme, and thus would further com-
plicate downstream tasks like classification and con-
tent retrieval, which is relatively easier for uni-modal
data. Memes have become a prominent media, for
conveying sentiments related to various societal as-
pects. The potential impact that images can have on
the emotional state of an individual is well established
(Machajdik and Hanbury, 2010). But when it comes
to studying memes, the primary challenge that lies be-
fore us is detecting a meme amongst the internet con-
tent. Authors in (Perez-Martin et al., 2020) have at-
tempted the task of image classification as meme or
non-meme, using segmentation and concluded that if
an image contains text then it is a meme else it is a
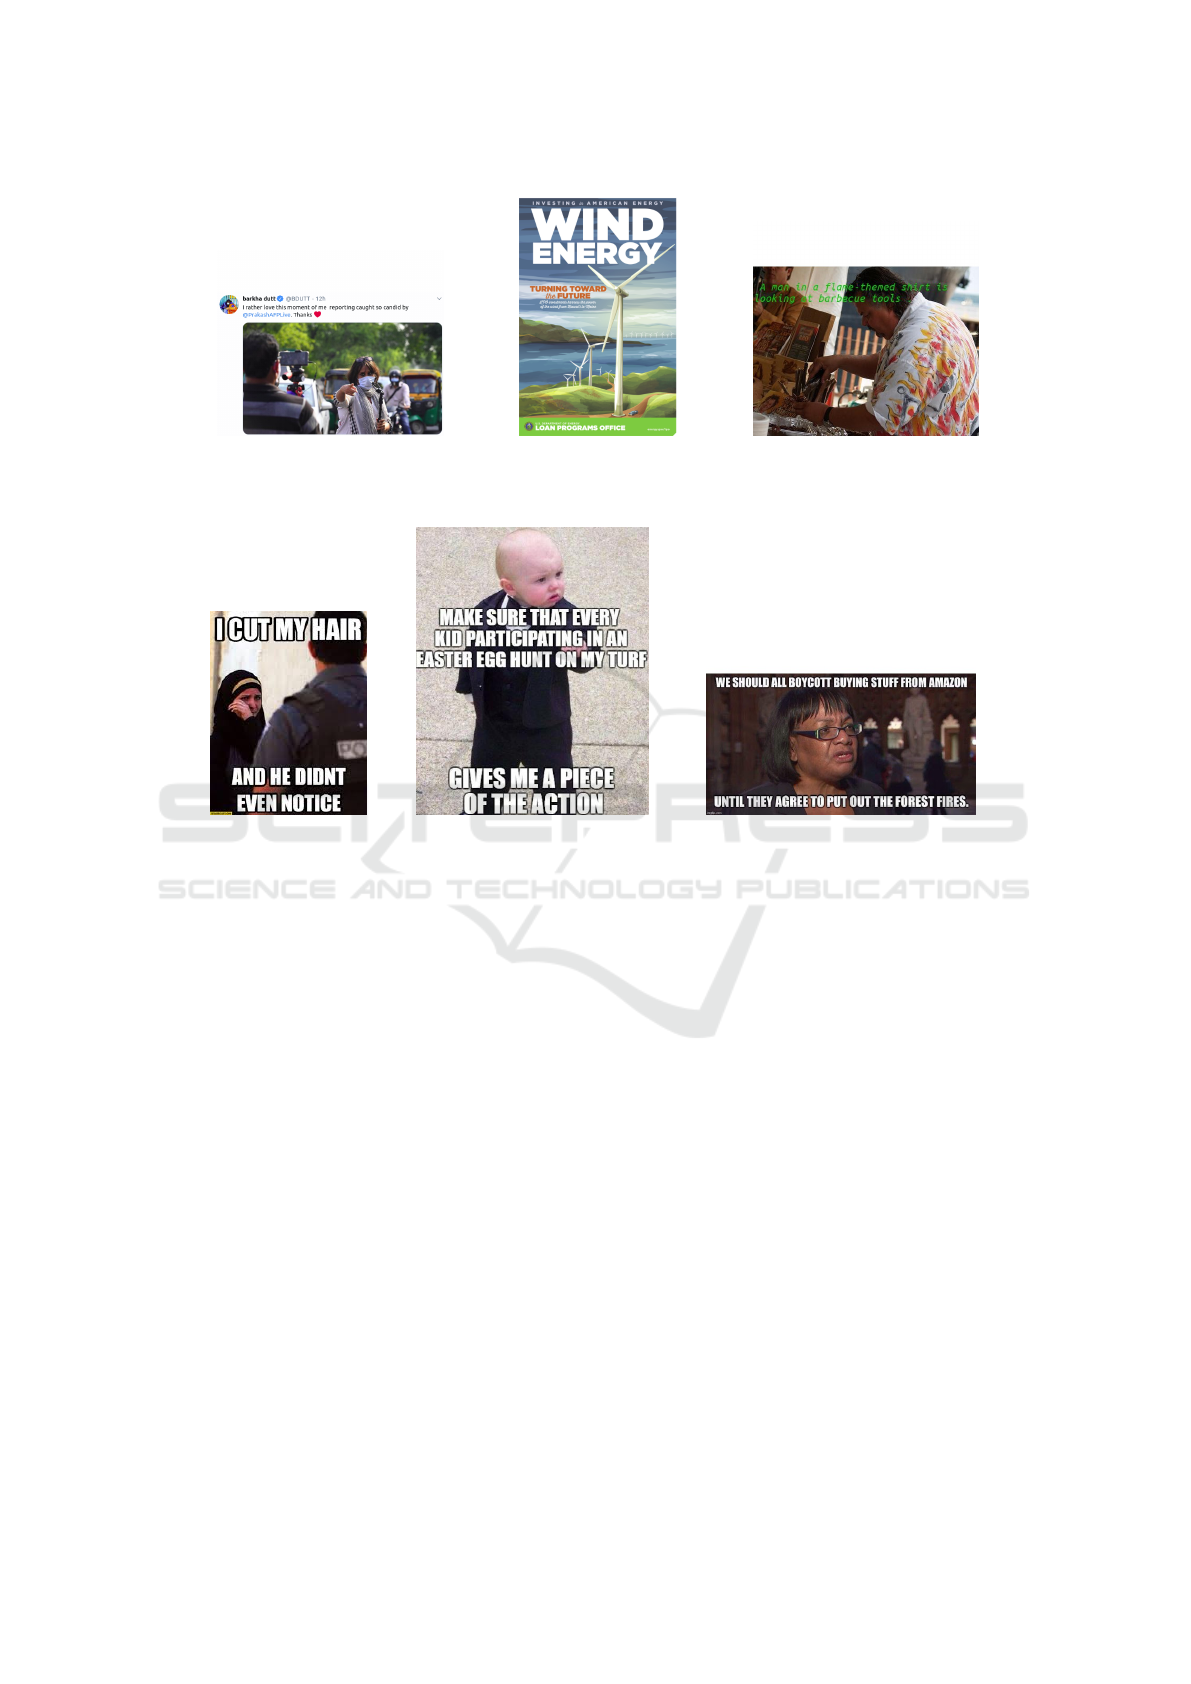
non-meme. Contrary to this, there are images which
have text embedded on them but are not a meme. Few
examples of such cases can be seen in Fig. 1, 2 and 3.
Sharma, C., Pulabaigari, V. and Das, A.
Meme vs. Non-meme Classification using Visuo-linguistic Association.
DOI: 10.5220/0010176303530360
In Proceedings of the 16th International Conference on Web Information Systems and Technologies (WEBIST 2020), pages 353-360
ISBN: 978-989-758-478-7
Copyright
c
2020 by SCITEPRESS – Science and Technology Publications, Lda. All rights reserved
353

On the other hand, Fig. 4, 5 and 6 are memes.
There has been plethora of research work on mul-
timodal data analysis and related tasks. One landmark
effort (Chen et al., 2015) entailed creation of a large
dataset called as MSCOCO with 2.5 million labelled
instances in 328K images, and concluded by present-
ing baseline systems for bounding box and segmenta-
tion detection. This work formed the basis for eval-
uating tasks like object detection (Qiao et al., 2020;
Zoph et al., 2020), image segmentation (Fu et al.,
2019) and image captioning (Vinyals et al., 2015; Xu
et al., 2015) using a data-set that is diverse, large and
of reliable quality. Tasks like scene description (Kr-
ishna et al., 2016; Young et al., 2014; Gurari et al.,
2020; Sidorov et al., 2020) have also witnessed sig-
nificant progress. Authors in (Krishna et al., 2016)
attempt to reformulate the approach to investigate the
task of associating visual objects from an image with
natural language descriptions, from the context of es-
tablishing the relational attributes amongst the im-
age entities.They setup a competitive data-set with
over 100K images with around 21 objects and asso-
ciated attributes and pairwise-relations. Also, visual
question answering is approached with techniques
like multi-modal compact bi-linear pooling, unified
image-text representation learning as part of (Li et al.,
2020; Teney et al., 2018; Fukui et al., 2016). Such ef-
forts have helped in bridging the gap for developing
technology that is more useful for relatively gener-
alised downstream tasks, that involve learning feature
representations involving semantic information and
sentiment analysis from multi-modal content. In this
paper, we attempt to leverage the information con-
tained within a meme, towards the task of classifying
them against a non-meme, by employing techniques
that model feature association in relevant ways.
The paper is organised as follows. The data set
collected and used for this study is described in Sec-
tion 2. Section 3 shows how different techniques are
used for extracting textual and visual features and a
brief description of Siamese Network and Canonical
Correlation Analysis used for analysing how a meme
is different from non-meme. Experimental setup and
Results are shown in Section 4 and 5 respectively. In
Section 6, the observations, analysis and the results
obtained are discussed in detail. Finally, we sum-
marise our work by highlighting the insights derived
along-with the further scope and open ended pointers
in section 7.
2 DATASET
The Meme dataset is created by downloading 20K im-
ages available in public domain, from different cate-
gories, such as Trump, Modi, Hillary, animated char-
acters, etc., using third-party tools and packages like
Fatkun image batch downloader and Tweepy. Addi-
tionally, flickr8k (Thomee et al., 2015) is also utilised
towards creating the desired dataset. In this section,
we describe preprocessing and annotation steps per-
formed towards creating the meme dataset.
2.1 Preprocessing
The images having been collected from disparate
sources, are of various types such as the ones hav-
ing only graphic content or the ones with embed-
ded text from various languages. Typically, major-
ity of the images collected from google and twitter
are found to have memes with both image and tex-
tual content. Thus to maintain the consistency of the
dataset towards establishing a baseline setup, we per-
formed the pre-processing of our the data, with the
following constraints:
• Creation of a part of non-meme data by embed-
ding the text provided corresponding to the given
images from Flickr8k (Thomee et al., 2015) and
Twitter. This renders the content which is simi-
lar to a typical meme in terms of composition, but
created without any intention of disseminating it
online as in case with memes, hence forms a con-
strastive sample for our data-set.
• Consideration of only those images which have
embedded text strictly in english language.
• Text is extracted from images using Google Vi-
sion API
1
. The extracted text not being com-
pletely accurate, were given to annotators to be
rectified if required.
2.2 Annotations
For getting the dataset annotated as meme or non-
meme, we rely on people to perform manual checks
for every picture present in our dataset. This is ac-
complished by utilizing annotations provided by the
workers on Amazon Mechanical Turk (AMT), which
is particularly suited for large scale data labeling.
As part of the annotation process, the workers are
requested to provide annotation only if they have the
prior knowledge of the background context of the im-
age (meme) content. Importance of such a require-
1
cloud.google.com/vision
WEBIST 2020 - 16th International Conference on Web Information Systems and Technologies
354
.
Figure 1: (Type-1: A Non-
Meme).Image which have text in the
upper half of the post.
Figure 2: (Type-2: Non-
Meme) Poster on wind project.
Figure 3: (Type-3: Non-Meme). A
image on which the text/tweet is im-
posed.
.
Figure 4: (A Meme) An offen-
sive Meme on woman dressed
in Hijab. It is difficult to la-
bel this as offensive until one
makes the correlation between
the biased emotion towards a
particular religion.
Figure 5: (A Meme) The
text implies something danger-
ous involving kids. But it is
the consideration of the back-
ground image in this meme
along with the text, that makes
it funny.
Figure 6: (A Meme) A sarcastic Meme on E-
commerce website Amazon, comparing it with the
Amazon fire incident.
ment can be had from the depictions given in Fig. 4
and 5.
Although, workers are told to make an apt judg-
ment for the response, we needed to set up a quality
control framework to ensure reliability of the agree-
ment on the feedback provided. With respect to this,
there are two issues to be considered. Firstly, error
rate for human judgement is significantly high and
not all workers adhere strictly to the guidelines. Sec-
ondly, workers don’t generally concur with one an-
other, particularly for cases where the characteristics
are relatively subtle in nature. To address these is-
sues, we have provided a common image to multiple
workers for annotation. A given picture is categorized
based upon the majority vote count received for spe-
cific category.
We have also ensured categorical balance in our
data-set, by maintaining equal data samples for both
the categories ie. 7K meme and 7K non meme( 2250
for Type1, 2250 for Type2 and 2500 for Type3 where
Type1, Type2 and Type3 corresponds to Fig. 1, 2 and
3 types of non-memes respectively).
3 APPROACH
As meme content is multimodal in nature, both the
textual and visual information are important to pre-
dict whether it is a meme or not a meme and the
associated emotion. For this, we have experimented
(where split of dataset, training:testing is 80:20) with
different feature extraction strategies stated below, to-
wards obtaining the visual and textual features, and
their combination as well.
3.1 Visual Features
To capture the visual information embedded in an im-
age, we first applied different image processing tech-
Meme vs. Non-meme Classification using Visuo-linguistic Association
355

niques to get the basic low-level descriptors such as
edges, corners, color distribution, texture analysis,
etc., which are then individually fed as inputs to SVM
to classify image as meme and nonmeme. We further
performed the task of meme vs. non-meme classifica-
tion using deep learning based approaches.
For detecting image features like edges and the
corners, we have applied HOG (Histogram of Ori-
ented Gradient) that preformed with a decent F1 score
of 0.80, while to get the color distribution in an image,
color histogram was used which resulted in a meagre
0.56 F1 score. For getting the texture related infor-
mation, LBP (Local Binary Pattern) histogram is used
which did not perform well as two samples can have
same texture irrespective of the class i.e., meme or
nonmeme and yielded a poor F1 score of 0.49. To
get the local features and leverage point-to-point fea-
ture matching concept, we have used SIFT (Scale In-
variant Feature Transform) that gives an F1 score of
0.75. Another technique, Haar that has a unique prop-
erty of removing the noise (blur regions and unim-
portant background content) considering the vertical,
horizontal and diagonal details, which outperformed
all other techniques with an F1 score of 0.91.
We further evaluate deep learning models to learn
relevant visual descriptors automatically from an im-
age. For this we have used different pre-trained
models like ResNet (He et al., 2015), Alex net
(Krizhevsky et al., 2012), inception net (Szegedy
et al., 2015), and VGG-16 (Simonyan and Zisserman,
2014) amongst which we get the best result of 0.94
F1 score, with VGG-16 based features. This moti-
vated us to consider it further towards evaluation of
the combined effect of visual and textual features.
3.2 Textual Features
Text plays an important role in building the context
for a given meme. For studying this, we have ex-
tracted textual features to get the semantic and con-
textual information, using different techniques men-
tioned below:
• N-gram: It is a continuous sequence of N-words
where N can be 1,2,3... depending upon the con-
text size to be considered for a given problem.
It can be used for various downstream tasks like
text classification, text summarizing, textual en-
tailment, predicting the next word of a sentence.
We applied N-gram (Bengio et al., 2003) with
varying N values from 2 to 10 in classifying image
as meme or non meme and got a consistent perfor-
mance with an F1 score of 0.51. Further analysis
shows that it is predicting either of the two class,
thus showing biased behaviour towards one class.
• Glove Embedding: A pre-trained model that
gives an output as a word embedding which pro-
vides the contextual meaning of a particular word
w.r.t other words in the corpus. It is used for text
classification problems, sentiment analysis, emo-
tion detection and other text related research prob-
lems. We applied Glove-100 (Pennington et al.,
2014) for our problem and got an accuracy of 0.90
which is far better than the one obtained using N-
gram based approach.
• Sentence Encoder: (Cer et al., 2018) provides a
sentence embedding instead of word embedding.
It is based on transformer encoder and gives an
output as sentence embedding which is created
considering the other sentences in the corpus. The
system is observed to perform best with an F1
score of 0.95.
As meme is all about the affect related content and
the context of the information, which is effectively
obtained from sentence encoder. Therefore, this was
used for extracting textual features.
Although analysis of image or text alone, per-
forms well, but the combination of image and text
provides higher order of semantic information, asso-
ciated with the input data. To get the insight of how
the combination of two modalities work and how the
memes are different from non-memes, we have used
two techniques which are described in the subsequent
sections.
3.3 Siamese Network
Siamese network (Koch et al., 2015) is primarily used
for finding the similarity between two input of same
modalities, either image or text to predict the fake or
real image/text. This follows initialization with ran-
dom weights for training purpose and update them ac-
cording to the two inputs. Authors in (Xu et al., 2019)
have shown the use of this technique for cross modal
information retrieval where they have used image and
text as two input vectors. This motivated us to ap-
ply this analogy on our data for classifying image as
meme or nonmeme. We have used the visual features
obtained from VGG-16 and textual features obtained
from sentence encoder followed by the dense layer to
project two vectors in same dimension space. We fur-
ther proceed with calculating the euclidean distance
between the two feature vector to learn the joint em-
bedding from two modalities. The architecture in Fig.
7 shows how the network is implemented.
WEBIST 2020 - 16th International Conference on Web Information Systems and Technologies
356
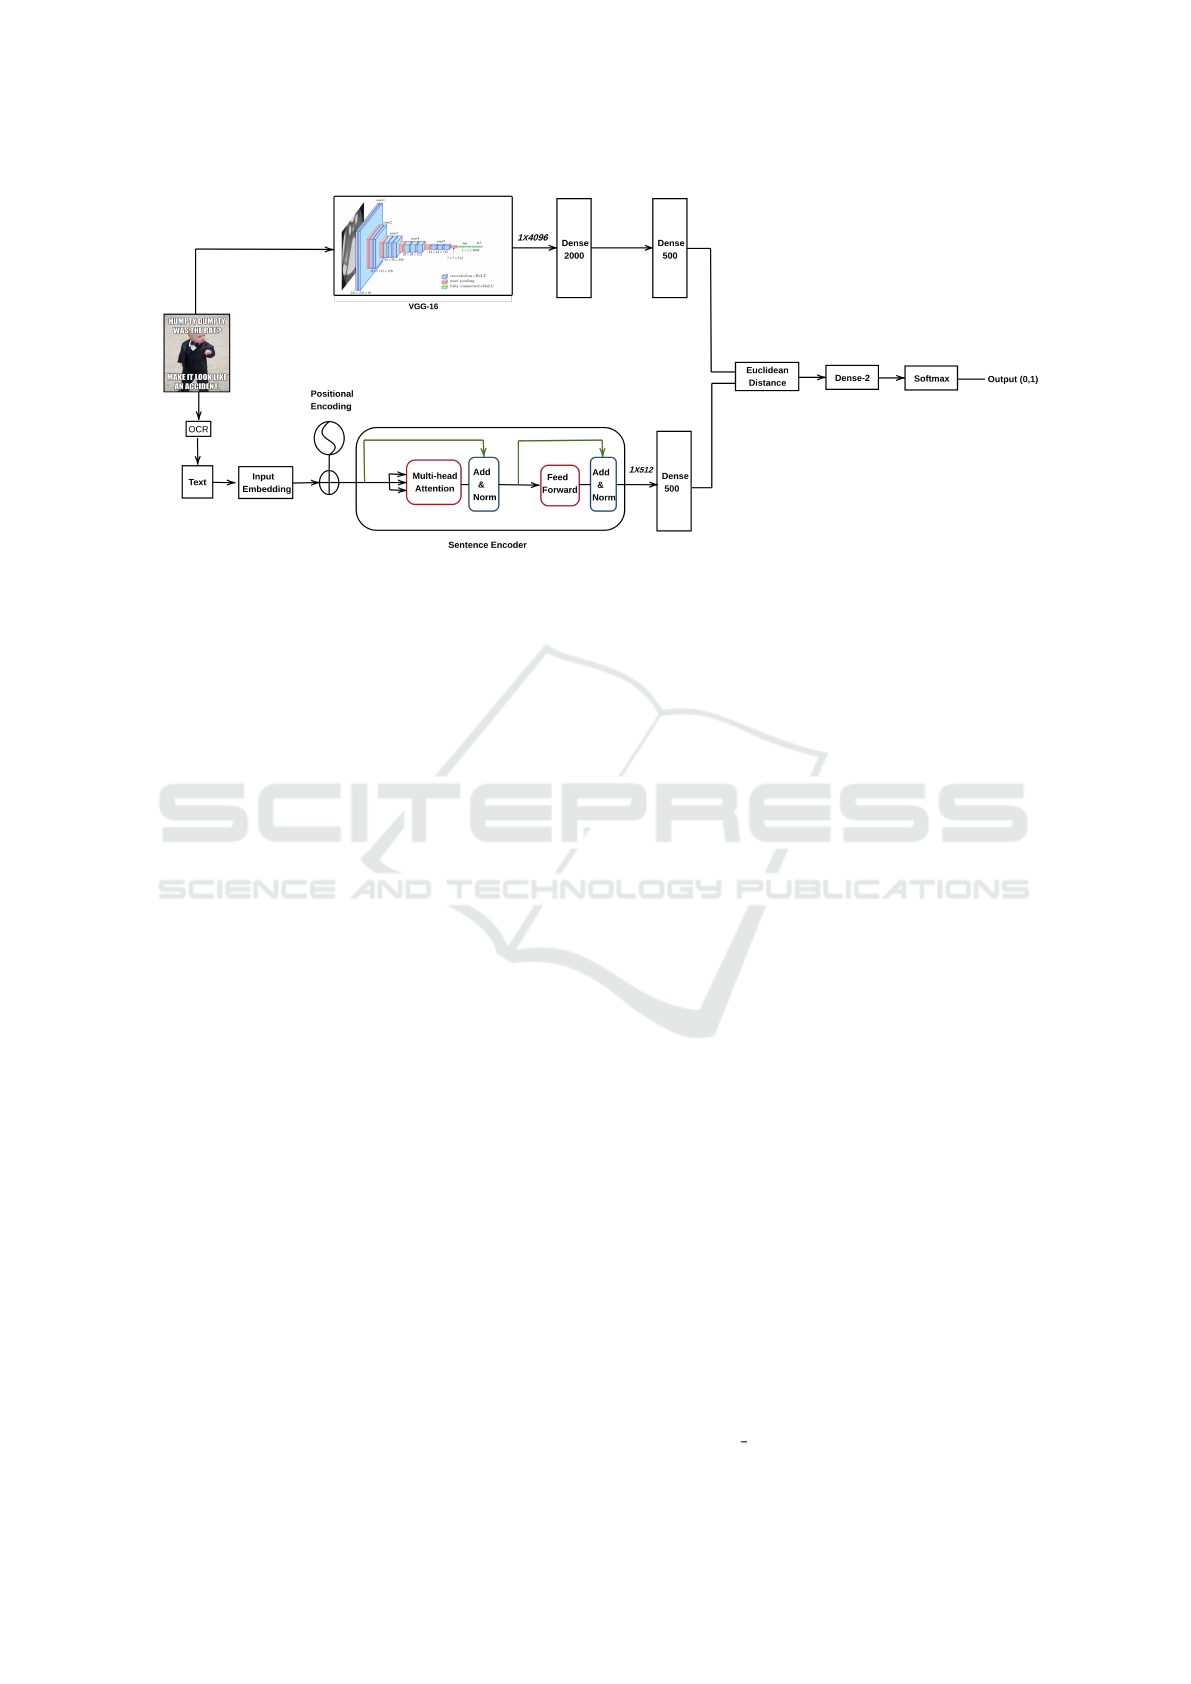
Figure 7: Siamese Network: A image is given as input to VGG-16 for visual features and text is extracted using OCR which
is provided as input to sentence encoder. A Dense 2000 followed by Dense 500 is applied on visual feature while a Dense 500
is applied on textual feature to project them in same dimension space to calculate the euclidean distance followed by Dense 2
and softmax function.
3.4 Canonical Correlation Analysis
(CCA)
In statistics, canonical-correlation analysis (CCA)
(Weenink, ), is a way of deducing information from
cross-covariance matrices. If we have two vectors P =
(P
1
, ..., P
n
) and Q = (Q
1
, ..., Q
m
) of random variables,
and there are correlations among the variables, then
canonical-correlation analysis will find linear combi-
nations of P and Q which have maximum correla-
tion with each other. It is a technique mostly used
in case of image captioning or generating text from
image and vice versa where there is a significant cor-
relation between visual and textual features. To un-
derstand the association between two modalities and
how this performs in classifying an image we have
applied CCA on our dataset. For better understanding
the concept, part of Fig. 8 shows how CCA works.
4 EXPERIMENTAL SETUP
This section explains the detailed experimental setup
for both the networks ie. Siamese and CCA ,where we
have used 80 % of the data for training and remaining
20 % for testing while 10% of training set is used for
validation. Textual and visual features are obtained
from the Sentence encoder and VGG-16 respectively.
4.1 Siamese Network
In the configuration of Siamese network, we have
used the 4096-dimensional visual feature vector and
512-dimensional textual feature vector which are
given as input to dense layer for projecting in common
dimension space each of 1X500. Further euclidean
distance is calculated between two vectors followed
by a dense layer of size 2. We have initialised net-
work with random weights with mean as 0.0, stan-
dard deviation as 0.01. Dense layer bias are initial-
ized with mean 0.5 and standard deviation as 0.01
(Koch et al., 2015). This implementation uses soft-
max activation and binary cross entropy loss functions
while the optimizer used is Adam with a learning rate
of 0.00006. We have performed the experiment with
different epoch configurations and system finally con-
verges at epoch # 70.
4.2 Canonical Correlation Analysis
(CCA)
To understand the performance of CCA for the task of
meme/non-meme classification, we have configured
our experiment as follows.
In the experiments, we have used visual features
of 4096 dimensions P extracted from VGG-16, and
textual features of 512 dimension were computed us-
ing sentence encoder Q. These two vectors (P, Q)
were projected to the same latent space by finding the
covariances of (P, P), (Q, Q) and cross-domain covari-
ances (P, Q). Eigenvalues were calculated, to get the
highly correlated canonical features of P and Q in la-
tent space.
To get the canonical correlated features from
CCA, we have used the sklearn package and config-
ured with the n component argument of cca function
Meme vs. Non-meme Classification using Visuo-linguistic Association
357
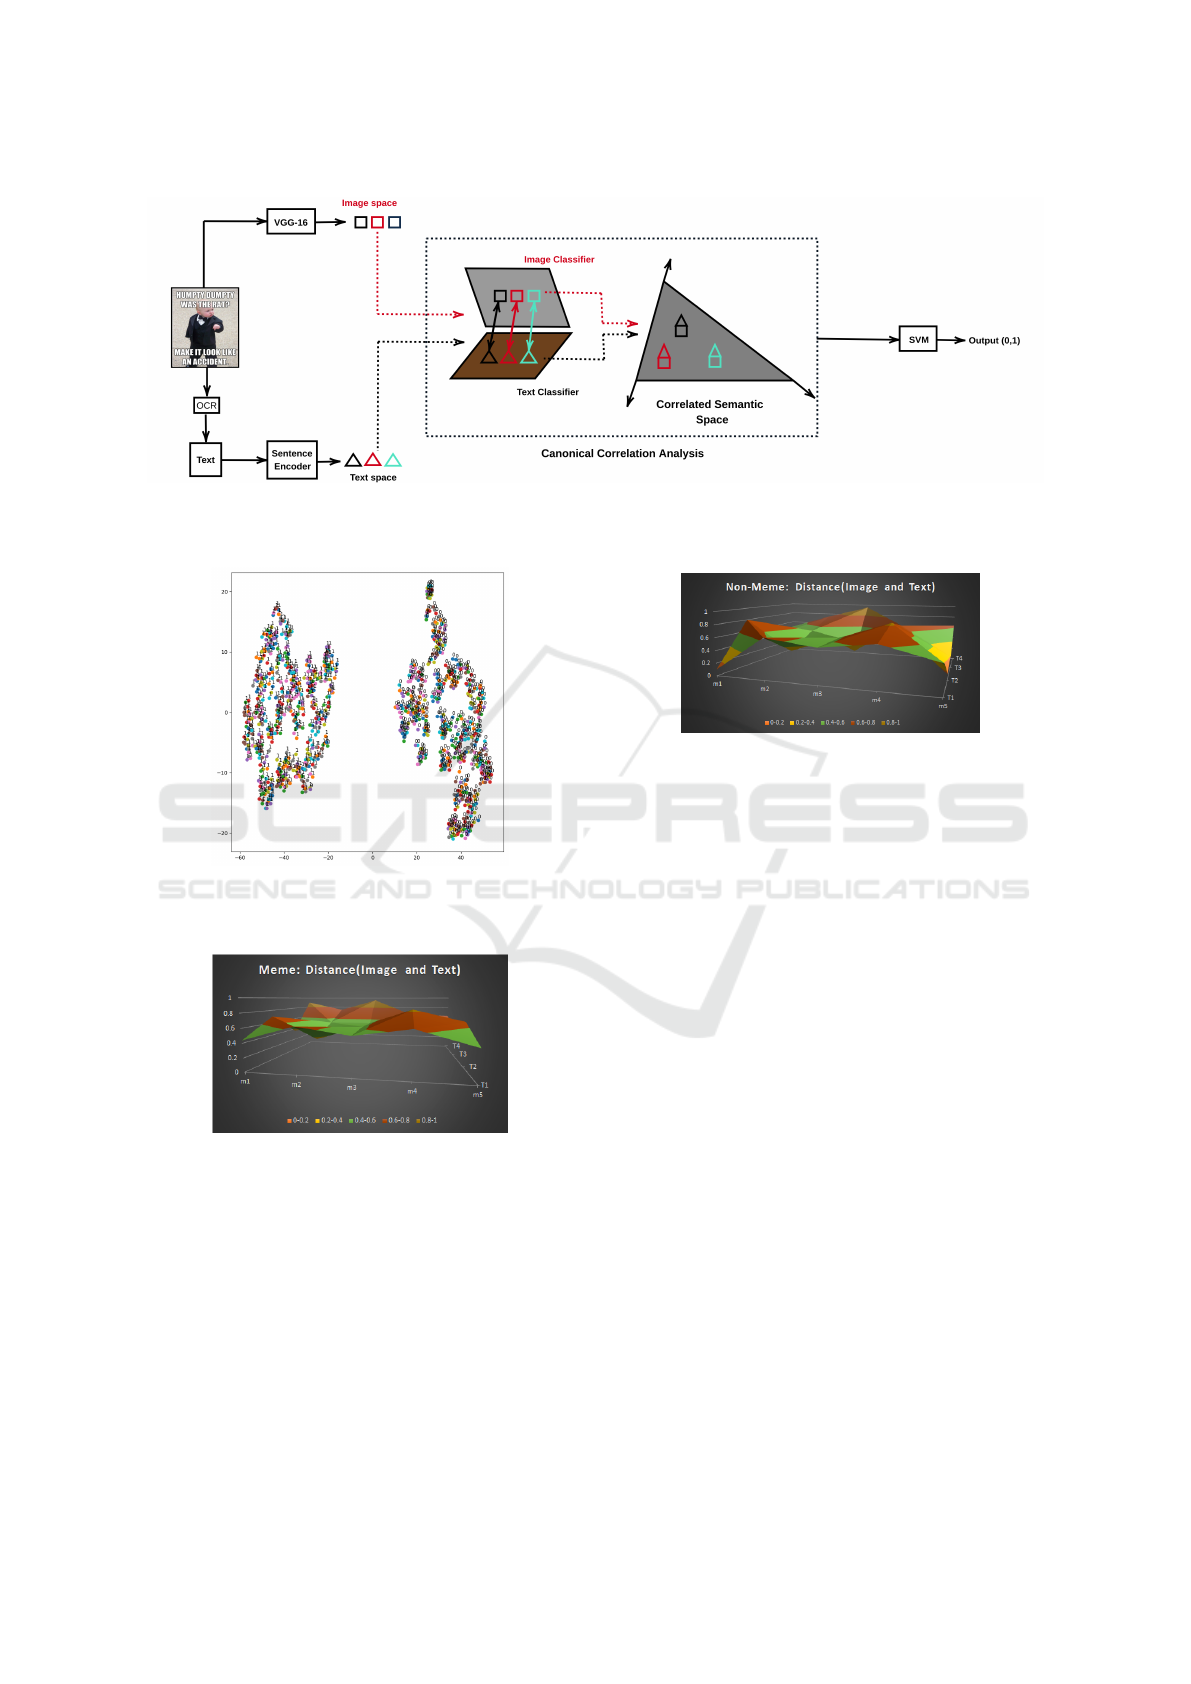
Figure 8: Canonical Correlation Analysis: Shows how CCA works on two feature vectors obtained from VGG-16 and
sentence encoder. The dotted box illustrates the work of CCA where highly correlated features are projected in a correlated
semantic space. Concatenated feature vector is then fed as input to SVM for classification.
Figure 9: TSNE: Shows clusters of meme and non meme
with no overlapping where 1 represents Meme and 0 repre-
sents Non-Meme.
Figure 10: Distance Analysis for MEME: A graph plotted
between textual features T , Visual features m, and distance
on Z-axis where majority of values lie in the range of 0.6-
0.8 that corresponds to significant large distance between m
and T .
in sklearn (sci, ) with n = 1, 2, 15, 30 and 100. The
components of P and Q are then concatenated and
given as input feature vector to SVM which is con-
figured with regularization parameter as 1.0, kernel
function as RBF (radial basis function) and the degree
of polynomial is considered as 3.
Figure 11: Distance Analysis for Non-MEME: A graph
plotted between textual features T , Visual features m, and
distance on Z-axis where maximum value lie in the range
of 0.0-0.6 that correspondence to less distance between m
and T .
5 RESULTS
Results obtained from the systems evaluated are ex-
plained below. A total of 5 experiments are conducted
for each configuration of the system and the average
of the F1-scores obtained is considered as final F1-
score.
In case of Siamese network, which calculates the
euclidean distance between two feature vectors, the
best performance obtained is F1 score of 0.98 with
70 epochs and standard deviation of 0.0054 obtained
from the consecutive 5 runs on random data split.
Fig. 10 and 11 show plots between the varying eu-
clidean distances on z − axis between textual features
on y−axis and visual features on x−axis of 5 samples
each of meme and non-meme respectively. It can be
observed in Fig. 10 that none of the values lie in the
range of 0-0.4 (0-0.2 (orange color), 0.2-0.4(yellow
color)). Therefore, it can be concluded that memes
have relatively more distance between the visual and
textual features in the vector space. Whereas, the
graph in Fig. 11 shows that the distance obtained be-
tween the two modalities in major cases lies in range
of 0-0.6 in case of non-meme category, which corre-
WEBIST 2020 - 16th International Conference on Web Information Systems and Technologies
358
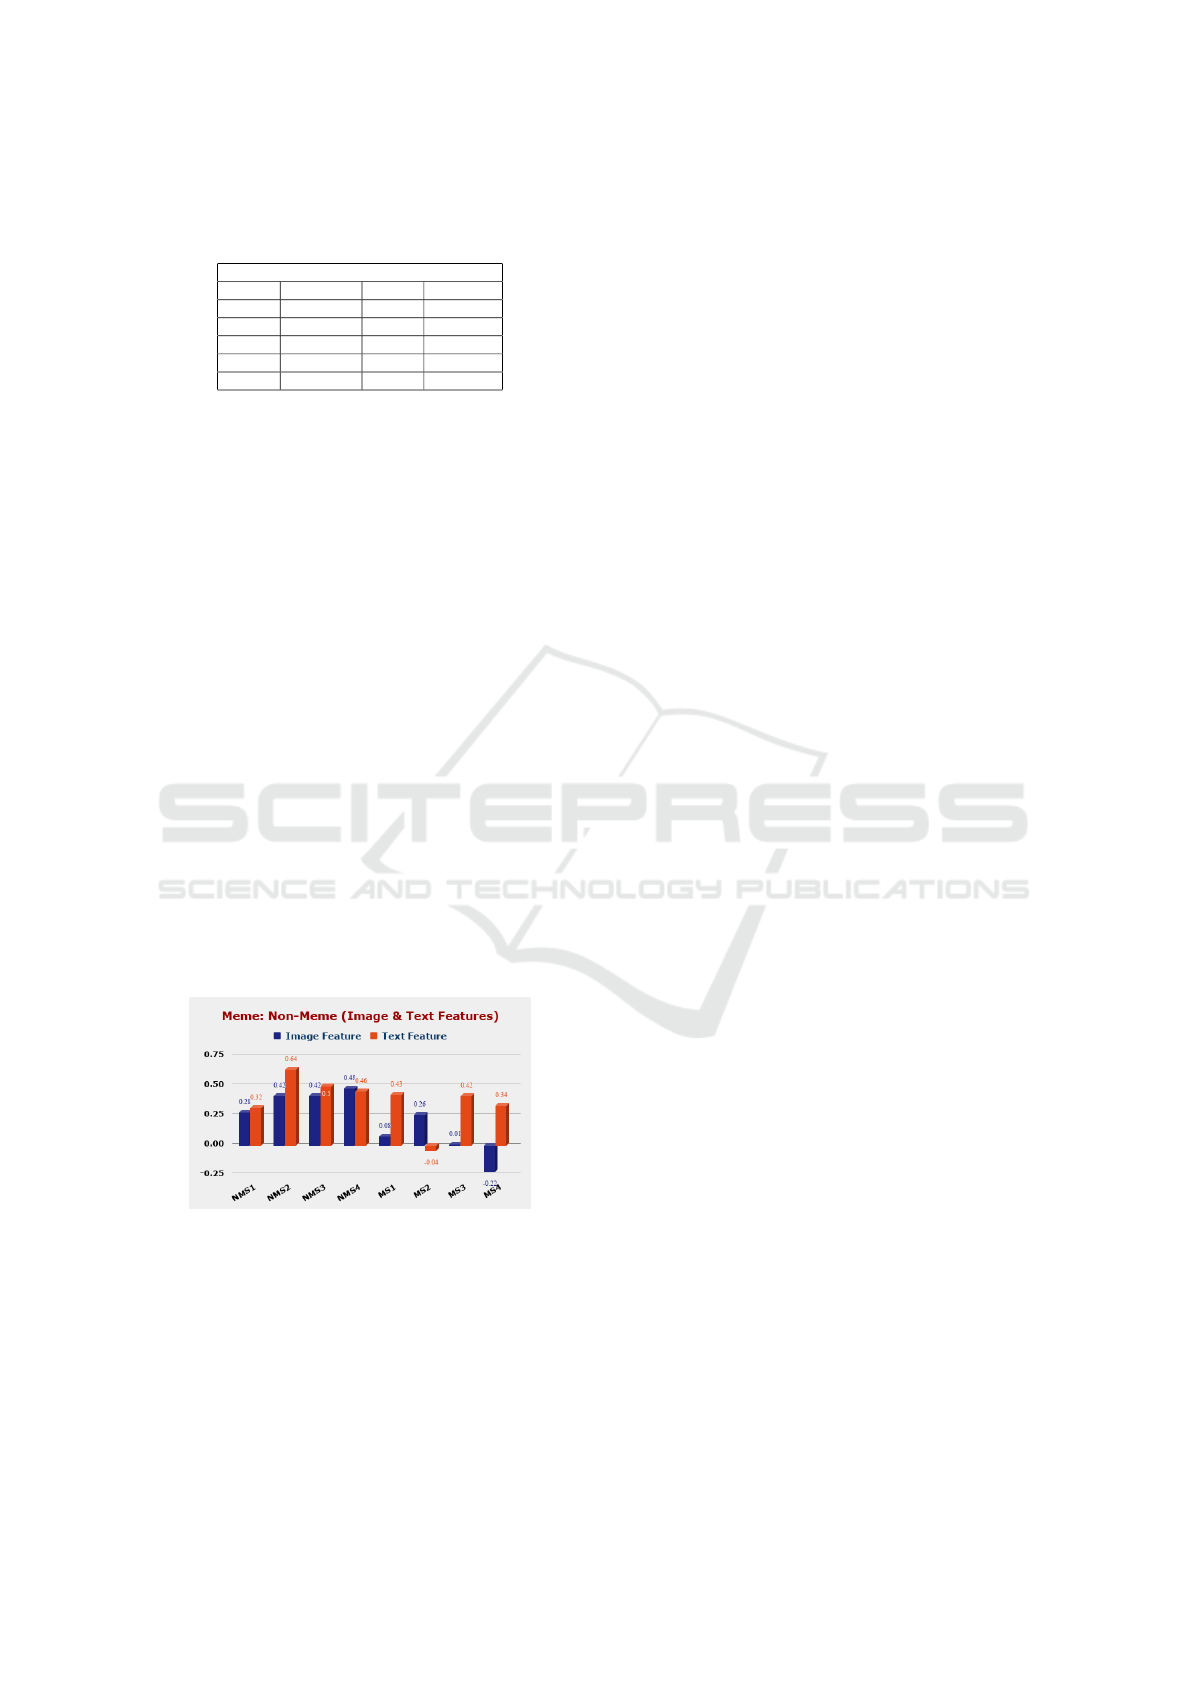
Table 1: Siamese Network Performance: Shows the preci-
son, recall and F1 score with different epochs. The network
converges on epoch 70.
Siamese Network
Epoch Precision Recall F1 Score
10 0.951 0.946 0.946
40 0.966 0.966 0.964
60 0.975 0.974 0.974
70 0.981 0.980 0.980
75 0.981 0.980 0.980
sponds to significant similarity in visual and textual
features.
The result obtained from CCA is observed to
be consistent with a precision, recall and F1 score
of 0.99, irrespective of number of components n =
1, 2, 15, 30, 100, that are evaluated. We have analysed
the performance of the system by varying the split of
dataset as training : testing = {65 : 35, 70 : 30, 75 : 25
and 80 : 20}, and there was no variation in the F1
scores. As can be observed in Fig. 12, plotted consid-
ering only 1 component of each modality, a high cor-
relation between image and text in case of non meme
is observed, unlike with the case of meme. For better
understanding the reason behind the system perfor-
mance, Fig. 9 shows a 2-component TSNE (van der
Maaten and Hinton, 2008) plot on CCA features of
4 component. It can be observed clearly that meme
and nonmeme forms two different clusters with no
overlapping because of the variations in the correlated
features of two classes ie. meme and non-meme ob-
served in Fig 12.
Results obtained from two different techniques
show, that there is high correlation and less distance
in visual and textual features in case of non-meme un-
like memes where the opposite holds true.
Figure 12: Graph: Shows a plot between image and text
CCA features of MEME and Non-MEME where X-axis
represents the samples and Y-axis represents the feature val-
ues. NMS1 and MS1 corresponds to Non-MEME sample 1
and Meme Sample 1 respectively.
6 DISCUSSION
In this paper, we have analysed how memes are dif-
ferent from a non meme by visualising the distance
and the correlation between textual and visual con-
tent. We have used two well known techniques CCA
and Siamese network, popular for the tasks like image
captioning and fake image detection. CCA provides
the highly correlated features between two modalities
ie. image and text, where results have shown that
it performed well due to the reason that textual and
visual features are highly correlated in case of non-
memes unlike meme. The other technique, Siamese
network shows that there is a large distance between
the two cross modal feature vectors in case of memes,
unlike with the case of non-memes.
7 CONCLUSION
This paper provides an analysis of how a meme is dif-
ferent from a regular image. Based on the analysis,
we have developed a system that classifies the web
image (image from the wild) as a meme or non-meme,
considering the visual and textual features. Euclidean
distance and correlated features between two modali-
ties are observed to enhance the classification perfor-
mance of the system.
At present, memes have become one of the most
prominent ways of expressing an individual’s opin-
ion towards societal issues. Further on identifying the
memes, this work can be extended as follows:
• Finding the opinions, such as sarcasm, offense,
motivation, etc., associated with the memes which
will lead to the removal of controversial memes.
• Understand the type of relationship that exists be-
tween text and image, which helps us generate or
suggest/recommend a meme to the user.
REFERENCES
sklearn.cross decomposition.cca.
Bauckhage, C. (2011). Insights into internet memes.
Bengio, Y., Ducharme, R., Vincent, P., and Janvin, C.
(2003). A neural probabilistic language model. JMLR,
3:1137–1155.
Bordogna, G. and Pasi, G. (2012). An approach to
identify ememes on the blogosphere. In 2012
IEEE/WIC/ACM, WI-IAT, volume 3, pages 137–141.
Cer, D., Yang, Y., Kong, S., Hua, N., Limtiaco, N., John,
R. S., Constant, N., Guajardo-Cespedes, M., Yuan, S.,
Tar, C., Sung, Y., Strope, B., and Kurzweil, R. (2018).
Universal sentence encoder. CoRR, abs/1803.11175.
Meme vs. Non-meme Classification using Visuo-linguistic Association
359

Chen, X., Fang, H., Lin, T., Vedantam, R., Gupta, S., Doll
´
ar,
P., and Zitnick, C. L. (2015). Microsoft COCO cap-
tions: Data collection and evaluation server. CoRR,
abs/1504.00325.
Chew, C. and Eysenbach, G. (2010). Pandemics in the age
of twitter: Content analysis of tweets during the 2009
h1n1 outbreak. PLOS ONE, 5(11):1–13.
French, J. H. (2017). Image-based memes as sentiment pre-
dictors. In i-Society, pages 80–85.
Fu, J., Liu, J., Tian, H., Li, Y., Bao, Y., Fang, Z., and Lu,
H. (2019). Dual attention network for scene segmen-
tation. In cvpr, pages 3146–3154.
Fukui, A., Park, D. H., Yang, D., Rohrbach, A., Darrell, T.,
and Rohrbach, M. (2016). Multimodal compact bilin-
ear pooling for visual question answering and visual
grounding. arXiv preprint arXiv:1606.01847.
Gurari, D., Zhao, Y., Zhang, M., and Bhattacharya, N.
(2020). Captioning images taken by people who are
blind.
He, K., Zhang, X., Ren, S., and Sun, J. (2015). Deep
residual learning for image recognition. CoRR,
abs/1512.03385.
He, S., Zheng, X., Wang, J., Chang, Z., Luo, Y., and Zeng,
D. (2016). Meme extraction and tracing in crisis
events. In ISI, pages 61–66.
JafariAsbagh, M., Ferrara, E., Varol, O., Menczer, F., and
Flammini, A. (2014). Clustering memes in social me-
dia streams. CoRR, abs/1411.0652.
Koch, G., Zemel, R., and Salakhutdinov, R. (2015).
Siamese neural networks for one-shot image recogni-
tion.
Krishna, R., Zhu, Y., Groth, O., Johnson, J., Hata, K.,
Kravitz, J., Chen, S., Kalantidis, Y., Li, L., Shamma,
D. A., Bernstein, M. S., and Li, F. (2016). Vi-
sual genome: Connecting language and vision us-
ing crowdsourced dense image annotations. CoRR,
abs/1602.07332.
Krizhevsky, A., Sutskever, I., and Hinton, G. E. (2012).
Imagenet classification with deep convolutional neu-
ral networks. In Pereira, F., Burges, C. J. C., Bottou,
L., and Weinberger, K. Q., editors, ANIPS 25, pages
1097–1105. Curran Associates, Inc.
Li, G., Duan, N., Fang, Y., Gong, M., Jiang, D., and Zhou,
M. (2020). Unicoder-vl: A universal encoder for vi-
sion and language by cross-modal pre-training. In
AAAI, pages 11336–11344.
Machajdik, J. and Hanbury, A. (2010). Affective image
classification using features inspired by psychology
and art theory. page 83–92, New York, NY, USA. As-
sociation for Computing Machinery.
Pennington, J., Socher, R., and Manning, C. (2014). Glove:
Global vectors for word representation. volume 14,
pages 1532–1543.
Perez-Martin, J., Bustos, B., and Saldana, M. (2020). Se-
mantic search of memes on twitter.
Qiao, S., Chen, L.-C., and Yuille, A. (2020). Detectors:
Detecting objects with recursive feature pyramid and
switchable atrous convolution.
Sidorov, O., Hu, R., Rohrbach, M., and Singh, A. (2020).
Textcaps: a dataset for image captioning with reading
comprehension.
Simonyan, K. and Zisserman, A. (2014). Very deep con-
volutional networks for large-scale image recognition.
arXiv 1409.1556.
Suryawanshi, S., Chakravarthi, B. R., Verma, P., Arcan, M.,
McCrae, J. P., and Buitelaar, P. A dataset for troll
classification of TamilMemes.
Szegedy, C., Vanhoucke, V., Ioffe, S., Shlens, J., and Wojna,
Z. (2015). Rethinking the inception architecture for
computer vision. CoRR, abs/1512.00567.
Teney, D., Anderson, P., He, X., and Van Den Hengel, A.
(2018). Tips and tricks for visual question answering:
Learnings from the 2017 challenge. In cvpr, pages
4223–4232.
Thomee, B., Shamma, D. A., Friedland, G., Elizalde, B.,
Ni, K., Poland, D., Borth, D., and Li, L. (2015). The
new data and new challenges in multimedia research.
CoRR, abs/1503.01817.
Truong, B. Q., Sun, A., and Bhowmick, S. S. (2012). Casis:
A system for concept-aware social image search. page
425–428. Association for Computing Machinery.
Tsur, O. and Rappoport, A. (2015). Don’t let me be #misun-
derstood: Linguistically motivated algorithm for pre-
dicting the popularity of textual memes.
V, A. L. P. and Tolunay, E. M. (2018). Dank learning: Gen-
erating memes using deep neural networks. CoRR,
abs/1806.04510.
van der Maaten, L. and Hinton, G. (2008). Visualizing data
using t-sne.
Vinyals, O., Toshev, A., Bengio, S., and Erhan, D. (2015).
Show and tell: A neural image caption generator. In
cvpr, pages 3156–3164.
Weenink, D. Canonical correlation analysis.
Xu, K., Ba, J., Kiros, R., Cho, K., Courville, A., Salakhudi-
nov, R., Zemel, R., and Bengio, Y. (2015). Show, at-
tend and tell: Neural image caption generation with
visual attention. In icml, pages 2048–2057.
Xu, Y., Yu, J., Guo, J., Hu, Y., and Tan, J. (2019).
Fine-grained label learning via siamese network for
cross-modal information retrieval. In Rodrigues, J.
M. F., Cardoso, P. J. S., Monteiro, J., Lam, R.,
Krzhizhanovskaya, V. V., Lees, M. H., Dongarra, J. J.,
and Sloot, P. M., editors, ICCS 2019. Springer Inter-
national Publishing.
Young, P., Lai, A., Hodosh, M., and Hockenmaier, J.
(2014). From image descriptions to visual denota-
tions: New similarity metrics for semantic inference
over event descriptions. ACL, 2:67–78.
Zoph, B., Ghiasi, G., Lin, T.-Y., Cui, Y., Liu, H., Cubuk,
E. D., and Le, Q. V. (2020). Rethinking pre-training
and self-training.
WEBIST 2020 - 16th International Conference on Web Information Systems and Technologies
360
