
Stock Trend Prediction using Financial Market News and BERT
Feng Wei and Uyen Trang Nguyen
Department of Electrical Engineering and Computer Science, York University, 4700 Keele Street, Toronto, Canada
Keywords:
Language Model, Information Extraction, Neural Networks, Natural Language Processing, Financial Market,
Stock Market, Financial and Business News.
Abstract:
Stock market trend prediction is an attractive research topic since successful predictions of the market’s future
movement could result in significant profits. Recent advances in language representation such as Generative
Pre-trained Transformer (GPT) and Bidirectional Encoder Representations from Transformers (BERT) models
have shown success in incorporating a pre-trained transformer language model and fine-tuning operations to
improve downstream natural language processing (NLP) systems. In this paper, we apply the popular BERT
model to leverage financial market news to predict stock price movements. Experimental results show that our
proposed methods are simple but very effective, which can significantly improve the stock prediction accuracy
on a standard financial database over the baseline system and existing work.
1 INTRODUCTION
Recently, a new language representation model
named Bidirectional Encoder Representations from
Transformers (BERT) (Devlin et al., 2019) has
achieved huge successes in many natural language
processing tasks such as natural language inference,
question answering, named entity recognition, etc. In
this paper, we apply BERT to financial data modeling
to predict stock price movements.
Traditionally neural networks have been used to
model stock prices as time series for forecasting pur-
poses, such as in (Kaastra and Boyd, 1996; Adya and
Collopy, 1998; Zhu et al., 2008). In these earlier
works, due to the limited training data and computing
power available back then, shallow neural networks
were used to model various types of features extracted
from stock price data sets, such as historical prices
and trading volumes to predict future stock yields and
market returns.
Lately, in the community of natural language pro-
cessing, many methods have been proposed to ex-
plore additional information (mainly online text data)
for stock forecasting, such as financial news (Ding
et al., 2016; Xie et al., 2013; Hu et al., 2018; Peng
and Jiang, 2016), Twitter sentiments (Si et al., 2014;
Nguyen and Shirai, 2015; Xu and Cohen, 2018) and
financial reports (Lee et al., 2014). For example, (Hu
et al., 2018) propose to mine news sequences di-
rectly from a text with hierarchical attention mech-
anisms for stock trend prediction, where they apply
the self-paced learning mechanism to imitate effec-
tive and efficient learning. (Xu and Cohen, 2018) pro-
pose a new deep generative model jointly exploiting
text and price signals. Their model introduces recur-
rent, continuous latent variables for better treatment
of stochasticity, and uses neural variational inference
to address the intractable posterior inference.
In this paper, we propose to use the recent BERT
model to leverage on-line financial news to predict fu-
ture stock movements. Figure 1 shows how events re-
ported in the news in August 2018 affected the stock
price movement of Tesla Inc. The proposed model
combines historical price information with financial
news for more accurate predictions. We conducted
experiments on real-world data sets and experimental
results show that representations of financial news us-
ing BERT are very effective. Its incorporated enhanc-
ing semantics representations can significantly im-
prove the prediction accuracy over a model that relies
only on historical price information. Our BERT-based
model also provides more accurate predictions than
previous works (Ding et al., 2016; Hu et al., 2018;
Peng and Jiang, 2016).
The remainder of the paper is organized as fol-
lows. Section 2 presents existing work in the field of
stock trend prediction. Section 3 describes our pro-
posed neural model based on financial market news
and BERT for the stock trend prediction task. Sec-
tion 4 discusses experimental results and compares
Wei, F. and Nguyen, U.
Stock Trend Prediction using Financial Market News and BERT.
DOI: 10.5220/0010172103250332
In Proceedings of the 12th International Joint Conference on Knowledge Discovery, Knowledge Engineering and Knowledge Management (IC3K 2020) - Volume 1: KDIR, pages 325-332
ISBN: 978-989-758-474-9
Copyright
c
2020 by SCITEPRESS – Science and Technology Publications, Lda. All rights reserved
325
+5%
-5%
Date
Aug 7, 2018
Musk tweets that he has “funding
secured” to take Tesla private.
Fluctuation
Aug 8, 2018
The Wall Street Journal reports SEC
inquiries into Musk tweet.
Aug 13, 2018
Musk reports interest from Saudi
investors.
Aug 17, 2018
Musk gives tearful interview
to The New York Times.
Figure 1: Example of news (CNN.com) influence of Tesla
Inc. Rectangular highlight amplitude of stock price move-
ments resulting from actual events.
the performance of our proposed model with that of
existing state-of-the-art systems. Finally, Section 5
sums up the paper with concluding remarks.
2 RELATED WORK
Stock market prediction has attracted a great deal
of attention across the fields of finance, computer
science, and other research communities. The lit-
erature on stock market prediction was initiated
by economists (Keynes, 1937). Subsequently, the
influential theory of Efficient Market Hypothesis
(EMH) (Fama, 1965) was established, which states
that the price of a security reflects all of the informa-
tion available and that everyone has a certain degree
of access to the information. EMH had a significant
impact on security investment and can serve as the
theoretical basis of event-based stock price movement
prediction.
Various studies have found that financial news can
dramatically affect the share price of a security. (Cut-
ler et al., 1988) was one of the first to investigate
the relationship between news coverage and stock
prices, since empirical text analysis technology has
been widely used across numerous disciplines. These
studies primarily use bags-of-words to represent fi-
nancial news documents. However, as (Xie et al.,
2013) point out, bag-of-words features are not the
best choice for predicting stock prices, and they ex-
plore a rich feature space that relies on frame semantic
parsing. (Wang and Hua, 2014) use the same features
as (Xie et al., 2013), but they perform non-parametric
kernel density estimation to smooth out the distribu-
tion of features. These can be regarded as extensions
to the bag-of-word method. The drawback of these
approaches is that they do not directly model events,
which have structured information.
There have been efforts to model events more
directly (Fung et al., 2002; Feldman et al., 2011).
Apart from events, to further model the long-term
Figure 2: The Architecture of our proposed stock price pre-
diction model.
dependency in time series, recurrent neural net-
works (RNN), especially Long Short-Term Memory
(LSTM) network, have also been employed for stock
price movement prediction (Akita et al., 2016; Gao,
2016).
(Peng and Jiang, 2016) proposed a system to
leverage financial news to predict stock movements
based on word embedding and deep learning tech-
niques. Our proposed model incorporates the rep-
resentation of financial news using BERT, yielding
higher accuracy than their model.
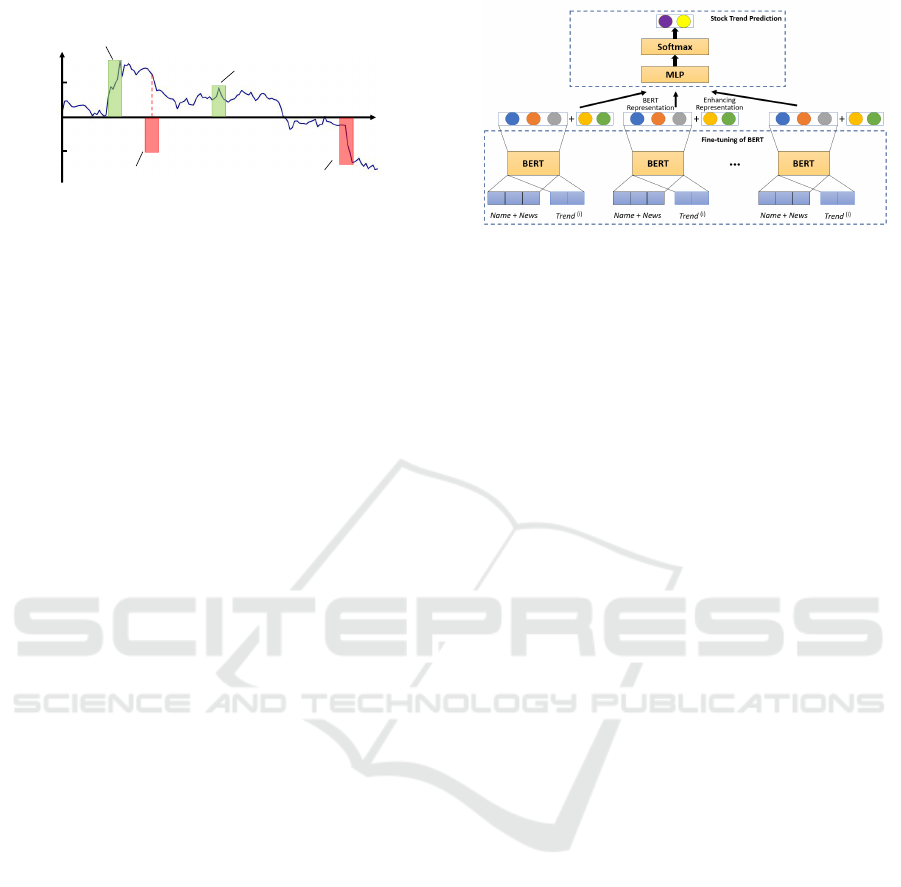
3 THE PROPOSED MODEL
The network architecture of our model is shown in
Figure 2. The input of BERT is comprised of two
parts as sentence A and sentence B, as shown in
Figure 3. In this work, sentence A is the concatena-
tion of the stock name with the related news in which
it appears, while sentence B is the stock trend based
on its next day’s closing price consulted from the Cen-
ter for Research in Security Prices (CRSP) financial
database (crs, 2018). We feed the inputs into BERT
and obtain the BERT representation, the fine-tuned
embedding of stock with related news and trends as
the BERT features. Specifically, the BERT represen-
tation is learned via BERT to indicate the relation of
sentence A and sentence B. In addition, we incor-
porate enhancing semantics (i.e., bag-of-keywords,
polarity score, and category presentation) from on-
line financial news that have been proved to be ef-
fective. Finally, we train a discriminative network to
predict the referred future trend (either up or down)
for stocks.
3.1 BERT Representation
Language model pre-training has shown to be very
effective for learning universal language representa-
tions by leveraging large amounts of unlabeled data.
KDIR 2020 - 12th International Conference on Knowledge Discovery and Information Retrieval
326

Figure 3: The network of fine-tuning BERT, based on news-
trend pairs from our financial news corpus.
Some of the most prominent models are ELMo (Pe-
ters et al., 2018), GPT (Radford et al., 2018), and
BERT (Devlin et al., 2019). Among these, ELMo
uses a bidirectional LSTM architecture, GPT exploits
a left-to-right transformer architecture, while BERT
uses the bidirectional transformer architecture.
There are two existing strategies for applying
pre-trained language models to downstream tasks:
feature-based and fine-tuning. The feature-based ap-
proach, such as ELMo, uses task-specific architec-
tures that include the pre-trained representations as
input features. The fine-tuning approaches, such
as GPT and BERT, introduce minimal task-specific
parameters and train on the downstream tasks by
jointly fine-tuning the pre-trained parameters and
task-specific parameters. This two-stage framework
has been demonstrated to be very effective in vari-
ous natural language processing tasks, such as reading
comprehension (Radford et al., 2018) and NLI (De-
vlin et al., 2019).
Inspired by (Devlin et al., 2019), it is essential to
embed stock news and trends into the same semantic
space constraining similar stock news and trends be-
ing close to each other, while dissimilar ones being
far away. In this work, as shown in Figure 3, we learn
the embeddings by fine-tuning the BERT model with
a large number of news-trend pairs from our financial
news corpus. We train our model by iterating over the
texts and mining the news-trend pairs in the corpus. In
the original BERT model, it utilizes the next sequence
prediction strategy where two sentences A and B are
fed into the model to predict whether B comes fol-
lowing A or not. This strategy drives the model to
learn better embeddings of both tokens and sentences
by mining their semantic information.
In this work, strategies are developed in construct-
ing the training data of our model to make the training
process more reasonable. For example, we are given a
sentence, “Musk, co-founder and chief executive offi-
cer of Tesla Motors, tweeted he had funding secured”.
Firstly, as shown in Figure 3, we retain the sentence
containing the stock name as the news information to
form part of sentence A. Secondly, when there are
multiple stock names in a sentence, the model will
be confused at which stock name we are interested
in. To address this problem, we set the sentence A
as the union of the stock name and the stock news
sentence it lies in, which both include the news in-
formation and emphasizes the stock name. Generally
speaking, we fine-tune the model by treating the stock
name and its news as sentence A while the trend as
sentence B, and they are separated with a special to-
ken [SEP]. The label of name-trend pair is based on
its next day’s closing price consulted from the Center
for Research in CRSP database. As for this example,
price-up is 1 while the price-down is 0, respectively.
Similar to pre-trained BERT, we predict the relation
of stock name and trend by adding a fully-connected
layer and softmax on top of the BERT representation
BERT
FT
, which is formulated as a classification task.
3.2 Enhancing Data from Historical
Prices
Given a stock s, let t and p
x
denote a target date and
the closing price of s on date x, respectively. Using
the CRSP database (crs, 2018), we retrieve the closing
prices of s on the five days before t to form a vector
p = (p
t−5
, p
t−4
, p
t−3
, p
t−2
, p
t−1
). To further enhance
the data, we compute the first and second order differ-
ences ∆p and ∆∆p as follows:
∆p = (p
t−4
, p
t−3
, p
t−2
, p
t−1
) −
(p
t−5
, p
t−4
, p
t−3
, p
t−2
)
∆∆p = (∆p
t−3
, ∆p
t−2
, ∆p
t−1
) −
(∆p
t−4
, ∆p
t−3
, ∆p
t−2
)
The enhancing data representation for each stock on a
particular date is given by R
D
= [p;∆p; ∆∆p].
3.3 Enhancing Semantics from
Financial News
We follow (Peng and Jiang, 2016) to preprocess the
text data from financial market news corpora. The
articles are first divided into sentences, and only the
sentences that contain at least a stock symbol, stock
name or company name are kept. Each of these sen-
tences is then labeled using the publication date of the
original article and the stock name. Such a sentence
may mention more than one stock, in which case the
sentence is labeled multiple times, once for each men-
tioned stock.
The sentences are then grouped based on the pub-
lication dates and the stock names to form the sam-
Stock Trend Prediction using Financial Market News and BERT
327

ples. A sample is defined as a list of sentences in ar-
ticles published on the same date and mentioning the
same stock/company. Using the closing price differ-
ence between the published date and its following day
(computed from the CRSP database), we label each
sample as “positive” (price going up the next day) or
“negative” (price going down the next day).
To retrieve enhancing semantics from financial
news for the samples, we apply the following meth-
ods (Peng and Jiang, 2016): constructing bag-of-
keywords, computing polarity scores, and category
representation.
Constructing Bags-of-Keywords. We first initial-
ized the vector representations for all words occurring
in the training set. Following [19], we manually se-
lected a small set of nine seed words, namely, ‘jump’,
‘gain’, ‘slump’, ‘drop’, ‘surge’, ‘rise’, ‘shrink’, ‘fall’,
‘plunge’, which are considered to be strong indica-
tions of stock price movements. We then performed
an iterative searching process to collect other useful
keywords. In each iteration, we compute the cosine
distance between each seed word and other words
occurring in the training set. The cosine distance
represents the similarity between two words in the
word vector space. For example, based on the pre-
calculated word vectors, we have found other words,
such as ‘tumble’, ‘slowdown’, ‘rebound’, ‘decline’,
and ‘climb’, which have similar meaning or closely
related to one or more seed words listed earlier. The
top ten most similar words were chosen and added
to the set of seed words at the end of each iteration.
The newly added seed words were used to repeat the
searching process to find another top ten most sim-
ilar words, increasing the size of the seed word set
with each iteration. The search process stopped when
the seed word set reached 1,000 words, including the
nine initial seed words. We found that the derived
keywords in the final set are very similar in meaning
as long as the seed words in the starting set are strong
indications of stock price movements. In the last step,
we generated a bag-of-keywords, a 1000-dimension
feature vector, for each sample after weighting a list
of selected keywords with term frequency–inverse
document frequency (tf-idf): R
K
∈ R
1000
.
Computing Polarity Scores. Polarity scores (Tur-
ney and Pantel, 2010) can be used to measure how ac-
curate each keyword indicates stock movements and
the extent of the accuracy. To compute the polarity
score, we first compute the point-wise mutual infor-
mation for each keyword w as follows (Turney and
Pantel, 2010):
PMI(w, pos) = log
freq(w, pos) × N
freq(w) × freq(pos)
, (1)
where freq(w, pos) denotes the frequency of the key-
word w occurring in all positive samples, N de-
notes the total number of samples in the training set,
freq(w) denotes the total number of keyword w occur-
ring in the whole training set and freq(pos) denotes
the total number of positive samples in the training
set. The polarity score for each keyword w can the be
calculated as follows:
PS(w) = PMI(w, pos) − PMI(w, neg). (2)
It should be noted that when a stock s is men-
tioned in a sentence, the keyword w in the sentence
may not indicate the price movement of s. For exam-
ple, given the sentence “Google lost half its market
share and slipped into third place behind Amazon and
Baidu in the second quarter of 2019”, which contains
the keyword ‘slip’. In this sentence, Google is asso-
ciated with keyword ‘slip’ while Amazon and Baidu
are not. If the sentence is used as a sample for Google,
the polarity score of ‘slip’ is computed as in Eq. (2).
On the other hand, if this sentence is used as a sam-
ple for Amazon or Baidu, the polarity score of ‘slip’
is flipped by multiplying by -1. To determine whether
a polarity score should be flipped or not, we used the
Stanford parser (Manning et al., 2014) to determine
whether the target stock is a/the subject of the key-
word. If it is, the polarity score stays as is. Otherwise,
the sign of the polarity score is flipped. Finally, after
being weighted with tf-idf, the polarity score repre-
sentation R
P
∈ R
1000
is obtained for each sample.
Category Representation. Certain types of market
events are frequently reported in the news such as a
company coming out with a new product, acquiring or
merging another company, etc. The stock price of the
company usually changes accordingly after the publi-
cation of such news. To take into account this factor in
our model, we use a list of categories (Peng and Jiang,
2016) that indicate such events or activities of pub-
licly listed companies, namely, new products, acqui-
sition, price rise, price drop, law suits, fiscal reports,
investment, bankrupt, government, analyst highlights.
For each category, we manually assigned a set of
words that are closely related to the category. For
example, ‘accumulated’, ‘allocate’, ‘funds’, ‘loaned’
can be seed words of the category investment to de-
scribe an investment. We used BERT WordPiece em-
bedding and an iterative search process as describe
above to expand the list of keywords associated with
each category. Words that have the cosine distances
closest to those in the current seed word sets are se-
lected until each category reaches 100 words.
KDIR 2020 - 12th International Conference on Knowledge Discovery and Information Retrieval
328

After the above process is completed, we counted
the total number of occurrences of each word in each
category. We then obtained a category representation
as R
C
= (logN
1
, logN
2
, ..., logN
c
), where N
c
is the to-
tal number of times the words in category c appear in
the sample. In the case where N
c
is zero, it is replaced
by a large negative number (e.g., -999.9) in this paper.
3.4 Predicting Price Movements of
Unmentioned Stocks
The prediction system described above are applicable
to only stocks that are reported in the media. How-
ever, there are many stocks that are rarely or never
mentioned in the news. (The New Stock Exchange
has 2,800 companies listed.) In this section we ex-
tend the above system to predict price movements of
stocks that are not mentioned in the news (unmen-
tioned stocks).
The extension includes the use of a stock correla-
tion graph illustrated in Figure 4. A stock correlation
graph is an undirected graph in which each vertex rep-
resents a stock and the edge between two vertices rep-
resents the correlation between the two stocks. The
edge is assigned a weight indicating the correlation
coefficient (ranging from -1 and 1) between the two
stocks. The higher the correlation coefficient, the
more impact one stock has on the other (and vice
versa) in terms of price movement. For example, very
often prices of stocks in the same sector, e.g., energy,
move in tandem with each other due to an event, e.g.,
an oil crash, resulting in a positive coefficient between
two stocks in the sector. To predict price movements
of unmentioned stocks on a particular day, the above
system is used to predict price movements of stocks
mentioned in the news. The obtained results are then
propagated in the graph using the correlation coef-
ficients to predict price movements of unmentioned
stocks.
To build the correlation graph, we selected the
top 5,000 stocks from the CRSP database (crs, 2018)
based on their market capitals and retrieved their clos-
ing prices for the seven years between January 1, 2012
and December 31, 2018. For every pair of stocks in
the set, we kept only the stock pairs that have an over-
lapped trading period of at least 252 days, the number
of trading days in one year. (Stocks can be added to or
removed from the stock market.) The minimum dura-
tion of one year ensures the reliability of the derived
correlation coefficient. During the process of con-
structing the graph, we discarded the edges whose ab-
solute correlation values are smaller than 0.8 as they
were deemed unreliable. In future work, we will as-
sess how this threshold of correlation coefficient af-
Figure 4: Illustration of a part of correlation graph which
contains eight stocks. The symbol in the circle are the ticker
name of the stock. The value along the edges are the corre-
lation score of the two stocks connected by that edge.
fects the prediction performance.
To predict price movements of the unmentioned
stocks, we first run our BERT model to obtain pre-
diction results from the mentioned stocks. The results
are then used to construct a vector x ∈ R
5000
. Each of
the 5,000 dimensions is associated with a stock and
has two values output by our BERT model indicat-
ing the probability of price going up and down re-
spectively. If a sample is identified as ‘price-down’,
its probability is multiplied by -1 to be distinguished
from a ‘price-up’ probability. For the unmentioned
stocks, the two probability values are set to zero.
Let A ∈ R
5000×5000
be a symmetric matrix that rep-
resents the correlation graph. The propagation pro-
cess through the graph can be implemented as a ma-
trix multiplication as follows: x
0
= Ax.
The graph propagation is repeated multiple time
until x
0
converges, which contains predicted price
movements of the unmentioned stocks.
4 EXPERIMENTS AND ANALYSIS
4.1 Data Collection
The financial news data used in this paper, which con-
tains 212,347 articles from CNN and 238,265 from
CNBC, was collected. The news articles were pub-
lished in the period from January 2012 to December
2018. For each news article, the publication times-
tamp, title, and content were extracted. Then, each of
the collected news to a specific stock was correlated,
if the news mentioned the name of the stock in the title
or content. Finally, the news without any correlation
to stocks was filtered out.
The historical stock security data are obtained
from the CRSP database, which is published by the
Chicago Business School and is widely used in finan-
cial modeling. The CRSP database is properly ad-
Stock Trend Prediction using Financial Market News and BERT
329

justed for all special price events such as stock splits
as well as dividend yields. We only use the security
data from 2012 to 2018 to match the period of finan-
cial news. For the following experiments, we split the
dataset into a training set (85%) from January 2012
to May 2016, and a test set (15%) from June 2016 to
December 2018. Then we further randomly sample a
validation set from the training set with 10% size of it,
to optimize the hyper-parameters and choose the best
epoch.
4.2 Stock Trend Prediction using BERT
and Enhancing Semantics
The model in this work has two networks to train, in-
cluding the fine-tuning of BERT and the stock trend
prediction module, we will detail the parameter set-
ting as follows.
In the first set of experiments, we use our BERT
model to predict stock trends based on a variety of
enhancing semantics, namely bag-of-keywords (R
K
),
polarity score (R
P
) and category presentation (R
C
).
Considering the memory consumption of GPU, we
exploit the uncased BERT
BASE
model for fine-tuning,
where the model consists of 12 layers, with 768 hid-
den units and 12 heads. Therefore, the BERT rep-
resentation, BERT
FT
, we obtained is of length 768.
As for fine-tuning over our financial news corpus,
all hyper-parameters are tuned on the development
set. The maximum length, dropout probability and
batch size we used are 50, 0.1 and 128, respectively.
AdamW (Loshchilov and Hutter, 2018) is applied for
optimization with an initial learning rate of 5e-5. The
maximum number of epochs is selected from [20, 30,
40].
Specifically, we use the enhancing data represen-
tation (R
D
) and BERT
FT
to create the baseline and
various enhancing semantics derived from the finan-
cial news are added on top of it. We measure the
final performance by calculating the accuracy and
Matthews Correlation Coefficient (MCC) on the test
set. As shown in Table 1, the enhancing semantics
derived from financial news can significantly improve
the prediction accuracy and MCC score. According
to the results in the table, baseline model incorpo-
rating R
P
yields higher accuracy than R
K
and R
C
.
Moreover, baseline model incorporating R
P
and R
P
yields higher accuracy than the other two combina-
tions. Additionally, we have obtained the best perfor-
mance, i.e., an accuracy score of 58.4% and an MCC
score of 0.33, by using all the enhancing represen-
tations discussed in Sections 3.2 and 3.3. We have
also applied the event embeddings (Ding et al., 2016)
and news embeddings (Hu et al., 2018) to the baseline
Table 1: Performance comparison of stock trend prediction
on the test set.
System Accuracy (%) MCC
(Peng and Jiang, 2016) (word embedding) 55.5 0.25
(Ding et al., 2016) (event embedding) 56.0 0.28
(Hu et al., 2018) (news embedding) 55.8 0.26
R
D
52.3 0.18
Baseline = R
D
+ BERT
FT
54.9 0.22
Baseline + R
K
55.2 0.24
Baseline + R
C
55.1 0.23
Baseline + R
P
55.8 0.24
Baseline + R
K
+ R
C
56.0 0.26
Baseline + R
K
+ R
P
57.7 0.28
Baseline + R
C
+ R
P
55.9 0.25
Baseline + R
K
+ R
C
+ R
P
58.4 0.33
Table 2: The results of 2-by-2 contingency table from a ran-
dom classifier and our baseline model (R
D
+ BERT
FT
).
Baseline
Correct Incorrect
Random
Guess
Correct 1501 942
Incorrect 1114 1443
Table 3: Results of the McNemar test of our BERT models.
System Accuracy (%) χ
2
p-value
Random Guess 49.8 n/a n/a
(Ding et al., 2016) (event embedding) 56.0 69.05 9.60 × 10
−17
(Hu et al., 2018) (news embedding) 55.8 50.49 1.20 × 10
−12
R
D
52.3 14.39 0.00015
Baseline = R
D
+ BERT
FT
54.9 23.48 1.26 ×10
−6
Baseline + R
K
55.2 28.67 8.58 ×10
−8
Baseline + R
C
55.1 26.52 2.61 × 10
−7
Baseline + R
P
55.8 34.53 4.20 × 10
−9
Baseline + R
K
+ R
C
56.0 42.55 6.89 × 10
−11
Baseline + R
K
+ R
P
57.7 66.31 3.85 × 10
−16
Baseline + R
C
+ R
P
55.9 36.72 1.36 × 10
−9
Baseline + R
K
+ R
C
+ R
P
58.4 74.42 6.32 × 10
−18
and the results are also listed in Table 1, which shows
that our enhancing semantic representations produce
better performance in predicting a pool of individual
stock price trends.
Furthermore, the accuracy of our best model
(Baseline + R
K
+ R
C
+ R
P
) is much higher than
(Peng and Jiang, 2016) (i.e., 2.9%, 58.4% vs 55.5%).
It confirms the effectiveness of representations of fi-
nancial news using BERT.
To verify the significance of different models by
comparing the result of different enhancing represen-
tation combinations with the result of random clas-
sifier (the results are generated by random guess), we
applied the McNemar test (McNemar, 1947), which is
a statistical experiment used on paired nominal data.
McNemar’s test is applied on a 2-by-2 contingency
table, which tabulates the outcomes of two tests on a
KDIR 2020 - 12th International Conference on Knowledge Discovery and Information Retrieval
330

sample of n subjects. In a McNemar test, a null hy-
pothesis is defined such that the marginal probabilities
in the contingency table are the same, whereas an al-
ternative hypothesis is defined such that the marginal
probabilities are not the same.
In particular, we define the null hypothesis as fol-
lows: the predictive performances of our BERT mod-
els with different enhancing representation combina-
tions would be the same as the random classifier. For
the results of each enhancing representation combi-
nation listed in Table 1, we created a 2-by-2 contin-
gency table with the results generated by the random
classifier and our baseline model with solely enhanc-
ing data representation (R
D
), as shown in Table 2.
Each cell in Table 2 shows the matched result counts
of these two classifiers. For instance, the top-left cell
shows the number of results predicted correctly by
both of the random classifier and our baseline model
with solely enhancing data representation (R
D
). The
McNemar test statistic χ
2
value computed using this
table is 14.39 which has a p-value 0.00015. After
constructing such a 2-by-2 contingency table for each
of our BERT models with different enhancing repre-
sentation combinations, we compute their χ
2
and p-
value, results are shown in Table 3. The p-values are
shown in Table 3 are significantly lower than the typ-
ical α value of 0.001, which provides strong evidence
to reject the null hypothesis of a random guess.
4.3 Prediction Results for Unmentioned
Stocks
We use our best model (Baseline + R
K
+ R
C
+ R
P
) to
conduct the experiment in this section. We group all
outputs from that model based on the dates of all sam-
ples on the test set. For each date, we create a vector x
based on the model prediction results for all observed
stocks and zeros for all unmentioned stocks, as de-
scribed in section 3.4. Then, the vector is propagated
through the correlation graph to generate another set
of stock movement prediction. During the propaga-
tion, we compute the results by multiplying the vec-
tor with the correlation matrix. After the propagation
converges, we may apply a threshold (τ ∈ [0, 1]) on the
propagated vector to prune all low-confidence predic-
tions. For example, as shown in Figure 4, we only
keep correlation connections when correlation score
above τ. The prediction of all unmentioned stocks
is compared with the actual stock movement on the
next day. Experimental results are shown in Figure 5,
where the left curve shows the prediction accuracy
and the right curve shows the percentage of unmen-
tioned stocks predicted out of the 5000 stocks per day
under various pruning thresholds. For example, using
a large threshold 0.9, we can predict with an accuracy
of 58.4% the price movements of 441 unmentioned
stocks per day, in addition to 112 reported stocks per
day on the test set.
0.5 0.6 0.7 0.8 0.9
0.44
0.46
0.48
0.50
0.52
0.54
0.56
0.58
0.60
Accuracy
Threshold
Accuracy
(a) Accuracy
0.5 0.6 0.7 0.8 0.9
0.06
0.12
0.18
0.24
0.30
0.36
Percentage of unmentioned prediction
Threshold
Percentage of unmentioned prediction
(b) Percentage of unmentioned stocks predicted
Figure 5: Predicting unmentioned stocks via correlation.
5 CONCLUSION
In this paper, we propose a model using the most re-
cent state-of-the-art language model BERT to predict
moving directions of future stock prices. Moreover,
we incorporate a correlation matrix which makes use
of the underlying relationships among stocks to ex-
pand our predictive results. Experimental results
show that our proposed methods are simple but very
effective, which can significantly improve the stock
prediction accuracy on a standard financial database
over the baseline system and existing work.
It should be noted that being able to predict the
moving direction of stock prices does not necessar-
ily lead to beating the market consistently. First, a
certain type of trading strategy is required to be com-
bined with the predictive results to make meaningful
profit. Second, the amount of price change is another
factor that should be used to compute the return on
investment before making trade decisions. Therefore,
the developments of a set of trading strategies and a
system that predicts the return on investment are po-
tential future research topics.
Stock Trend Prediction using Financial Market News and BERT
331

REFERENCES
(2018). Crsp data description guide for the crsp us stock
database and crsp us indices database. Chicago Booth,
Center for Research in Security Prices, The University
of Chicago Graduate School of Business.
Adya, M. and Collopy, F. (1998). How effective are neural
networks at forecasting and prediction? a review and
evaluation. Journal of Forecasting, 17(5-6):481–495.
Akita, R., Yoshihara, A., Matsubara, T., and Uehara, K.
(2016). Deep learning for stock prediction using nu-
merical and textual information. In 2016 IEEE/ACIS
15th International Conference on Computer and In-
formation Science (ICIS), pages 1–6. IEEE.
Cutler, D. M., Poterba, J. M., and Summers, L. H. (1988).
What moves stock prices?
Devlin, J., Chang, M.-W., Lee, K., and Toutanova, K.
(2019). Bert: Pre-training of deep bidirectional trans-
formers for language understanding. In Proceedings
of the 2019 Conference of the North American Chap-
ter of the Association for Computational Linguistics:
Human Language Technologies, Volume 1 (Long and
Short Papers), pages 4171–4186.
Ding, X., Zhang, Y., Liu, T., and Duan, J. (2016).
Knowledge-driven event embedding for stock predic-
tion. In Proceedings of COLING 2016, the 26th Inter-
national Conference on Computational Linguistics:
Technical Papers, pages 2133–2142.
Fama, E. F. (1965). The behavior of stock-market prices.
The Journal of Business, 38(1):34–105.
Feldman, R., Rosenfeld, B., Bar-Haim, R., and Fresko, M.
(2011). The stock sonar-sentiment analysis of stocks
based on a hybrid approach. In Twenty-Third IAAI
Conference.
Fung, G. P. C., Yu, J. X., and Lam, W. (2002). News
sensitive stock trend prediction. In Pacific-Asia Con-
ference on Knowledge Discovery and Data Mining,
pages 481–493. Springer.
Gao, Q. (2016). Stock market forecasting using recur-
rent neural network. Master’s thesis, University of
Missouri–Columbia.
Hu, Z., Liu, W., Bian, J., Liu, X., and Liu, T.-Y. (2018).
Listening to chaotic whispers: A deep learning frame-
work for news-oriented stock trend prediction. In Pro-
ceedings of the Eleventh ACM International Confer-
ence on Web Search and Data Mining, pages 261–269.
ACM.
Kaastra, I. and Boyd, M. (1996). Designing a neural net-
work for forecasting financial and economic time se-
ries. Neurocomputing, 10(3):215–236.
Keynes, J. M. (1937). The general theory of employment.
The Quarterly Journal of Economics, 51(2):209–223.
Lee, H., Surdeanu, M., MacCartney, B., and Jurafsky, D.
(2014). On the importance of text analysis for stock
price prediction. In LREC, pages 1170–1175.
Loshchilov, I. and Hutter, F. (2018). Decoupled weight de-
cay regularization.
Manning, C. D., Surdeanu, M., Bauer, J., Finkel, J. R.,
Bethard, S., and McClosky, D. (2014). The stanford
corenlp natural language processing toolkit. In Pro-
ceedings of 52nd annual meeting of the association
for computational linguistics: system demonstrations,
pages 55–60.
McNemar, Q. (1947). Note on the sampling error of the
difference between correlated proportions or percent-
ages. Psychometrika, 12(2):153–157.
Nguyen, T. H. and Shirai, K. (2015). Topic modeling based
sentiment analysis on social media for stock market
prediction. In Proceedings of the 53rd Annual Meet-
ing of the Association for Computational Linguistics
and the 7th International Joint Conference on Natural
Language Processing (Volume 1: Long Papers), pages
1354–1364.
Peng, Y. and Jiang, H. (2016). Leverage financial news
to predict stock price movements using word embed-
dings and deep neural networks. In Proceedings of
the 2016 Conference of the North American Chapter
of the Association for Computational Linguistics: Hu-
man Language Technologies, pages 374–379.
Peters, M. E., Neumann, M., Iyyer, M., Gardner, M., Clark,
C., Lee, K., and Zettlemoyer, L. (2018). Deep con-
textualized word representations. In Proceedings of
NAACL-HLT, pages 2227–2237.
Radford, A., Narasimhan, K., Salimans, T., and Sutskever,
I. (2018). Improving language understanding by gen-
erative pre-training.
Si, J., Mukherjee, A., Liu, B., Pan, S. J., Li, Q., and Li,
H. (2014). Exploiting social relations and sentiment
for stock prediction. In Proceedings of the 2014 Con-
ference on Empirical Methods in Natural Language
Processing (EMNLP), pages 1139–1145.
Turney, P. D. and Pantel, P. (2010). From frequency to
meaning: Vector space models of semantics. Journal
of Artificial Intelligence Research, 37:141–188.
Wang, W. Y. and Hua, Z. (2014). A semiparametric gaus-
sian copula regression model for predicting financial
risks from earnings calls. In Proceedings of the 52nd
Annual Meeting of the Association for Computational
Linguistics (Volume 1: Long Papers), pages 1155–
1165.
Xie, B., Passonneau, R., Wu, L., and Creamer, G. G. (2013).
Semantic frames to predict stock price movement. In
Proceedings of the 51st Annual Meeting of the Associ-
ation for Computational Linguistics, pages 873–883.
Xu, Y. and Cohen, S. B. (2018). Stock movement predic-
tion from tweets and historical prices. In Proceed-
ings of the 56th Annual Meeting of the Association for
Computational Linguistics (Volume 1: Long Papers),
pages 1970–1979.
Zhu, X., Wang, H., Xu, L., and Li, H. (2008). Predicting
stock index increments by neural networks: The role
of trading volume under different horizons. Expert
Systems with Applications, 34(4):3043–3054.
KDIR 2020 - 12th International Conference on Knowledge Discovery and Information Retrieval
332
