
Exploring Voice Assistant Risks and Potential
with Technology-based Users
Andreas M. Klein
1 a
, Andreas Hinderks
1 b
, Maria Rauschenberger
2 c
and J
¨
org Thomaschewski
3 d
1
Department of Computer Languages and Systems, University of Seville, Seville, Spain
2
Social Computing Systems, Max Planck Institute for Software Systems, Saarbr
¨
ucken, Germany
3
Faculty of Technology, University of Applied Sciences Emden/Leer, Emden, Germany
Keywords:
Voice User Interface, VUI, Conversational User Interface, CUI, Smart Personal Assistant, SPA, Voice
Assistant, VA, Frequency of Use, Context of Use, Privacy.
Abstract:
Voice user interfaces (VUIs) or voice assistants (VAs) such as Google Home or Google Assistant (Google),
Cortana (Mircosoft), Siri (Apple) or Alexa (Amazon) are highly available in the consumer sector and present
a smart home trend. Still, the acceptance seems to be culture-dependent, while the syntax of communication
poses a challenge. So, there are some basic questions: ‘Why do people buy VAs?’ ‘What do they use them
for?’ ‘What could be improved in the future?’. We explore the opinion of a German technology-based user
group to identify the challenges and opportunities of VAs. We focus on the interaction behaviour, frequency of
use, concerns, and opinions of this target group as they show a higher variety of interaction as well as privacy
concerns in representative population studies. Our preliminary findings confirm previous results (missing
accuracy of commands and serious concerns about privacy issues) and show that technology-based users from
Germany are intensive users, although with particular concerns about data collection. Probably, there is a
correlation between privacy concerns and speech intelligibility as queries relating to VAs are problematic due
to repetitions and refinement.
1 INTRODUCTION
Analysts predict a growing use for digital voice as-
sistants and devices with voice control in the next
few years (Tuzovic and Paluch, 2018). Current mar-
ket analyses expect a worldwide increase from almost
2 billion dollars in 2020 to almost 7 billion dollars
in 2025 for voice- and speech-recognition software
(Tractica, 2020). This technology will and has al-
ready started: it has developed into a leading-edge
technology with a wide range of applications in both
corporate and consumer sectors. The example ar-
eas are healthcare, automotive industry, authentica-
tion and identification, voice commerce and customer
service, and smart home (Tractica, 2020).
When talking about digital voice assistants or
smart personal assistants, we consider the so-called
“general-purpose assistants”, that belong to the
“adaptive voice (vision) assistants” (Knote et al.,
a
https://orcid.org/0000-0003-3161-1202
b
https://orcid.org/0000-0003-3456-9273
c
https://orcid.org/0000-0001-5722-576X
d
https://orcid.org/0000-0001-6364-5808
2019). Well-known examples are Google Assistant
(Google), Siri (Apple), Alexa (Amazon), Bixby
(Samsung), and Cortana (Microsoft). We refer to
these systems and devices with integrated voice
user interfaces (VUIs) as voice assistant (VA) in the
following. On one hand, VAs are highly available
in the consumer sector, as they are recently being
integrated into smart devices (also, internet of Things,
IoTs), tablets and personal computers. On the other
hand, there is a high degree of scepticism about their
use, especially in Germany (Tas et al., 2019).
The quality of a product or application including
VAs can be determined by measuring usability and
user experience (UX) which are designed with the
well-known Human-Centered Design framework
(HCD) (ISO/TC 159/SC 4 Ergonomics of human-
system interaction, 2010). HCD is a standard to
develop and evaluated, for example, products with
a graphical user interfaces (GUI). But there are
currently no equal focus in frameworks to develop
devices with VUIs. The UX of GUI is distinguished
from VUI as voice and hearing abilities are different
from the visual ability.
Klein, A., Hinderks, A., Rauschenberger, M. and Thomaschewski, J.
Exploring Voice Assistant Risks and Potential with Technology-based Users.
DOI: 10.5220/0010150101470154
In Proceedings of the 16th International Conference on Web Information Systems and Technologies (WEBIST 2020), pages 147-154
ISBN: 978-989-758-478-7
Copyright
c
2020 by SCITEPRESS – Science and Technology Publications, Lda. All rights reserved
147

In order to meet the users’ requirements for VA
applications in the future, the amount of personal data
required must increase, which at the same time leads
to higher concerns of the users regarding the protec-
tion of their data and privacy (Tas et al., 2019). In
terms of adoption, Germany is far behind countries
such as Italy, Spain, and the United Kingdom, and it
is also behind countries such as the USA, India, and
China in global rankings in this particular area (Tas
et al., 2019).
Therefore, we aim to explore how VAs are used
in Germany by a so-called technology-based (affine)
target group, which refers to people having a prefer-
ence for technology. We expect to find higher poten-
tial for improvement and the essential concerns in this
target group to overcome barriers that might keep po-
tential users from using VAs in Germany. The Ger-
man study of the BVDW (BVDW e.V., 2017) shows
that VA user experience correlates with age, as three
out of four users (16 to 24 years old) have already ex-
perience with VAs. This age group also has the most
diverse usage patterns and, at the same time, the high-
est concerns in the use of VAs. Hence, we explore the
context of use for VAs for this target group, which,
in this case, refers to students of technical courses in
Germany.
This article is structured as follows: Section 2
presents recent studies that focus on different aspects
of the contemporary use of VAs. The following Sec-
tion 3 explains the development and structure of our
questionnaire while Section 4 describes the research
method. In Section 5 we cover our results and discuss
our findings. We finish with conclusion and future
work in Section 6.
2 BACKGROUND & RELATED
WORK
We briefly introduce VUI and VA terms and their re-
quirements regarding usability and UX. Furthermore,
we present several studies that explore VA user be-
haviour. The following VA characteristics regarding
our technology-based target group is of particular
interest to explore the controversy of high availability
of VUI vs. use: frequency of use, several user groups,
the context of use, and concerns of users. Since voice
interfaces and speech dialogue systems are recent,
there are various definitions. A concise and often
quoted definition is: “A Voice User Interface (VUI)
is what a person interacts with when communicating
with spoken language application.” (Cohen et al.,
2004). When interacting with information technology
systems, VUIs enable the user to work without classic
input/output devices such as the keyboard and the
mouse combined with screens, i.e., graphical user
interfaces (GUIs). The term ‘VUI’ mainly describes
an interface as one component of an entire system to
communicate via, e.g., voice commands. Sometimes
VUI is used to describe the overall system of a
speech application that consists of different function
modules such as automatic speech recognition or
natural language processing. The overall systems of
a voice application or a VA are called a service or
device (Tas et al., 2019). VAs offer various integrated
functions (e.g., web search, online shopping), and its
additional features are called ’skills’ or ’actions’ that
can be included. These ’skills’ can serve different
purposes, (e.g., entertainment, smart home), and are
often provided by third parties. Besides, there are
end-user environments that allow the use of preferred
online web services through VAs (Ripa et al., 2019).
UX (ISO/TC 159/SC 4 Ergonomics of human-
system interaction, 2010) as a holistic concept, in-
cluding all types of reactions, before, during, and af-
ter the use of a product. Measuring the UX of prod-
ucts applying GUI is possible using tools like the User
Experience Questionnaire (UEQ) (Laugwitz et al.,
2008), meCUE (Minge, Michael and Riedel, Laura,
2013) or UEQ+ (Schrepp and Thomaschewski, 2019)
questionnaires, but these are not specific to products
with VUI.
The UX of devices with VUI is not sufficiently
considered as these evaluation tools do not measure
the user’s expectations of VAs yet, i.e., compre-
hensibility, response behaviour, or response quality.
VAs should capture the context without a particular
formulation to fulfill the users’s intentions. UX for
voice interaction can be derived regarding the user,
the system, and the context (Klein et al., 2020c).
Existing questionnaires need to be extended or a
new questionnaire should be created to evaluate VAs,
which should lead to improvements in VAs. For ex-
ample, a new and flexible method is the modular
framework UEQ+ based on various scales to con-
struct a product-specific questionnaire for which three
VUI scales have been developed but not validated yet
(Klein et al., 2020b).
Others (BVDW e.V., 2017; Biermann et al., 2019;
Tas et al., 2019), however, focus on exploring current
users, use cases, and systems to understand VAs
interaction, and finding design patterns. For example,
the usability and UX of VUIs were described as
usable from a social media-based interest group, but
they also identified challenges. Users had difficulties
giving long commands, or commands have to be
given multiple times to accomplish the task, or there
would be problems with the integration with other
WEBIST 2020 - 16th International Conference on Web Information Systems and Technologies
148

systems (Pyae and Joelsson, 2018). A population-
representative online survey among 1040 US citizens
(aged ≥ 18 years) shows the usage behaviour con-
cerning different device groups (smartphone, smart
speaker, car) and results on the quality and wishes of
VA consumers (Kinsella and Mutchler, 2018). They
are not exploring privacy concerns. A long-term
exploration of smart speaker assistants (SSAs) in the
US over 110 days focused on how SSAs fit in the
household’s daily life and the long-term interaction
(Bentley et al., 2018). They found out that users
explore commands but not new use cases over time.
An online consumer survey conducted in Novem-
ber 2018 in Germany investigated the development of
the use of popular VAs (Tas et al., 2019). VA usage
behaviour is representative of the population based
on the quota sample of 18–54 years of age. Among
other things, aspects such as the intensity of use, us-
age patterns, and consumer protection are taken into
account. The results confirm the enormous potential
of this technology, as 85% of consumers already have
a VA. However, only 26% of Germans use at least
one device, probably due to the lack of conversational
skills and privacy concerns and monitoring. The study
revealed that VAs pass on information derived from
the continuously buffered data.
Another population-representative online survey
of 1006 Germans aged between 18–69 years old from
January 2019 investigated, e.g., the extent of VA use
and considered different user groups (SPLENDID
RESEARCH GmbH, 2019) but it did not focus on
technology-based users. The survey shows that 60%
of Germans have used at least one known VAs, 30%
of them intensively, 32% occasionally, and 38% less
frequently. Nevertheless, 61% of the respondents did
not see any sensible use, and 35% mentioned data
protection concerns.
The October 2017 online survey of 1038 partic-
ipants, representing the German population (aged
≥ 16 years), studied usage trends, concerns, and
application areas of VAs (BVDW e.V., 2017). For the
group of the surveyed German onliner people, 56%
had already used a VA and 80% found at least one
area of application, while 80% also expressed a usage
concern. In various survey categories, a subgroup
comparison is used to identify certain characteristics
in a specific user group. For example, women (52%)
use VAs less often than men (62%). Particularly
affine are those aged 16–24 years, among whom 75%
have already had VA user experience. This group
also shows significant concerns with 90%.
Since the technology-based user group showed a
more diverse usage pattern and the most notable pri-
vacy concerns, we are exploring this target group by
focusing on the challenging aspects of VA applica-
tions. Additionally, we want to know if challenges
such as the comprehension of commands has changed
since the latest evaluation of UX in 2018. Therefore,
we explore the opinions of both users and non-users
about VAs in connection with the current context of
use and use frequency. We also intend to discover the
risks and opportunities for such systems in the future.
3 QUESTIONNAIRE STRUCTURE
There are various types of questionnaires: for ex-
ample, the Subjective Assessment of Speech System
Interfaces (SASSI) (Hone, 2014) mainly to measure
VUI parameters or the User Experience Question-
naire (UEQ) (Laugwitz et al., 2008) to measure
Usability and UX. The UEQ is already designed
in over 30 languages including Spanish (Rauschen-
berger et al., 2013). The modular UEQ+ (Schrepp and
Thomaschewski, 2019) offers the advantage of focus-
ing on a specific research question but currently lacks
scales for VUIs. Either questionnaires do not have
VUI parameters included or are mainly developed for
one purpose (without focusing on UX) and cannot be
easily adapted to new research purposes. Adaptions
such as new VUI parameters beeing turned into,
for example, the UEQ, are costly in terms of time
and personnel. Hence, we designed a questionnaire
(Klein et al., 2020a) for our research questions, which
contains both qualitative and quantitative elements
to explore VUIs and their parameters as well as
usability and UX. Its essential aspects are questions
about availability and usage, frequency of use, the
context of use and the potential to improve VAs.
The structure of our questionnaire is as follows:
Page 1 contains the introduction to the topic of the
study regarding an anonymous survey. The socio-
demographic (age, gender) data is followed by two
questions about availability and which VAs are used.
Here, multiple entries of popular VAs (Siri, Alexa,
Cortana, Google Assistant) are possible as well as
a free text field for other devices. This is followed
by question 5 (“Give reasons why you own certain
VAs but do not use them.”) which can only be an-
swered with free text. Question 6 (“How often do you
use VAs in total?”) has six possible answers (daily,
approximately daily, several times a week, approxi-
mately weekly, several times a month, approximately
monthly or less often), and “never” with a hint to
jump to question 9 directly, and finally a free text an-
swer field to give reasons for occasional use. Ques-
tions 7—11 are structured tabular as follows: several
answer options, which are answered with a seven-
Exploring Voice Assistant Risks and Potential with Technology-based Users
149
point Likert-scale (e.g., from 1 [highly relevant] to 7
[completely irrelevant]) and ”No statement possible”.
The participants had after each question the possibil-
ity to enter further explanations in a free text field.
Question 7 (“Why do you use VAs?”) contain a total
of eight predefined fields with answers such as “For
more convenience”, “For more security” or “Because
I like to try out new techniques”. Question 8 (“In
what environment do you use VAs?”) provides two
context areas (at home and on the road), each con-
taining the possibilities “home control”, “media se-
lection”, “communication” and “web search”. Ques-
tion 9 (“In your opinion, what are the reasons for not
using VAs?”) offers various response options in the
areas of “understanding and responding to requests”,
data security, price and quality of the devices or the
preference for classic input devices. Question 10 asks
for improvement, e.g., in the areas of comprehensibil-
ity, quality of the answers of the VAs, as well as data
protection and privacy. Finally, Question 11 includes
the general feeling of “discomfort” when talking to
machines.
The questionnaire was evaluated in two pre-tests
with five participants each. After the first pre-test,
small changes in the wording and the procedure also
allowed the non-user to answer questions about im-
provements in VAs in order to derive possible rea-
sons for non-use. The second run confirmed the fi-
nal version of the four-page questionnaire with 11
question areas and the corresponding answer options.
After the pre-test, we conducted a preliminary study
that delivered useful and reliable results by compar-
ing our findings with the previous literature concern-
ing our target group. The paper–pencil form was cho-
sen to get a direct return from the participants. The
questionnaire is available in the original German lan-
guage and English translation (Klein et al., 2020a)
(https://doi.org/10.13140/RG.2.2.21473.12646).
4 METHODOLOGY
At the age of 16–24 years, Germans, who are per-
ceived as strongly technology-based people with great
VA user experience, show the most diverse usage pat-
tern and display the most significant concerns about
VAs (BVDW e.V., 2017). We aim to discover how a
German technology-based target group currently uses
VAs by surveying technical-degree students to ex-
plore the possibilities and current pitfalls that could
deter potential users from applying VAs. We focus on
the following research questions:
Table 1: Overview of the participants.
Group Number of
participants
%
Total 115 100.0
VA availability 101 87.8
Users VA 52 51.5
Non-users VA 49 49.5
No VA availability 14 12.2
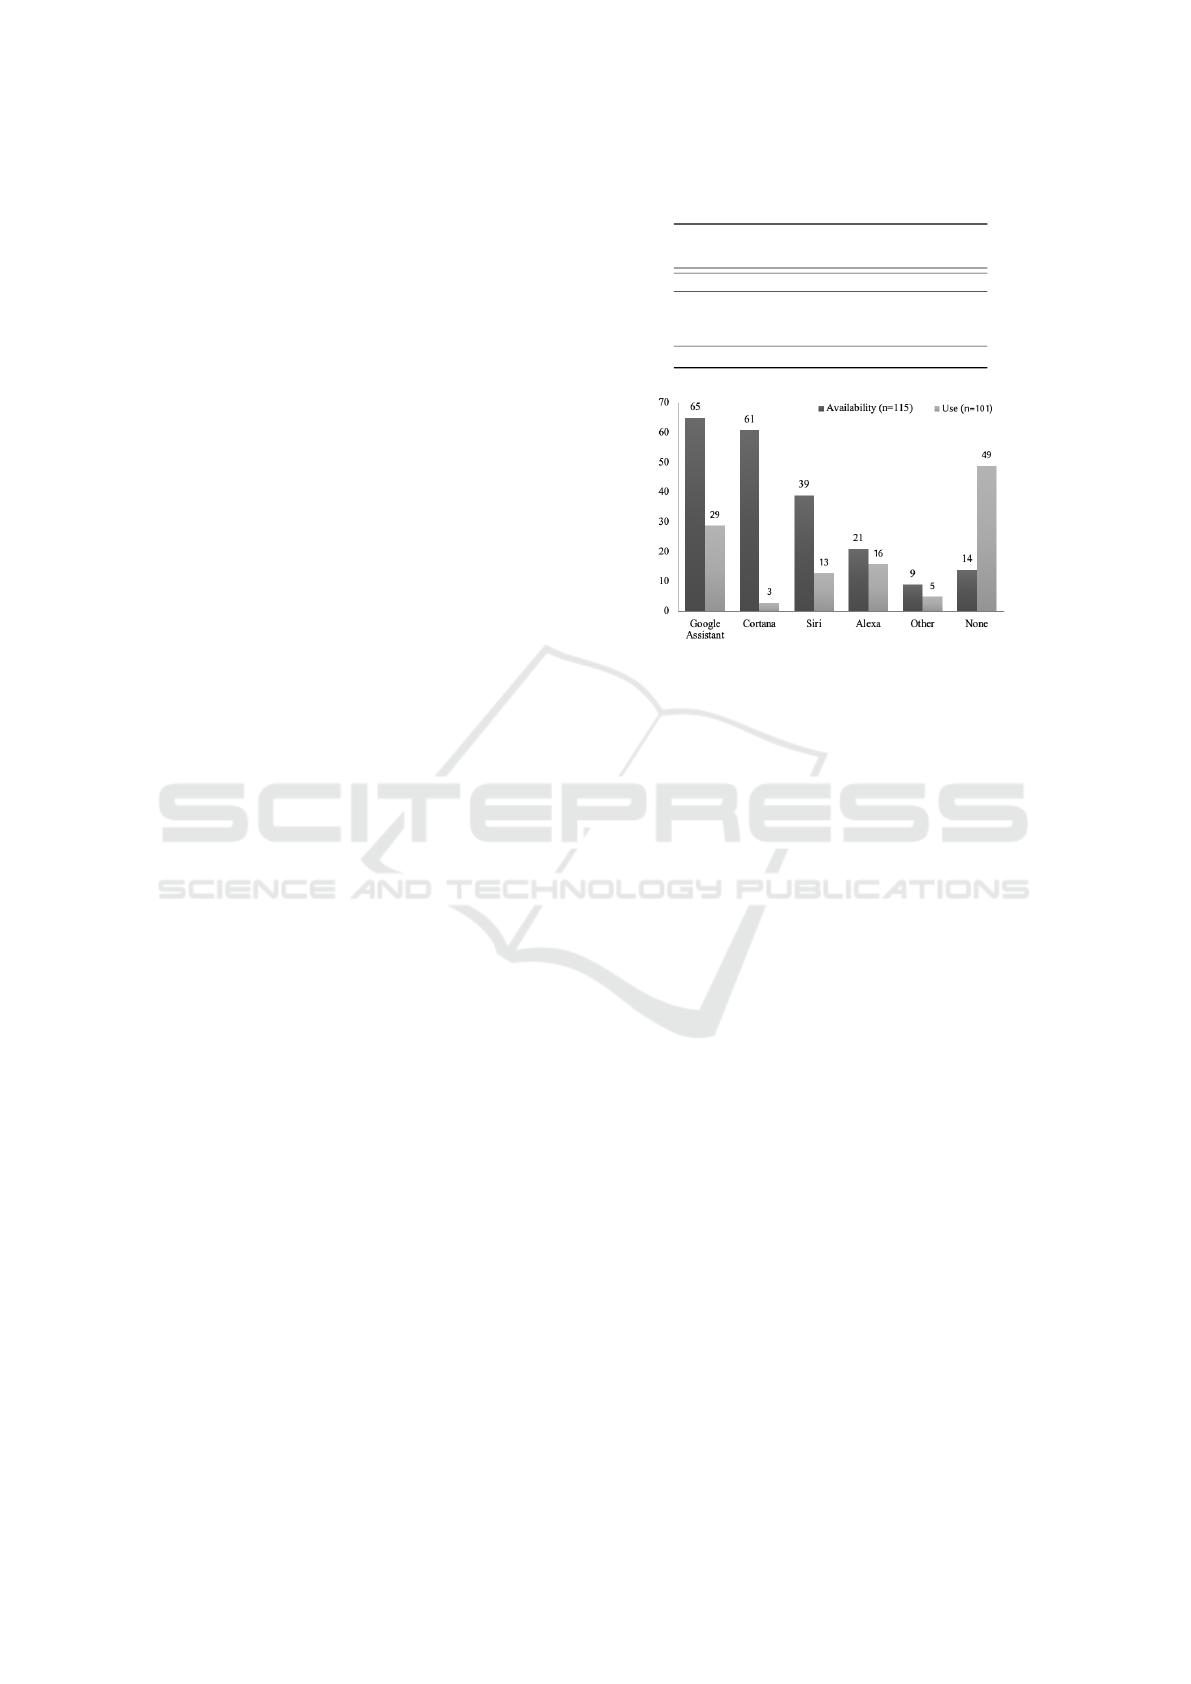
Figure 1: Comparison of the availability of VAs for 115
participants to the use of VAs by 101 participants.
RQ1. How frequently are VAs used in this target group?
RQ2. In which context does the target group use VAs?
RQ3. What are their concerns regarding data protection
and privacy when using VAs?
RQ4. What improvements do they propose for VAs?
4.1 Procedure
We collected our data from different seminars of
three technical courses of studies (electrical engi-
neering, computer science, media technology) with
the paper–pencil questionnaire between March and
April 2019 at the University of Applied Science Em-
den/Leer. The participants were informed by one of
the authors about the purpose of the voluntary study.
Following a brief introduction, the questionnaire was
distributed among the students and collected after ap-
prox. 12-minutes of processing time.
4.2 Participants
Filling out the Likert-scales analogue has the risk that
the participants overlooked the scales, but they also
have the opportunity to fill out the same instantly.
Hence, missing data is due to not-readable or not-
filled-out Likert-scales. Participants were excluded
from the survey in the case of more than two miss-
ing response options (n = 12). Hence, we analysed
115 participants and split our participants groups by
their response on the availability and actual use of
digital voice assistants (Question 6: “How often do
WEBIST 2020 - 16th International Conference on Web Information Systems and Technologies
150
you use Voice Assistants in total?”). Here multiple
answers are possible (see Table 1): 12,2% (n = 14)
stated that they did not have any VA, whereas 87,8%
(n = 101) had such systems (see Figure 1). The study,
therefore, evaluates the results of 115 participants 91
males (79%), 22 females (19%), and two with no gen-
der indication) with the average age of 23 years (SD
3 years).
5 RESULTS & DISCUSSION
The statistical analysis was carried out using Mi-
crosoft Excel for Mac. We accept our imbalanced dis-
tribution of gender (19% female vs. 79% male, 2% no
answer) as this was similar to the comparative study
(BVDW e.V., 2017) and something that made sense
in retrospect. On the one hand, females are under-
represented in technical courses in Germany (Statista,
2020); on the other hand, woman currently seem to
use VAs less frequently (BVDW e.V., 2017). Other
comparative studies show similar gender distributions
with 77% or 72% male participants (Pyae and Joels-
son, 2018; Sciuto et al., 2018). As VAs are a relatively
young field of research, future research is necessary to
give a comprehensive assessment of the topic (e.g., on
VAs and gender acceptance), but this is not the main
scope of this paper.
In the first part of the study, the participants (n =
115) indicated the availability of VAs and the ones
they use. As a result, Figure 1 shows that 87,8%
(n = 101) have access to at least one VA, among
which 51.5% (n = 52) currently use one or more de-
vices and 48.5% (n = 49) did not use any. The Google
Assistant is used most often with 28,7% (n = 29), fol-
lowed by Amazon’s Alexa with 15.8% (n = 16) and
Apple’s Siri with 12.9% (n = 13). We are in line
with previous surveys where, for example, 56% of
the users chose the Google Assistant in 29% of cases
(BVDW e.V., 2017) or 60% of respondents have al-
ready used a VA (SPLENDID RESEARCH GmbH,
2019). According to Kinsella & Mutchler (Kinsella
and Mutchler, 2018) survey, 36.5% of the US popula-
tion say they are not interested in using such devices.
In the comparison of users/non-users, the technology-
based target group of our study, with 51.5% users,
has a significantly larger user share compared to the
WIK (Tas et al., 2019) study with 26% users. But the
BVDW study showed that the younger the users, the
more VAs are used (BVDW e.V., 2017). In summary,
we see the choice of a technology-based target group
for our study as confirmed. Overall, our small data re-
sults are in line with current studies, as we compared
above.
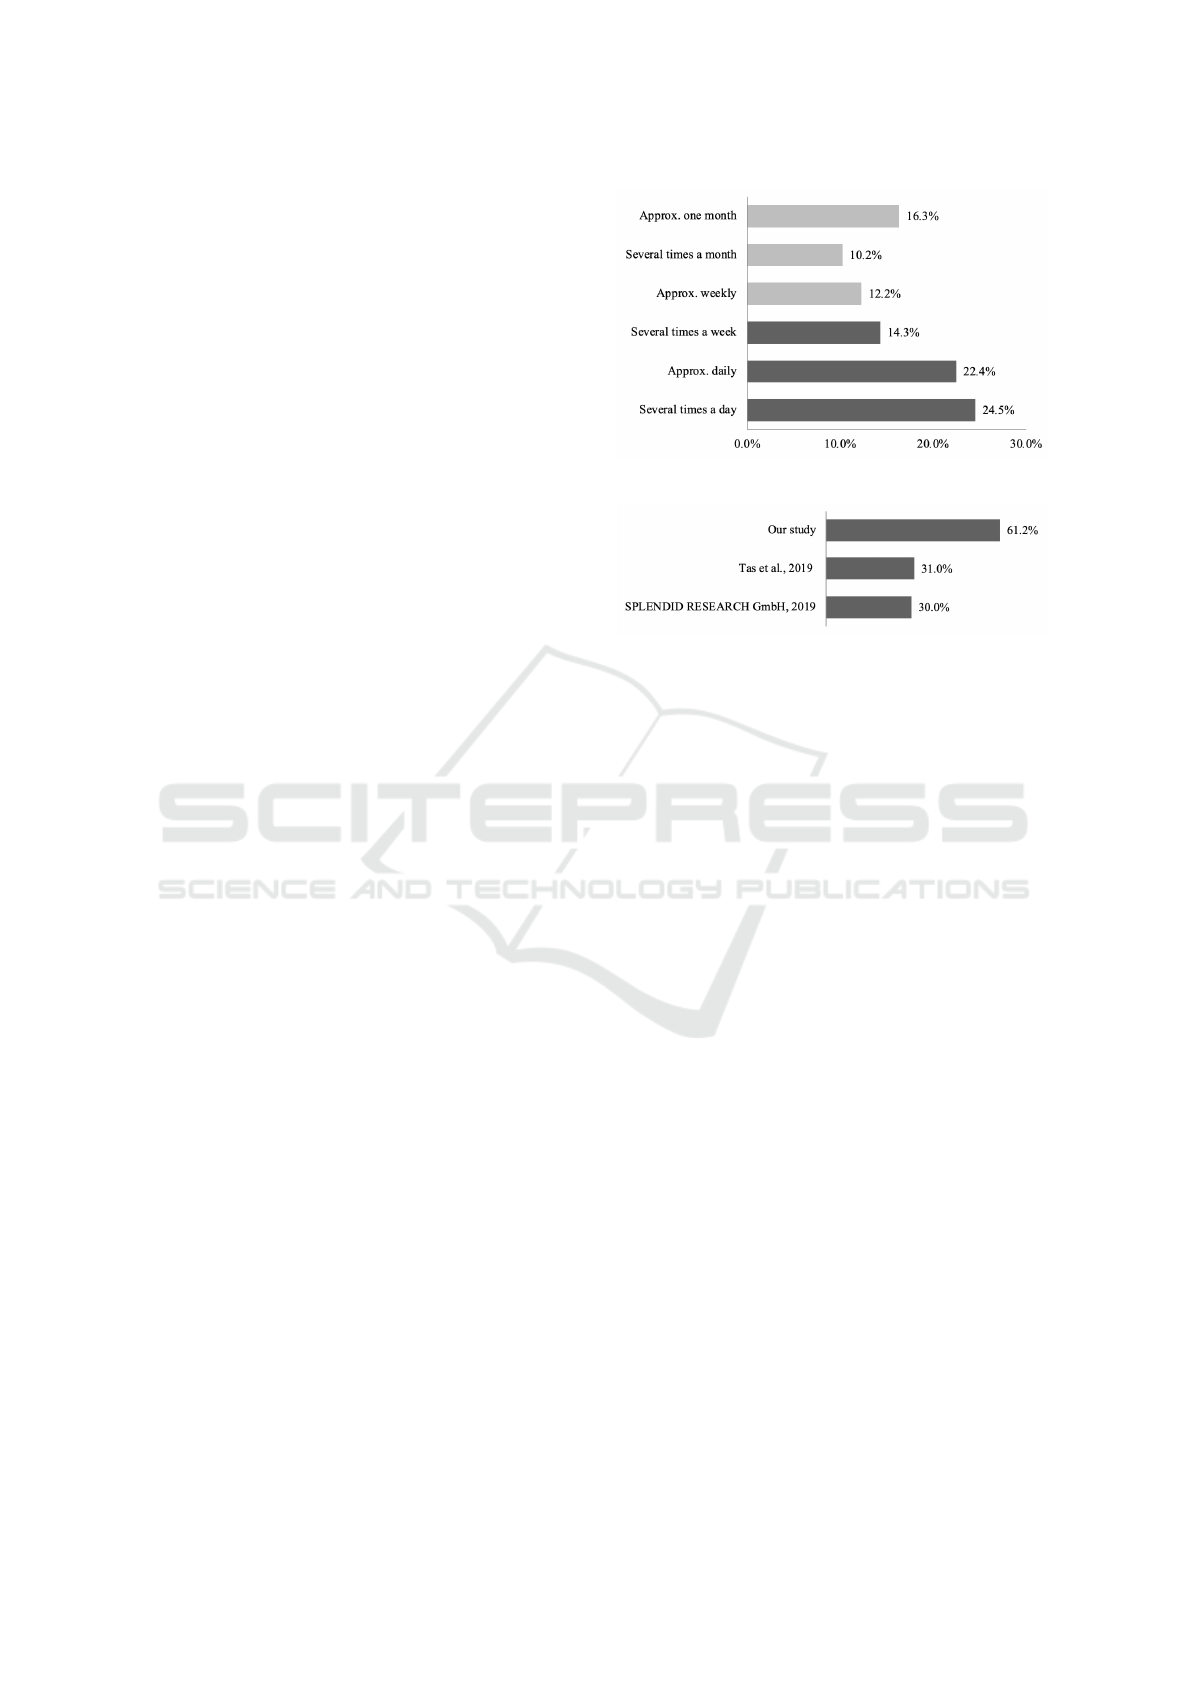
Figure 2: Frequency of use (n = 49).
Figure 3: Comparison of intensive users.
5.1 How Frequently Are VAs Used in
This Target Group?
Figure 2 shows the frequency of use, from which
two user groups can be derived. The intensive users
(n = 30, 61.2%) have a usage time of several times a
day to several times a week while the occasional users
(n = 19, 38.8%) have approximately weekly to ap-
proximately monthly usage time. The graph is based
on n = 49 participants since two answers in free text
form a) “sometimes” and b) “while driving” and one
respondent did not provide any pertinent usage time
information. In the SR (SPLENDID RESEARCH
GmbH, 2019) survey, a similar subdivision was made
to make a statement on the frequency of use and to
define meaningful user groups. This results in 30%
intensive users (daily and several times a week), 32%
occasional users (weekly, several times a month and
monthly), and 38% rare users. The WIK study (Tas
et al., 2019) shows 31% with a “rather frequent” use.
The large share of 61,2% of intensive users in our
study confirms the expectations of a high frequency
of use by the selected target group (see Figure 3).
5.2 In Which Context Does the Target
Group Use VAs?
The participants have evaluated four typical VA use
cases, each “at home” and “on the road” as well as
the dictation and voice mail function in general. Fig-
ure 4 shows that media selection in the domestic en-
vironment is the preferred application of this target
Exploring Voice Assistant Risks and Potential with Technology-based Users
151
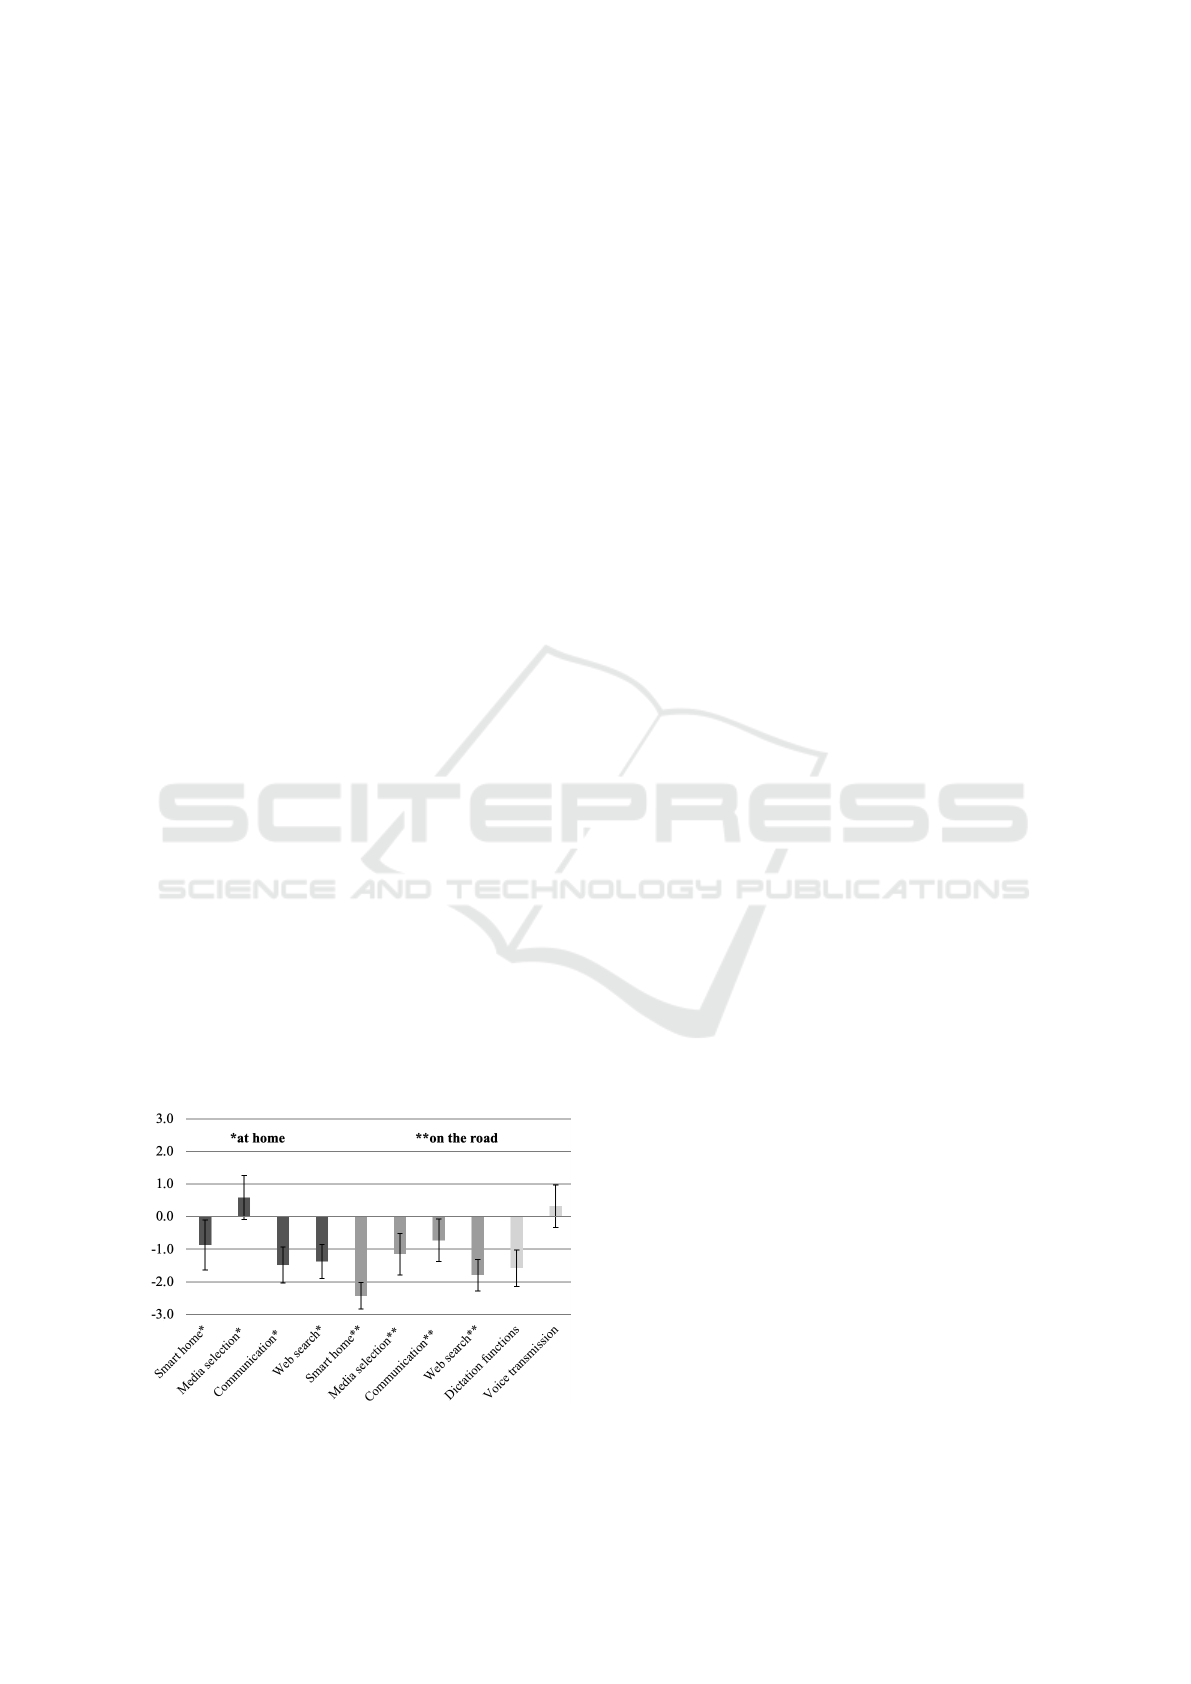
group. Due to the small sample size (n = 52) and
the wide spread of answers, the confidence intervals
are not small enough to make a reliable statement for
the entire target group. Since this was a preliminary
study, we need to gather more data to make further
valid statements in future.
The American long-term study (Bentley et al.,
2018) shows that in daily VA use, 40% of the requests
are for music procurement, 17% for information, and
9% for automation. The VACAR survey (Kinsella and
Mutchler, 2018) indicates that innovative applications
such as smart home control were used daily by 5.6%
and monthly by 11.9% of respondents. As a result,
Figure 4 shows that, except for media selection and
voice transmission, the target group accepts that the
usage environments and use cases have not been stud-
ied enough.
5.3 What Are Their Concerns
Regarding Data Protection and
Privacy When using VAs?
User data misuse and the possibility of monitoring
can be seen as the main concerns when using VAs in
our target group. For example, 36.5% (n = 19) of the
users are concerned that the data could be misused,
while 40.4% (n = 21) suspect that the devices could
be used for monitoring. These concerns relating to
data protection are also shown in a very similar form
by comparative studies. For example, the BVDW sur-
vey (BVDW e.V., 2017) has 33% users who fear data
misuse, and 33% who fear monitoring or interception
by others.
As a result, our target group, despite more in-
tensive use, express more significant concerns about
monitoring and data misuse. The quality of the accu-
rate command execution of VAs depends currently on
the ability to understand the context, e.g., User:“Siri,
Figure 4: Context of the use for VAs (y-axis scale from
“never” [-3.0] to “often” [3.0]).
how many inhabitants does Hamburg have?” Siri:“In
2019, the population of Hamburg was 1,899,160.”
User:“And in Sevilla?” Siri:“I found this online about
‘And in Seville’.”. The more information available to
the VA system, the more accurately it can react. At
the same time, this means that more data is collected
and transmitted, which increases the user’s concerns
about data protection and privacy (Tas et al., 2019).
Additionally, an American study shows that the
participants preferred the input of data using VA
from non-private information over private informa-
tion (Easwara Moorthy and Vu, 2014). As private in-
formation is unwillingly submitted to VAs in public
places in the presence of other people, it is perceived
as unacceptable (Easwara Moorthy and Vu, 2014).
5.4 What Improvements Do They
Propose for VAs?
We have collected answers about the overall opinion
independent from the brand about risks and oppor-
tunities. We have provided four categories: speech
intelligibility, response quality, additional forms of
interaction, and the protection of privacy. Figure 5
shows the results of the seven-point Likert-scale in
the numeric range between −3 (not applicable) and
+3 (applicable). We are comparing the means be-
tween −3 and +3 for the different questions in the
following. Owing to the small sample size and the
wide spread of answers, the confidence intervals are
not small enough to make a reliable statement for the
entire target group.
Privacy and protection of users (n = 52, mean =
2.0) and non-users (n = 49, mean = 2.6) shows the
highest scoring for improvements. Then we can iden-
tify similar scores regarding speech comprehensibil-
ity. These are in detail for the user’s speech recogni-
tion (1.6), recognize fast speech (1.4) and recognize
unclear speech (1.5), as well as for the non-user’s
speech recognition (1.8), recognize fast speech (1.8),
recognize unclear speech (1.9). We also find high val-
ues in can distinguish users, improve learning ability,
and better integration.
Our results are in line with the existing literature
that the technology-based target group expresses neg-
ative thoughts towards the data protection and speech
intelligibility (Biermann et al., 2019). Biermann et
al. have identified three clusters for positive and
negative features regarding the most frequently used
“genereal-purpose” VAs. The positive features are
specific function, interaction and positive emotions,
as well as negative features like speech recognition
& dialogue, trust and security, and system and
functionality. That technology-based users express
WEBIST 2020 - 16th International Conference on Web Information Systems and Technologies
152
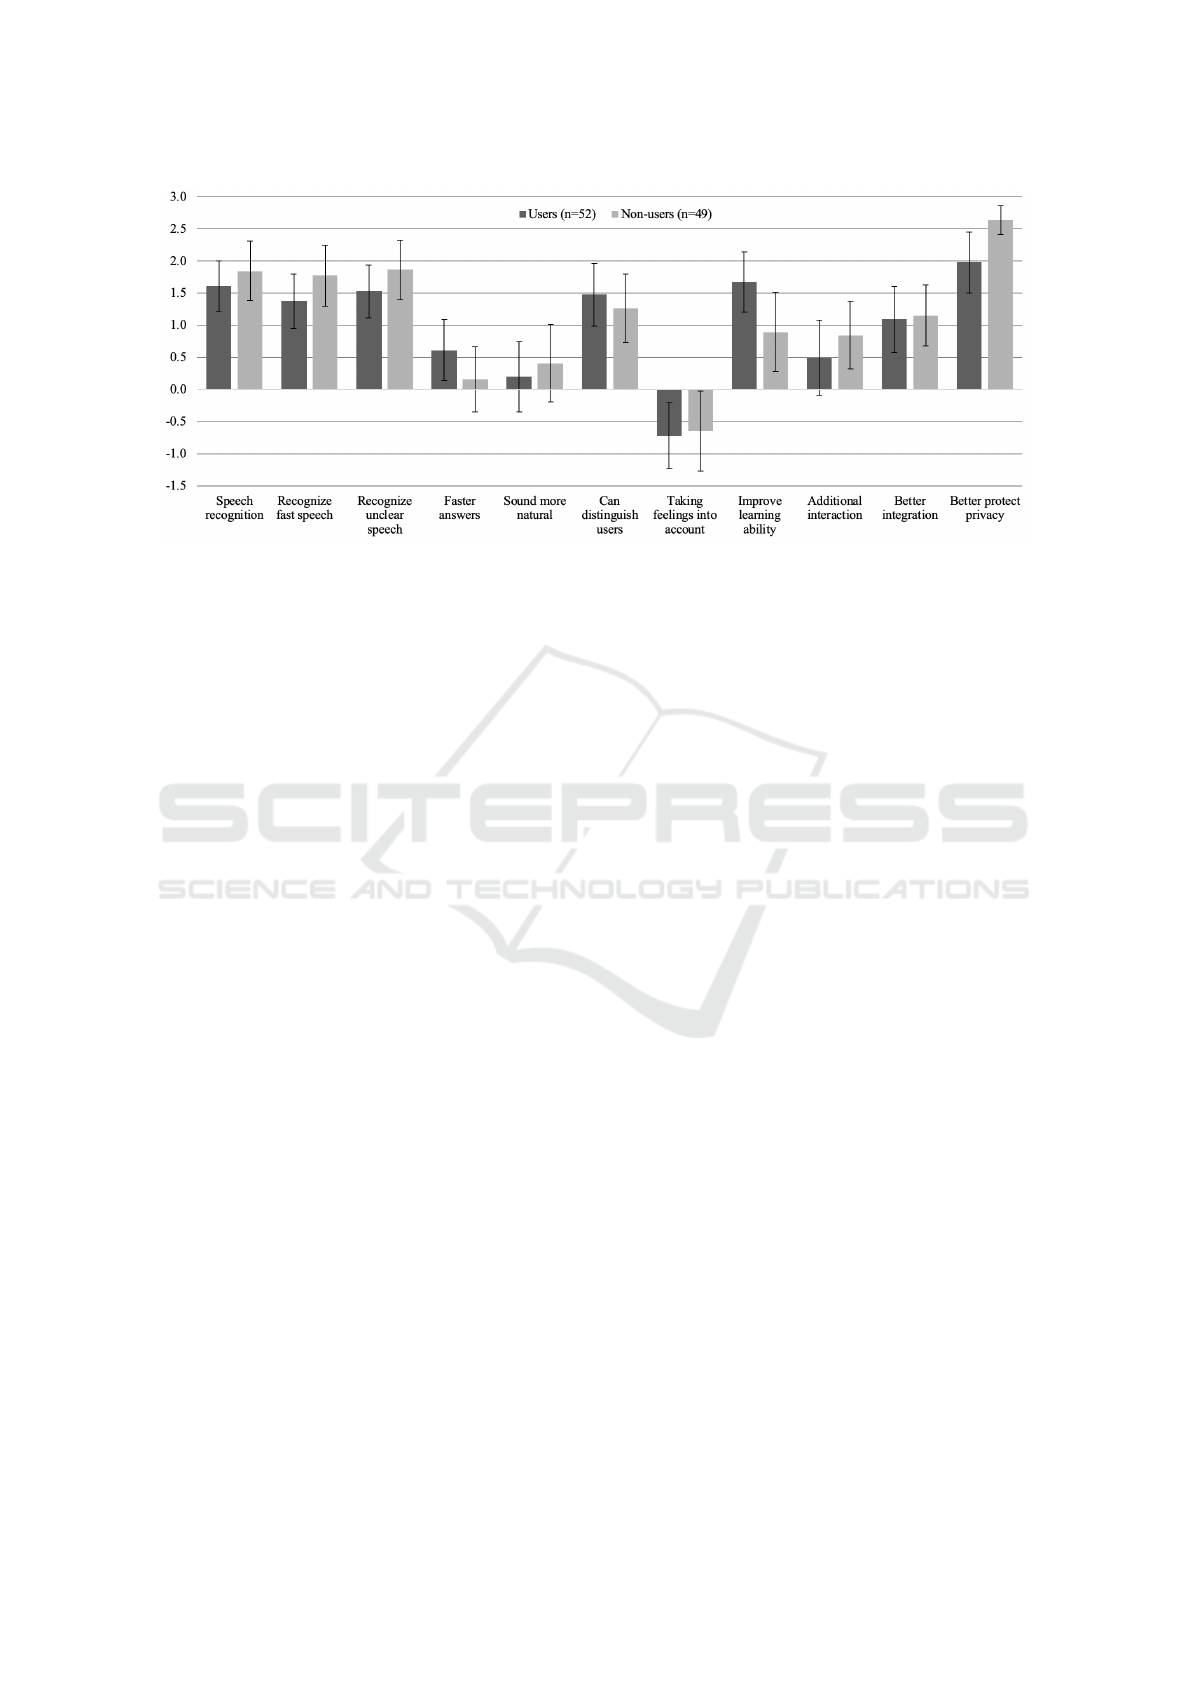
Figure 5: Comparison between users and non-users regarding VA improvement proposals (y-axis scale from “not applicable”
[-3.0] to “applicable” [3.0]).
high concerns about privacy issues is explainable
considering the regularly appearing security news
of DDoS-Attacks with Internet of Things (IoTs)
(Schirrmacher, 2016; Labs, 2017; Scherschel, 2017).
Already in 2014, US Americans expressed privacy
concerns when using Voice-Activated Personal As-
sistants (VAPA) in public (Easwara Moorthy and Vu,
2014). There is probably a correlation between the
privacy concerns and speech intelligibility because
queries relating to VAs are problematic in repetitions
and refinement (Porcheron et al., 2017).
In summary, we can identify as the result of our
study a broad potential for improvement. Non-users
could become users if privacy and speech comprehen-
sibility are enhanced as a priority.
6 CONCLUSION AND FUTURE
WORK
Overall, VAs are equally present in technology-based
groups with deep concerns about privacy and express
opportunities for improvement in speech intelligibil-
ity. In this survey, we have investigated the availabil-
ity and actual use of the so-called “general-purpose”
VAs. As expected, our results show in our target
group a high proportion of intensive users compared
to other studies. But, at the same time, there are con-
siderable concerns about monitoring and data misuse.
VAs are mainly used for media selection and voice
transmission; they can revolutionize the interaction
between humans and technology in the long run if
engineers take the user’s reservations into account.
Our preliminary exploration shows concerns from the
technology-based users and could be repeated every
year to understand the user needs and evolution. Fu-
ture work includes the collection of more data from
different user groups to validate our results and to un-
derstand the potential user groups, e.g., consumer vs.
professional use. Therefore, we will explore power or
routine users with a structured interview. We plan to
apply new scales for the modular questionnaire UEQ+
by focusing on the measurement of UX of VAs. We
additionally plan more qualitative evaluations with in-
terviews and observations.
REFERENCES
Bentley, F., Luvogt, C., Silverman, M., Wirasinghe, R.,
White, B., and Lottridge, D. (2018). Understanding
the long-term use of smart speaker assistants. Proc.
ACM Interact. Mob. Wearable Ubiquitous Technol.,
2(3).
Biermann, M., Schweiger, E., and Jentsch, M. (2019).
Talking to stupid?!? improving voice user inter-
faces. In Fischer, H. and Hess, S., editors, Mensch
und Computer 2019 - Usability Professionals, Bonn.
Gesellschaft f
¨
ur Informatik e.V. und German UPA e.V.
BVDW e.V. (2017). Digital Trends Umfrage zu digi-
talen Sprachassistenten. Bundesverband Digitale
Wirtschaft (BVDW) e.V. [Digital Trends Survey on
digital language assistants. Federal Association of
Digital Economy]. https://www.bvdw.org/themen/
publikationen/detail/artikel/digital-trends-umfrage-
zu-digitalen-sprachassistenten/.
Cohen, M. H., Giangola, J. P., and Balogh, J. (2004). Voice
User Interface Design. Addison Wesley Longman
Publishing Co., Inc., USA.
Easwara Moorthy, A. and Vu, K.-P. L. (2014). Voice ac-
tivated personal assistant: Acceptability of use in the
public space. In Yamamoto, S., editor, Human Inter-
face and the Management of Information. Information
Exploring Voice Assistant Risks and Potential with Technology-based Users
153

and Knowledge in Applications and Services, pages
324–334, Cham. Springer International Publishing.
Hone, K. (2014). Usability measurement for speech sys-
tems : Sassi revisited. In SIGCHI Conference Paper,
Toronto.
ISO/TC 159/SC 4 Ergonomics of human-system interaction
(2010). Part 210: Human-centred design for interac-
tive systems. In Ergonomics of human-system inter-
action, volume 1, page 32. International Organization
for Standardization (ISO), Brussels.
Kinsella, B. and Mutchler, A. (2018). Voice assistant
consumer adoption report. https://voicebot.ai/wp-
content/uploads/2019/01/voice-assistant-consumer-
adoption-report-2018-voicebot.pdf.
Klein, A. M., Hinderks, A., Rauschenberger, M., and
Thomaschewski, J. (2020a). Protocol for Exploring
Voice Assistant Risks and Potential with Technology-
based Users. https://doi.org/10.13140/RG.2.2.21473.
12646.
Klein, A. M., Hinderks, A., Schrepp, M., and
Thomaschewski, J. (2020b). Construction of
UEQ+ Scales for Voice Quality. In Proceedings of
the Conference on Mensch Und Computer, MuC
’20, page 1–5, New York, NY, USA. Association for
Computing Machinery.
Klein, A. M., Hinderks, A., Schrepp, M., and
Thomaschewski, J. (2020c). Measuring User
Experience Quality of Voice Assistants. In 2020
15th Iberian Conference on Information Systems and
Technologies (CISTI), pages 1–4. IEEE.
Knote, R., Janson, A., S
¨
ollner, M., and Leimeister, J. M.
(2019). Classifying smart personal assistants: An em-
pirical cluster analysis. In Proceedings of the 52nd
Hawaii International Conference on System Sciences.
Labs, L. (2017). Neues Botnetz
¨
uber IoT-
Ger
¨
ate [New botnet about IoT devices].
https://www.heise.de/security/meldung/Neues-
Botnetz-ueber-IoT-Geraete-3867237.html.
Laugwitz, B., Held, T., and Schrepp, M. (2008). Construc-
tion and evaluation of a user experience questionnaire.
In Symposium of the Austrian HCI and usability engi-
neering group, volume 5298, pages 63–76. Springer.
Minge, Michael and Riedel, Laura (2013). meCUE – Ein
modularer Fragebogen zur Erfassung des Nutzungser-
lebens. In: S. Boll, S.Maaß & R. Malaka (Hrsg.):
Mensch und Computer 2013: Interaktive Vielfalt (S.
89-98). M
¨
unchen, Oldenbourg Verlag.
Porcheron, M., Fischer, J. E., and Sharples, S. (2017).
“do animals have accents?”: Talking with agents in
multi-party conversation. In Proceedings of the 2017
ACM Conference on Computer Supported Coopera-
tive Work and Social Computing, CSCW ’17, page
207–219, New York, NY, USA. Association for Com-
puting Machinery.
Pyae, A. and Joelsson, T. N. (2018). Investigating the us-
ability and user experiences of voice user interface:
A case of google home smart speaker. In Proceed-
ings of the 20th International Conference on Human-
Computer Interaction with Mobile Devices and Ser-
vices Adjunct, MobileHCI ’18, page 127–131, New
York, NY, USA. Association for Computing Machin-
ery.
Rauschenberger, M., Schrepp, M., Cota, M. P., Olschner,
S., and Thomaschewski, J. (2013). Efficient Mea-
surement of the User Experience of Interactive Prod-
ucts. How to use the User Experience Questionnaire
(UEQ). Example: Spanish Language. International
Journal of Artificial Intelligence and Interactive Mul-
timedia (IJIMAI), 2(1):39–45.
Ripa, G., Torre, M., Firmenich, S., and Rossi, G. (2019).
End-user development of voice user interfaces based
on web content. In Malizia, A., Valtolina, S., Morch,
A., Serrano, A., and Stratton, A., editors, End-User
Development, pages 34–50, Cham. Springer Interna-
tional Publishing.
Scherschel, F. A. (2017). Mirai-Botnetz lernt
neue Tricks [Mirai botnet learns new tricks].
https://www.heise.de/security/meldung/Mirai-
Botnetz-lernt-neue-Tricks-3670226.html.
Schirrmacher, D. (2016). Source Code von m
¨
achtigem
DDoS-Tool Mirai ver
¨
offentlicht [Source code
of powerful DDoS tool Mirai released].
https://www.heise.de/security/meldung/Source-
Code-von-maechtigem-DDoS-Tool-Mirai-
veroeffentlicht-3345809.html?view=print.
Schrepp, M. and Thomaschewski, J. (2019). Design and
Validation of a Framework for the Creation of User
Experience Questionnaires. International Journal
of Interactive Multimedia and Artificial Intelligence,
5(7):88–95.
Sciuto, A., Saini, A., Forlizzi, J., and Hong, J. I. (2018).
“hey alexa, what’s up?”: A mixed-methods studies
of in-home conversational agent usage. In Proceed-
ings of the 2018 Designing Interactive Systems Con-
ference, DIS ’18, page 857–868, New York, NY, USA.
Association for Computing Machinery.
SPLENDID RESEARCH GmbH (2019). Digitale sprachas-
sistenten. https://www.splendid-research.com/de/
studie-digitale-sprachassistenten.html.
Statista (2020). MINT Studienanf
¨
anger an deutschen
Hochschulen bis 2018/2019 (STEM First-year
students at German universities until 2018/2019).
https://de.statista.com/statistik/daten/studie/28346/
umfrage/anzahl-der-mint-studienanfaenger/.
Tas, S., Hildebrandt, C., and Arnold, R. (2019). Voice as-
sistants in germany. https://www.wik.org.
Tractica (2020). Tractica. https://tractica.omdia.
com/newsroom/press-releases/voice-and-speech-
recognition-software-market-to-reach-6-9-billion-
by-2025/.
Tuzovic, S. and Paluch, S. (2018). Conversational Com-
merce – A New Era for Service Business Develop-
ment?, pages 81–100. Springer Fachmedien Wies-
baden, Wiesbaden.
WEBIST 2020 - 16th International Conference on Web Information Systems and Technologies
154
