
R-peak Detector Benchmarking using FieldWiz and Physionet Databases
Tiago Rodrigues
1 a
, Hugo Silva
2 b
and Ana Fred
2 c
1
Advanced Sport Instruments SA, Avenue de Beaumont 5, 1012 Lausanne, Switzerland
2
IT - Instituto de Telecomunicac¸
˜
oes, Av. Rovisco Pais n. 1, Torre Norte - Piso 10, 1049-001 Lisboa, Portugal
Keywords:
Electrocardiogram, R-peak Detector, Wearable Devices, Heart Rate Variability.
Abstract:
The R-peak detection in an Electrocardiography (ECG) signal is of great importance for Heart Rate Variability
(HRV) studies and feature extraction based on fiducial points. In this paper, a real-time and low-complexity
algorithm for R-peak detection is evaluated on single lead ECG signals. The method is divided in a pre-
processing and a detection stage. First, the pre-processing is based on a double differentiating step, squaring
and moving window integration for QRS complex enhancement. Secondly, the detection stage is based on
a finite state machine (FSM) with an adaptive thresholding for R-peak detection. The tested approach was
benchmarked in a private FieldWiz Database with other commonly used QRS detectors, and later evaluated
in the Physionet Databases (mitdb, nstdb, ltstdb and CinC Challenge 2014). The proposed approach resulted
in a Sensivitity (Se) of 99.77% and Positive Predictive Value (PPV) of 99.18% in the FieldWiz database,
comparable with the evaluated state of the art QRS detectors. In the Physionet Databases, the results showed
to be highly influenced by the QRS waveform, for MIT-BIH (MITDB) achieving a median PPV of 99.79%
and a median Se of 99.52%, with overall PPV of 98.35% and Se of 97.62%. The evaluated method can be
implemented in wearable systems for cardiovascular tracking devices in dynamic use cases with good quality
ECG signals, achieving comparable results to state of the art detectors.
1 INTRODUCTION
The pervasiveness of wearable devices and the easi-
ness with which the data is collected, transferred and
managed has changed numerous industries includ-
ing health care, sports and lifestyle in general. The
healthcare providers, coaches and the end users, ulti-
mately benefit from this additional information in the
decision making process. Amongst the physiological
signals that can be recorded using wearable devices,
the ECG has been widely used in health monitoring,
tracking of sports performance, measuring readiness
and fatigue, as well as, more recently used in biomet-
ric and emotion recognition applications.
The ECG is collected using electrodes, usually
placed on the chest, that detect the electrical changes
arising from the depolarization and repolarization of
the cardiac muscles during each cardiac cycle. From
the time-series of a normal ECG, one can distinguish
3 main components, known as the P wave, QRS com-
plex and T wave.
a
https://orcid.org/0000-0002-2307-8930
b
https://orcid.org/0000-0001-6764-8432
c
https://orcid.org/0000-0003-1320-5024
The accurate R-peak detection is critical to extract
features from the ECG. The most commonly known
feature is the mean Heart Rate (HR), computed from
the average time difference of consecutive beats in a
selected time window. Other features have been re-
cently getting attention, namely, the Heart Rate Vari-
ability (HRV), which derives from the successive time
differences between successive heartbeats. A per-
sons’ normal HR is susceptible to changes due to
intrasubject (e.g. physical or psychological efforts)
and intersubject variability (e.g. sex, age or medi-
cation). Nonetheless, even if the mean HR is kept
constant during a selected time window, the differ-
ences between successive heart beats are likely to os-
cillate around that mean value. The variability of the
R-R intervals (i.e. intervals between consecutive R-
peaks), known as HRV, is also commonly used as a
non-invasive indicator of the autonomic nervous sys-
tem (ANS).
In spite of the complexity of HRV metrics and
their dependency on numerous physiological factors,
diseases, lifestyle and acquisition settings, these have
been getting increased attention. When studying
HRV, fields of interest include emotion recognition
(Lane et al., 2009), stress-levels (Zhu et al., 2019),
302
Rodrigues, T., Silva, H. and Fred, A.
R-peak Detector Benchmarking using FieldWiz Device and Physionet Databases.
DOI: 10.5220/0010147103020309
In Proceedings of the 12th International Joint Conference on Knowledge Discovery, Knowledge Engineering and Knowledge Management (IC3K 2020) - Volume 1: KDIR, pages 302-309
ISBN: 978-989-758-474-9
Copyright
c
2020 by SCITEPRESS – Science and Technology Publications, Lda. All rights reserved

training load (Saboul et al., 2016) and, more recently,
HRV based training revealed to be a promising tool
to achieve increased performance (Javaloyes et al.,
2019). Other studies have also addressed the corre-
lation between HRV metrics and emotional stress in
the context of sports (Laborde et al., 2011).
A recent review (Buchheit, 2014) stated that con-
tradictory findings with regard to HRV are likely to
be related with methodological inconsistencies, unac-
counted confounding factors and/or misinterpretation
of the results, rather than a limitation of these metrics
to inform on the subject physiological status.
In the case of sports and dynamic contexts, R-peak
detectors must be: 1) Robust to noise and artefacts; 2)
Allow real time monitoring; and 3) Should not be de-
pendable of parameters, subjects or QRS morpholo-
gies. Ultimately, the goal of this study is to assess
the feasibility of implementing a real-time R-peak
detector proposed by the authors. In our approach,
the R-peak detection scheme builds upon state-of-the-
art techniques, combining the temporal precision of
a double derivative pre-processing step, with the nu-
merically efficient and highly sensitive exponential
decaying threshold for R-peak detection proposed by
(Guti
´
errez-Rivas et al., 2015). It comprises:
• A pre-processing stage, consisting of a double
differentiating step, squaring, and moving win-
dow integration for the QRS complex enhance-
ment (see Figure 1);
• A numerically efficient R-peak detection step, as
proposed by (Guti
´
errez-Rivas et al., 2015), based
on a Finite State Machine (FSM), comprising a
dynamic threshold for the detection of the R-peak,
encompassing a free parameter Pth (for details see
(Guti
´
errez-Rivas et al., 2015)). While in the origi-
nal work the threshold value depended on the am-
plitudes of all previously detected R peaks, in this
work we will restrict this observation window to
the previous 20 R-peaks.
The organization of the paper is the following,
in Section 2 we present some initial considerations
about the QRS detectors. In Section 3 the FieldWiz
device specifications and preliminary signal quality
tests with different electrode settings are presented,
together with the FieldWiz private database. In Sec-
tion 4 the private database is used for benchmarking,
together with the common ECG databases from Phy-
sionet. Lastly, Section 5 encloses the conclusion, dis-
cussion and future work.
2 BACKGROUND
Real-time QRS detection was first introduced by Pan
and Tompkins (Pan and Tompkins, 1985) in 1985;
since then, several algorithms have proposed modi-
fications of this method. These approaches consist of
a pre-processing step for QRS enhancement, followed
by a decision stage. The enhancement stage usually
consists of amplitude based, single or double deriva-
tives, digital filters, wavelet or Hilbert transforms, or a
combination of these. Next, the detection step is com-
monly done using threshold-based and matched filters
(Elgendi et al., 2014). Some combinations of these
methods are either computationally expensive, hence
not suitable for real time applications, or require a
learning phase. Thus, some of the most commonly
used QRS complex detectors are the original Pan
and Tompkins (Pan and Tompkins, 1985), Hamilton
(Hamilton, 2002), Christov (Christov, 2004), modi-
fied Engelse and Zeelenberg (Lourenc¸o et al., 2012)
and Kalidas (Kalidas and Tamil, 2017).
The problems concerning the QRS complex de-
tection arise from the different types of noise that can
be present in the ECG signal or from the intersubject
physiological variability that results from pathologies
e.g. arrhythmia or atrial fibrillation. In the acquisi-
tion setting, especially with wearable devices under
dynamic conditions, the types of noise include base-
line wandering and loss of the electrodes contact due
to movement (Acharya et al., 2007). In spite of the
recent advances in the field of QRS detection, deriva-
tive and digital filters for QRS complex enhancement,
combined with an adaptive threshold decision rule,
are still the most simple, computationally efficient
and reliable detection (Elgendi et al., 2014).
The QRS detection method should be selected
based on the signal quality, but also based on the type
of study one wants to perform, whether the interest
relies in e.g. HR, HRV or R-peak amplitude modula-
tion (RAMP). This is particular important, since most
of the QRS detectors have low sensitivity for detect-
ing the R-peak (Porr and Howell, 2019). In this study,
from the different detectors tested, only the modified
Engelse and Zeelenberg (Lourenc¸o et al., 2012) and
stationary wavelet transform based for noise removal
(Kalidas and Tamil, 2017) achieved accurate R-peak
detection.
Nonetheless, the above-mentioned methods have
limitations. For example, Engelse and Zeelenberg
(Lourenc¸o et al., 2012) is not robust to noise and dy-
namic contexts. In the method by Kalidas (Kalidas
and Tamil, 2017), the decision step is similar to the
decision rule in (Pan and Tompkins, 1985), with the
enhancement of the QRS being based on stationary
R-peak Detector Benchmarking using FieldWiz Device and Physionet Databases
303

Figure 1: Pre-processing step used in our algorithm. The value N=5 was used in all experimental results.
wavelet transform for noise removal for quasi real-
time R-peak detection. Apart from these, in com-
mercial software, the QRS detection is usually ex-
tracted using adaptations of the Pan-Tompkins (Tar-
vainen et al., 2014). The modified Pan-Tompkins with
local maximum search is used in most commercial
software, where the R-peak is detected once the QRS
complex is detected. The latter is the gold standard
for HR monitoring in sports.
3 FieldWiz DEVICE
3.1 Specifications
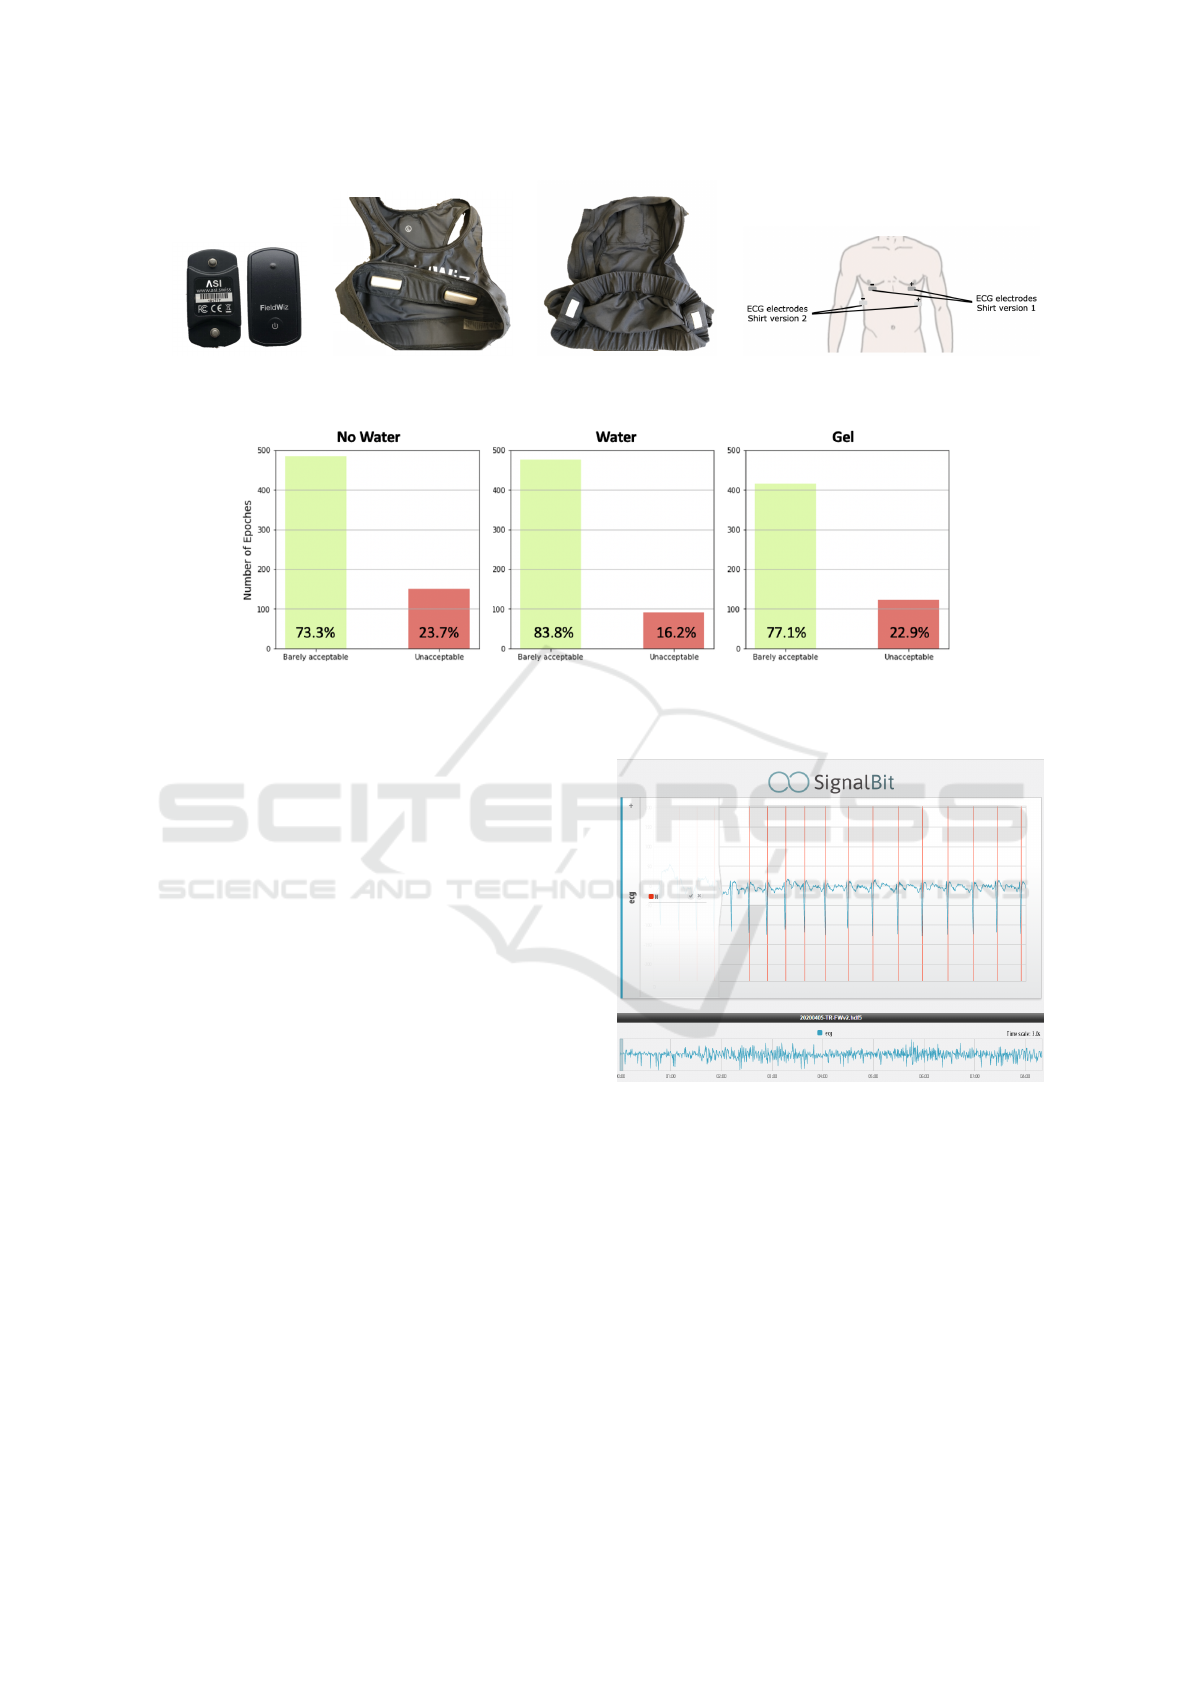
The FieldWiz device, shown in Figure 2 a), has a
16-bit ADC converter, the ECG signal is sampled at
250 Hz, stored in memory and extracted a posteri-
ori for analysis. It enables ECG data acquisition un-
der different dynamic conditions (e.g. running and
weightlifting), while using alternative setups. The dif-
ferent setups consist in a combination of the FieldWiz
device with two iterations of the Wiz connected shirt,
both depicted in Figure 2 b) and c), as well as the re-
spective electrode placement shown in Figure 2 d).
The electrode pads from the shirt Version 1 are
placed on the chest, under the pectoral muscles, while
the placement of the shirt Version 2 is done in a lat-
eral position. Improvements from the latter version
include the different conductive fabric, the position-
ing of the electrode pads and the elastic fit. The im-
proved lead placement position shown in Figure 2 d)
is known to be important in reducing motion noise
and movement artifacts, in particular, under extreme
conditions, where artifacts from muscle contractions
and movement are a strong source of noise contami-
nation (Francis, 2016).
3.2 Signal Quality Assessment
Initially, experiments were performed using a com-
bination of the FieldWiz with both connected shirts
described in Section 3.1 in order to assess the ECG
quality.
Next, the signal quality was evaluated using an
SQI based on simple heuristic fusion described in
(Zhao and Zhang, 2018). This method was chosen
since it showed good performance in the selected Phy-
sionet Databases, and it makes use of common signal
quality indexes described in the literature. It adopts
four synthesized signal quality indexes: 1) Consis-
tency of the QRS complex detection using different
detectors (qSQI); 2) Power of the QRS frequency
band (pSQI); 3) Signal kurtosis (kSQI); and 4) Power
of the baseline frequency band (basSQI).
Based on simple fusion of the four heuristic met-
rics, each SQI (qSQI, pSQI, kSQI and basSQI) is
evaluated and classified as either ’Optimal, Suspi-
cious or Unqualified’ with respect to certain pre-
computed thresholds. Later, from the classification of
each computed SQI, the 10 seconds ECG segments
were characterized as either Excellent (E), Barely
Acceptable (B) and Unacceptable (U), explained in
(Zhao and Zhang, 2018).
The results for the three signal acquisitions with
different experimental settings are shown in Figure
3, consisting of using the electrodes dry, with wa-
ter, or with electrode gel. From these, the applica-
tion of water and electrode gel showed comparatively
better results when compared to the direct contact of
the pads with the skin. Additionally, the use of elec-
trode gel showed consistently saturation of the signal,
likely due to the lack of skin/electrode adhesion. As
such, the FieldWiz Private Database described next,
was created using the pads moisturized prior to use.
Similarly, in the context of sports, increased perspira-
tion resulted in higher signal to noise ratio (SNR).
3.3 FieldWiz Private Database
Five recordings (N=5) from four different subjects us-
ing the FieldWiz device combined with the Wiz con-
nected shirt (FWv2) and a chest strap (Belt). La-
beled as 20200405-TR-FWv2.txt, 30 min running;
20200413-JM-FWv2.txt, 60 min running; 20200421-
JT-FWv2.txt, 90 min trail running; 20200505-TR-
Belt.txt, 50 min high intensity interval training (HIIT);
20200508-SS-Belt.txt: 40 min running. The five
recordings accounted for a total of 39817 annotated
R-peaks. The acquisitions were made in different
days and conditions, taking the following precautions:
1) Applied water to the electrode pads prior to the ac-
tivity; 2) Using a connected shirt or chest strap of ap-
KDIR 2020 - 12th International Conference on Knowledge Discovery and Information Retrieval
304
a) b) c) d)
Figure 2: Experimental acquisition setup. (a) FieldWiz device; (b) Wiz connected Shirt, Version 1; (c) Wiz connected Shirt,
Version 2; and d) Electrodes placement for both shirt versions(FieldWiz, 2020).
Figure 3: ECG quality assessment. Signal acquired using the FieldWiz device and the Wiz connected shirt Version 2, under
different settings. a) Without application of water to the electrode pads; b) Moisturizing the pads with water; and c) Applying
electrode gel.
propriate size.
The raw ECG was recorded and stored in the de-
vice and was later recovered and saved as HDF5 type
files. The file format was chosen in order to in-
terface with the signal annotating software SignalBit
(Lourenc¸o et al., 2014) used for R-peaks annotations;
the graphical user interface (GUI) of the annotation
tool is shown in Figure 4. Initially, the R-peaks were
annotated automatically using the approach by Kali-
das (Kalidas and Tamil, 2017) and stored as an HDF5
file. This approach was chosen for its high temporal
precision, as described in (Porr and Howell, 2019).
Lastly, the annotations were visually inspected by
a cardio-pneumologist technician using the Signal-
Bit web-based annotation tool and the automatically
generated R-peaks annotations were verified and cor-
rected. The acceptance window of 5 samples, corre-
sponding to 20 ms, in Section 4.1 was chosen, since
the automatic detection by Kalidas led to slight impre-
cision’s from the inflexion point of the QRS complex.
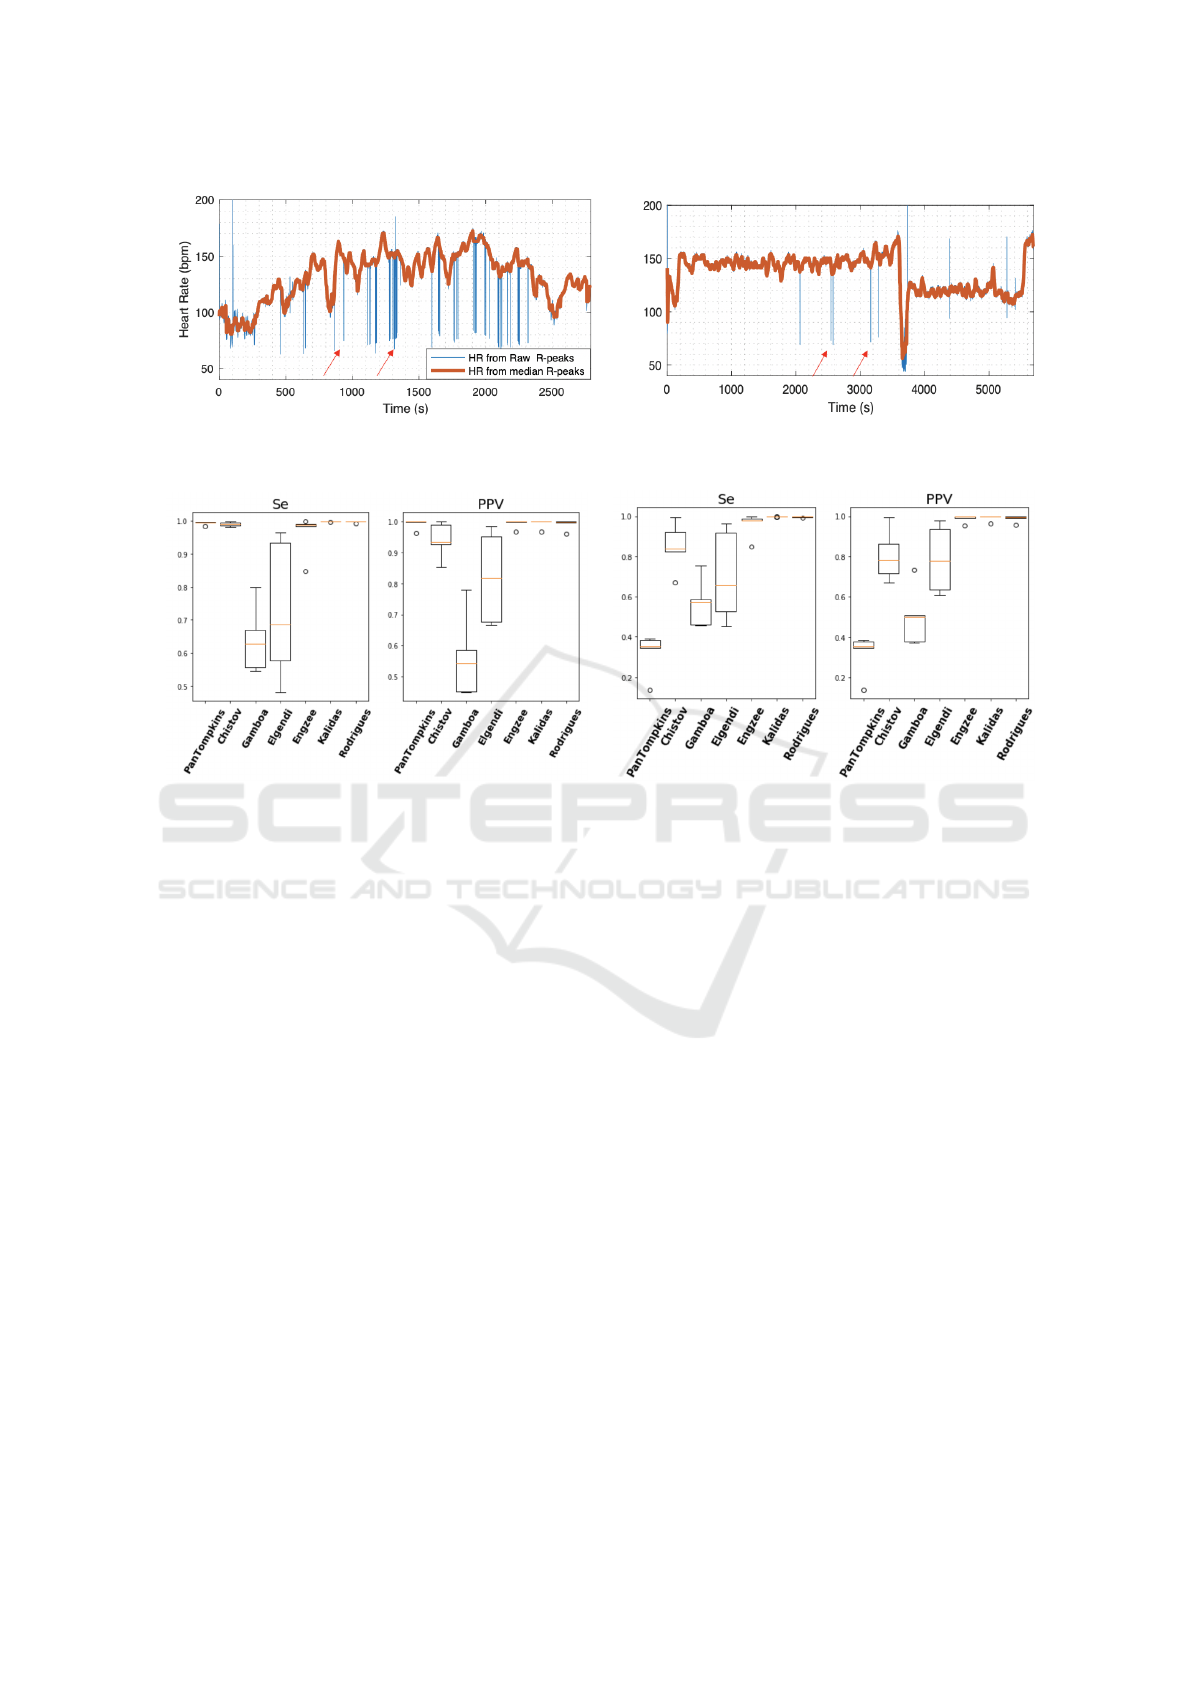
The HR estimations using the proposed approach
with the selected parameters are shown in Figure 5,
directly from the detected R-peaks and using a mov-
ing median of 15 samples. In Figure 5 a) and b), the
missed R-peaks may occur when the signal quality is
poor, which may happen using either the chest strap
or the Wiz connected shirt.
Figure 4: SignalBit web-application environment(Lourenc¸o
et al., 2014). Example of raw ECG (blue) and normal sinus
rhythm R-peaks (vertical red lines).
4 EXPERIMENTAL RESULTS
4.1 FieldWiz Database Benchmark
In this subsection, the QRS detectors described in
Section 2, and the proposed approach were evalu-
ated in the FieldWiz Private Database. The Physionet
wrapper WFDB Toolbox (Silva and Moody, 2014)
was used to compare the benchmarked annotations
with the detected QRS complexes from the different
R-peak Detector Benchmarking using FieldWiz Device and Physionet Databases
305
a) b)
Figure 5: HR estimation from the detected instantaneous R-peaks (blue) and moving median of 15 samples (orange). Missed
R-peaks highlighted with the red arrows. a) Recording: 20200505-TR-Belt and b) Recording: 20200421-JT-FWv2.
a) b)
Figure 6: Evaluation of the different QRS detectors: PanTompkins, Christov, Gamboa, Elgendi, Engzee, Kalidas and Ro-
drigues (proposed approach). Se and PPV using FieldWiz dataset for a detection window of a) 100 ms and b) 20 ms.
detectors. First, the acceptance time window of 100
ms was chosen in order to evaluate the different de-
tectors ability to detect QRS complexes in the ECG
signals. This was followed by a 20 ms acceptance
window, to evaluate the precision of R-peak detec-
tion. The results are shown in Figure 6 for the re-
spective 100 ms, Figure 6 a), and 20 ms, Figure 6 b),
time windows. The signals with inverted R-wave, as a
result of the lead placement, were reverted in order to
account for the limitations of Engzee (Lourenc¸o et al.,
2012).
From Figure 6 a), when using a wider detection
window of 100 ms, any of the methods by PanTomp-
kins, Christov, Kalidas and the proposed method
achieved Se > 99%, Engzee equal to 96% while El-
gendi and Gamboa showed the worst performance
at 73% and 64%. The registered PPV > 99% in
PanTompkins, Engzee, Kalidas and the proposed ap-
proach, Christov with 94% and underperforming are
Elgendi and Gamboa at 82% and 56%.
Overall, the results showed that the signal quality
using the combination of the FieldWiz and the Wiz
connected shirt or chest strap, under the dynamic con-
ditions studied is acceptable for QRS detection using
any of the previous methods PanTompkins, Kalidas or
the proposed approach with Se and PPV > 99%. In
Figure 6 b), considering an acceptance window of 20
ms, the Kalidas and the proposed approach achieved
good results, with Se and PPV > 98%, while the
PanTompkins, Christov and Gamboa resulted in de-
creased performance for both Se and PPV.
Ultimately, the method by Kalidas, the proposed
approach or a combination of PanTompkins with an
additional local search for the inflexion point, would
result in reliable R-peak detection. In Figure 5, the
HR estimations computed from the instantaneous RR-
intervals are shown for different scenarios, weightlift-
ing in a) and run in b). The R-Peaks were detected
using the proposed method.
4.2 Physionet Databases Benchmark
The WFDB Toolbox(Silva and Moody, 2014) was
used to extract the ECG signals and database anno-
tations from MIT-BIH Arrythmia Database (mitdb)
(Moody and Mark, 2001), MIT-BIH Noise Stress Test
Database (nstdb) (Moody et al., 1984), European ST-
T Database (ltstdb) (Taddei et al., 1992) and CinC
Challenge 2014 (Goldberger et al., 2000). All non-
beat annotations were excluded as detailed in (Moody
KDIR 2020 - 12th International Conference on Knowledge Discovery and Information Retrieval
306
a) b)
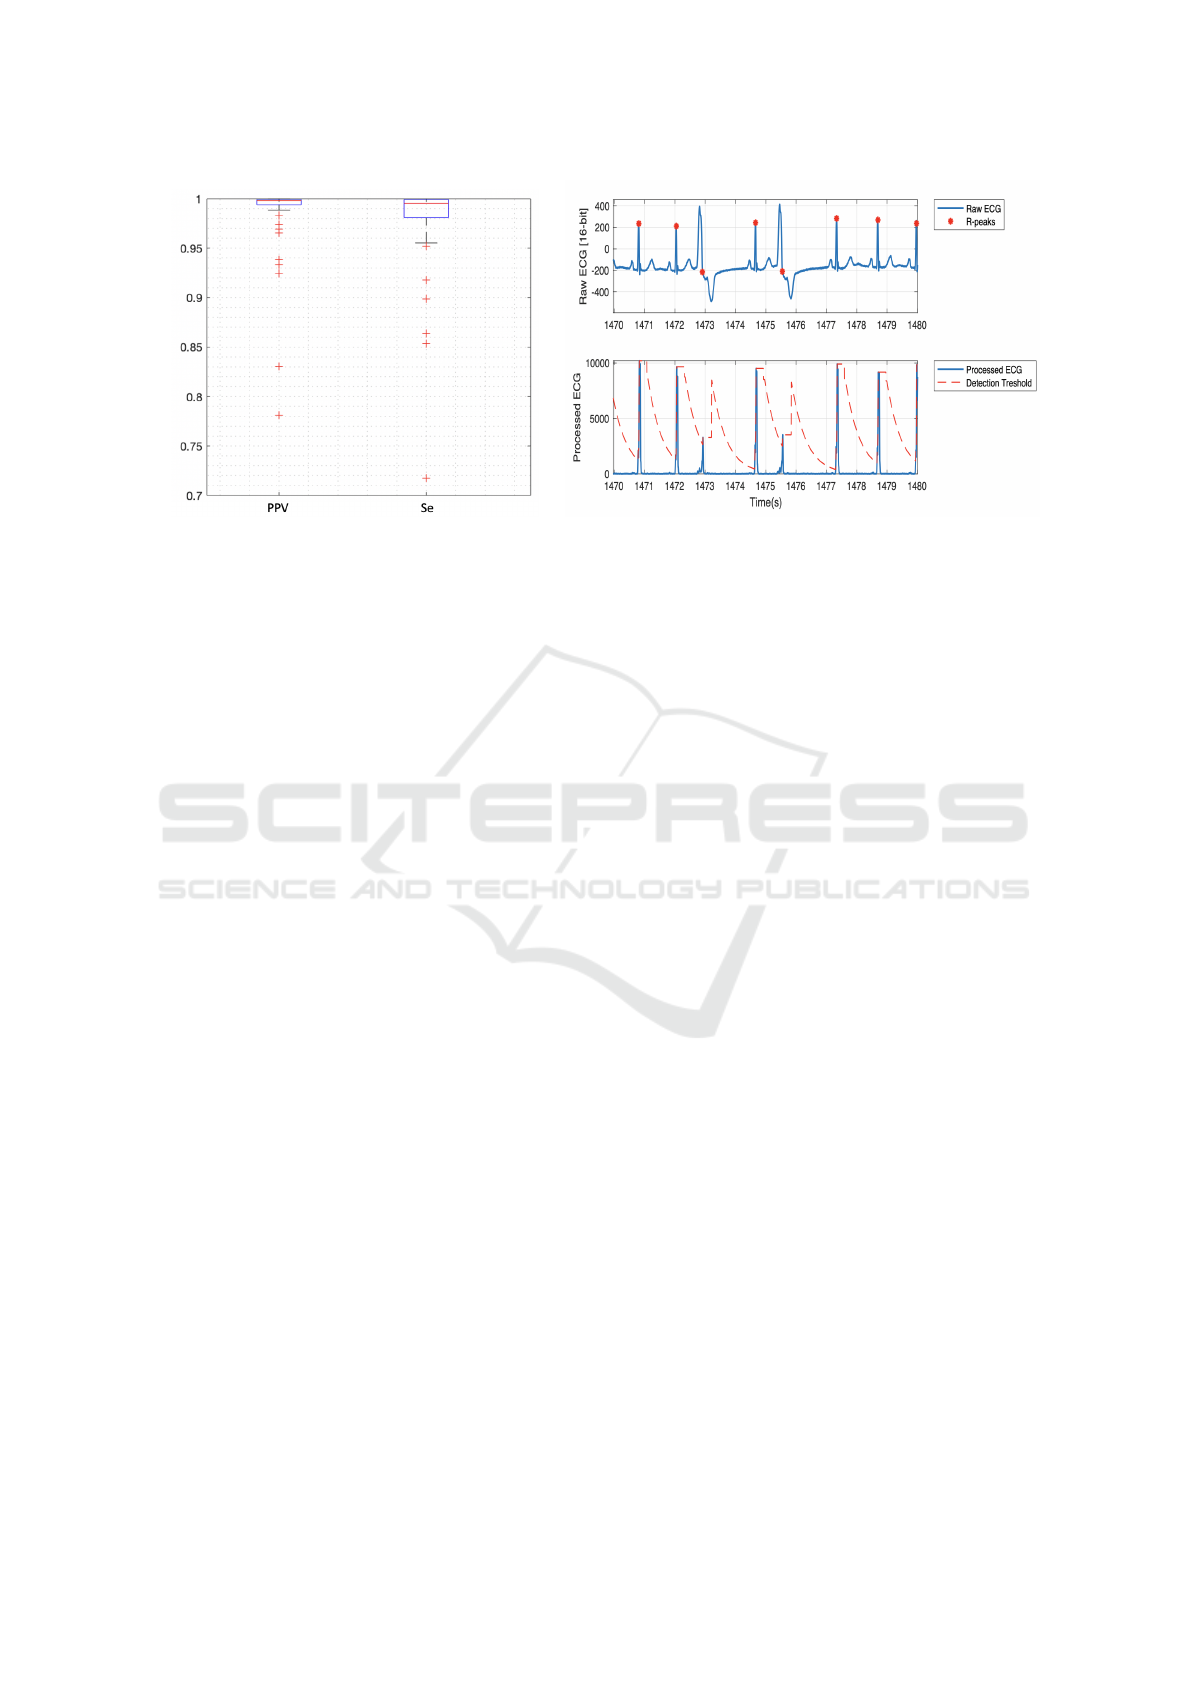
Figure 7: Evaluation of the R-peak detector using MIT-BIH Arrhythmia Database (mitdb). a) PPV and Se boxplot of the 48
records with respective median (red line), 25th and 75th percentile (black lines) and outliers ( red ’+’ symbol). b) Application
of the R-peak detector in a 10 seconds ECG segment of Record ID: 119. Top: Raw ECG signal (blue) and detected R-peaks
(red dots); and Bottom: Processed ECG (blue) and detection threshold (red dashed line).
et al., 2001) and an error margin of 100 ms was con-
sidered between the reference and the detected peak.
The ECG morphology is characterized by vari-
ability, especially between patients and healthy sub-
jects, which might lead to imprecisions during R-
peak detection. A recent review on ten of the most
computationally efficient QRS detectors (Liu et al., )
showed that the accuracy of derivative based detec-
tors did not decline significantly on the arrhythmia
database. However, when using methods based on
double derivatives, each recording should be evalu-
ated individually for clinical applications, since the
PPV and Se values might decline drastically for some
waveforms, as shown in Figure 7 a).
From the sensitivity analysis, the records with ab-
normal morphologies revealed to be problematic for
the Se and PPV values. Thus, for the Physionet
benchmarking, the parameters were chosen to be N =
5 and P
th
= 3. The choice of N was based on the slope
of the QRS, while P
th
was chosen from the compro-
mise between PPV and Se in resting conditions.
The results showed to vary widely depending on
the QRS morphology; one example of such influence
of the ECG waveform in the processed ECG is pre-
sented in Figure 7 b). In the case of MIT-BIH (mitdb),
PPV (median = 99.79 %, outliers < 95 % Record id:
108, 203, 207, 228, 232) and Se (median = 99.52%,
outliers < 95 % Record id: 106, 203, 208, 221, 223).
For the remaining databases (challenge 2014, lt-
stdb, mitdb and nstdb) the results are shown in Table
1 with respective TP, FN, FP, PPV and Se, exhibiting
comparable results to state of the art detectors.
5 CONCLUSIONS
In this paper, a modified method for R-peak detection
is evaluated. The approach combines a double deriva-
tive pre-processing step with a FSM based decision
rule. It has low computational load, low memory allo-
cation and it is simple to implement in embedded sys-
tems for cardiovascular monitoring during sports. It is
robust to baseline wander, abrupt drifts and enhanced
T-wave or other low frequency noise. On the other
hand, it is sensitive to high frequency noise, atypi-
cal ECG waveforms and arrhythmia onsets, thus false
detections should be further processed for clinical ap-
plications.
Experimental results over the FieldWiz database
highlight advantages of the proposed approach, in-
cluding: 1) Robustness to different R-wave polari-
ties; 2) The double derivative step increases R-peak
precision in comparison to other FSM approaches
(Guti
´
errez-Rivas et al., 2015); 3) The Sensitivity of
the method is increased for dynamic, fast changing
heart rates and R-peak amplitudes.
Limitations of the method include: 1) The choice
of the parameter P
th
was optimized in a private Field-
Wiz database (N
Sub jects
= 5), accounting for HR vary-
ing from 60 bpm to 190 bpm, given the use case of the
device; 2) Assumption of the individual ECG wave-
forms to be invariant, as a result, the R-peak is shown
to be located in the same position of the ECG wave-
form for every heart beat cycle; however, in patho-
logical conditions with time varying QRS morpholo-
gies, the Se and PPV might be affected, as well as
the temporal precision of the R-peak detection; and
3) Lastly, there is a lack of validation of the different
R-peak Detector Benchmarking using FieldWiz Device and Physionet Databases
307

Table 1: Summary of the results obtained (TP, FP, FN, PPV in % and Se in %) using the proposed algorithm in the considered
databases. For benchmarking we used Pth = 3 & N = 5 as parameters of the algorithm.
Database Sampling Rate (Hz) TP FP FN PPV (%) Se (%)
Challenge 2014 120-1000 71529 332 884 98.88 99.52
ST-T Database (ltstdb) 250 782483 13712 8082 98.15 98.79
MIT-BIH (mitdb) 360 106590 1758 2904 98.35 97.62
MIT-BIH (nstdb) 360 23957 2907 1633 96.23 98.72
QRS detector methods under highly dynamically ac-
tivities, as a result of the shortage of publicly available
ECG databases with data acquired in such conditions.
Furthermore, the confidentiality of the implemented
methods in the common commercialized wearable de-
vices raises concerns with respect to the R-peaks de-
tection reliability. This paper explores the use case
limitations of the current approaches, and validates
an alternative approach that can be used for R-peak
detection.
ACKNOWLEDGEMENTS
The authors would like to express their gratitude
to Joana Santos, cardiopneumologist, for the man-
ual verification and annotation of the electrocar-
diograms R-peaks. We would also like to thank
the embedded software engineer at ASI, Sirisack
Samoutphonh, for the support with the implementa-
tion of the proposed method in the embedded sysmte.
This work has been partially funded by Instituto de
Telecomunicac¸
˜
oes (IT) via FCT/MCTES through na-
tional funds and when applicable co-funded EU funds
under the project UIDB/50008/2020.
REFERENCES
Acharya, U. R., Krishnan, S. M., Spaan, J. A., and Suri,
J. S. (2007). Advances in cardiac signal processing.
Springer.
Buchheit, M. (2014). Monitoring training status with HR
measures: Do all roads lead to Rome? Frontiers in
Physiology, 5(23):1–20.
Christov, I. I. (2004). Real time electrocardiogram QRS de-
tection using combined adaptive threshold. BioMedi-
cal Engineering Online, 3(28):1–9.
Elgendi, M., Eskofier, B., Dokos, S., and Abbott, D. (2014).
Revisiting QRS detection methodologies for portable,
wearable, battery-operated, and wireless ECG sys-
tems. PloS one, 9(1).
FieldWiz (2020). FieldWiz device, Advanced Sports Instru-
ments - ASI.
Francis, J. (2016). ECG monitoring leads and special
leads. Indian Pacing and Electrophysiology Journal,
16(3):92–95.
Goldberger, A. L., Amaral, L. A., Glass, L., Hausdorff,
J. M., Ivanov, P. C., Mark, R. G., Mietus, J. E., Moody,
G. B., Peng, C.-K., and Stanley, H. E. (2000). Phys-
ioBank, PhysioToolkit, and PhysioNet: components
of a new research resource for complex physiologic
signals. Circulation, 101(23):e215–e220.
Guti
´
errez-Rivas, R., Garc
´
ıa, J. J., Marnane, W. P.,
and Hern
´
andez, A. (2015). Novel real-time low-
complexity QRS complex detector based on adaptive
thresholding. IEEE Sensors Journal, 15(10):6036–
6043.
Hamilton, P. (2002). Open source ECG analysis. Computers
in Cardiology, 29:101–104.
Javaloyes, A., Sarabia, J. M., Lamberts, R. P., and Moya-
Ramon, M. (2019). Training prescription guided by
heart-rate variability in cycling. International Journal
of Sports Physiology and Performance, 14(1):23–32.
Kalidas, V. and Tamil, L. (2017). Real-time QRS de-
tector using stationary wavelet transform for auto-
mated ECG analysis. In Proc. of the IEEE Int’l Conf.
on Bioinformatics and Bioengineering (BIBE), pages
457–461.
Laborde, S., Br
¨
ull, A., Weber, J., and Anders, L. S. (2011).
Trait emotional intelligence in sports: A protective
role against stress through heart rate variability? Per-
sonality and Individual Differences, 51(1):23–27.
Lane, R. D., McRae, K., Reiman, E. M., Chen, K., Ah-
ern, G. L., and Thayer, J. F. (2009). Neural correlates
of heart rate variability during emotion. Neuroimage,
44(1):213–222.
Liu, F., Liu, C., Jiang, X., Zhang, Z., Zhang, Y., Li, J., and
Wei, S. Performance analysis of ten common QRS
detectors on different ECG application cases. Journal
of Healthcare Engineering, 2018.
Lourenc¸o, A., da Silva, H. P., Lourenc¸o, R., Leite, P., and
Fred, A. (2012). Real time electrocardiogram segmen-
tation for finger based ECG biometrics. In Proc. Int’l
Conf. on Bio-inspired Systems and Signal Processing
(BIOSIGNALS), pages 49–54.
Lourenc¸o, A., Pl
´
acido da Silva, H., Carreiras, C., Priscila
Alves, A., and Fred, A. L. N. (2014). A web-based
platform for biosignal visualization and annotation.
Multimedia Tools and Applications, 70:433–460.
Lourenc¸o, A., Silva, H., and Fred, A. (2012). ECG-based
biometrics: A real time classification approach. In
KDIR 2020 - 12th International Conference on Knowledge Discovery and Information Retrieval
308

Proc. of the IEEE Int’l Workshop on Machine Learn-
ing for Signal Processing (MLSP), pages 1–6.
Moody, G. B. and Mark, R. G. (2001). The impact of the
MIT-BIH arrhythmia database. IEEE Engineering in
Medicine and Biology Magazine, 20(3):45–50.
Moody, G. B., Mark, R. G., and Goldberger, A. L. (2001).
Physionet: a web-based resource for the study of
physiologic signals. IEEE Engineering in Medicine
and Biology Magazine, 20(3):70–75.
Moody, G. B., Muldrow, W., and Mark, R. G. (1984). A
noise stress test for arrhythmia detectors. Computers
in cardiology, 11(3):381–384.
Pan, J. and Tompkins, W. (1985). A real-time QRS de-
tection algorithm. IEEE Transactions on Biomedical
Engineering, 32(3):230–236.
Porr, B. and Howell, L. (2019). R-peak detector stress
test with a new noisy ECG database reveals signifi-
cant performance differences amongst popular detec-
tors. bioRxiv, page 722397.
Saboul, D., Balducci, P., Millet, G., Pialoux, V., and Hau-
tier, C. (2016). A pilot study on quantification of train-
ing load: The use of HRV in training practice. Euro-
pean Journal of Sport Science, 16(2):172–181.
Silva, I. and Moody, G. (2014). An open-source toolbox
for analysing and processing PhysioNet databases in
MATLAB and octave. Journal of Open Research Soft-
ware, 2.
Taddei, A., Distante, G., Emdin, M., Pisani, P., Moody, G.,
Zeelenberg, C., and Marchesi, C. (1992). The eu-
ropean ST-T database: standard for evaluating sys-
tems for the analysis of ST-T changes in ambula-
tory electrocardiography. European Heart Journal,
13(9):1164–1172.
Tarvainen, M. P., Niskanen, J.-P., Lipponen, J. A., Ranta-
Aho, P. O., and Karjalainen, P. A. (2014). Ku-
bios HRV–heart rate variability analysis software.
Computer Methods and Programs in Biomedicine,
113(1):210–220.
Zhao, Z. and Zhang, Y. (2018). SQI quality evaluation
mechanism of single-lead ECG signal based on simple
heuristic fusion and fuzzy comprehensive evaluation.
Frontiers in Physiology, 9:727.
Zhu, J., Ji, L., and Liu, C. (2019). Heart rate variabil-
ity monitoring for emotion and disorders of emotion.
Physiological Measurement, 40(6):064004.
R-peak Detector Benchmarking using FieldWiz Device and Physionet Databases
309
