
Evaluation of the Foot Performance in “Single Leg Squat” Test of
Female Athletes using Smart Socks
Anna Januskevica
1
, Guna Semjonova
1
, Alexander Oks
2
, Alexei Katashev
3
and Peteris Eizentals
3
1
Department of Morphology, Faculty of Medicine, Riga Stradins University, Dzirciema 16, Riga, Latvia
2
Institute of Design and Technology, Riga Technical University, Kalku 1, Riga, Latvia
3
Institute of Biomedical Engineering and Nanotechnology, Riga Technical University, Kalku 1, Riga, Latvia
Keywords: Foot Performance, “Single Leg Squat” Test, Plantar Pressure Measurement, Smart Socks, Injury Prevention.
Abstract: Increased plantar pressure on the medial side of the plantar surface of the foot in female athletes is one of the
risk factors for lower extremity injuries. Functional tests single-leg squat tests (SLST), are one of the ways to
assess changes in foot plantar pressure. The main disadvantage of clinical functional tests is their subjectivity.
Moreover, as a rule, these tests are performed under laboratory conditions, which is expensive and time-
consuming. This paper demonstrates the evaluation of lower foot behaviour in several SLST variations by the
DAid Pressure Sock System (DPSS). The research was based on the cross-sectional study, where a group of
healthy female athletes was requested to perform SLST exercises under the supervision of a physiotherapist,
while simultaneously the feet plantar pressure was measured with the DPSS. Based on the observations of the
physiotherapist, the participants were sorted in the test group and control group, depending on their ability to
perform the exercises with or without increased inversion of the foot. Meanwhile, the application of the DPSS
provided an estimate of the lateral-medial deviations of the centre of plantar pressure (COP) for evaluation of
the feet functionality during the SLST. A clear correlation between the medial shift of the COP value, obtained
from the DPSS measurement, and the physiotherapist’s decision on the quality of the SLST was observed. It
was observed that the average COP value for the test group was shifted medially, while for the control group
the position of COP was shifted laterally. Therefore, the application of DPSS with SLST has a potential for
athlete functional testing, as well as for the development of feedback-based training aid in the training
environment to help coaches and athletes to monitor the accuracy of the foot position in various squat
exercises.
1 INTRODUCTION
One of the risk factors for lower extremity injuries in
female athletes is altered lower limb biomechanics,
characterized by the redundant increase of the
pressure on the medial side of the foot plantar surface
(Numata et al., 2018). Such alteration could cause
overuse injuries, such as tibial stress syndrome
(Razak et al., 2012; Neal et al., 2014; Buldt et al.,
2018), iliotibial syndrome, m. tibialis posterior
dysfunction, anterior cruciate ligament rupture
(Kagaya et al., 2015; Ugalde et al., 2015; Hughes et
al., 2019) and patellofemoral pain syndrome, and
plantar fasciitis (Razak et al., 2012; Neal et al., 2014;
2015; Buldt et al., 2018).
In clinical practice, to assess the risk of lower
limb injuries and to assess the potential risk factors
associated with future injuries, lower limb functional
tests are used. Among them is a variety of single leg
squat tests (SLST) used in periodic health
examinations in the clinical setting to identify
problems of the lower extremity biomechanics and
reveal incorrect movement patterns (Ugalde et al.,
2015; Khuu et al., 2016; Kagaya et al., 2015; Hughes
et al., 2019; Khuu et al., 2019).
The typical distorted movement patterns during
SLST include increased internal rotation and
adduction of the hip joint, internal rotation of the
lower leg, a medial deviation of the knee joint or knee
position of the knee joint, and increased foot
pronation, also known as dynamic valgus position
(Ugalde et al., 2015; Khuu et al., 2016; Wyndow et
al., 2016; Kagaya et al., 2017; Hughes et al., 2019).
The main drawback of the SLST is that the tests
are based on subjective visual assessment. This limits
observable parameters and makes test results depend
Januskevica, A., Semjonova, G., Oks, A., Katashev, A. and Eizentals, P.
Evaluation of the Foot Performance in “Single Leg Squat” Test of Female Athletes using Smart Socks.
DOI: 10.5220/0010146701610168
In Proceedings of the 8th International Conference on Sport Sciences Research and Technology Support (icSPORTS 2020), pages 161-168
ISBN: 978-989-758-481-7
Copyright
c
2020 by SCITEPRESS – Science and Technology Publications, Lda. All rights reserved
161
on the experience of the involved clinician. Also,
functional tests are generally performed under
laboratory/clinic conditions, which can be
comparatively time-consuming and expensive.
Development of reliable lower limb movement
tracking systems for sports, medicine, or
rehabilitation could enable the measurement of limb
movement, identification of altered movement
patterns, and analysis of long-term data, and,
therefore, could help to significantly reduce the risk
of lower limb injuries (Kianifar et al., 2017; Khuu et
al., 2019). One such system, DAid Pressure Sock
System (DPSS), is based on the application of entirely
textile smart socks with integrated knitted-in plantar
pressure sensors (Oks et al., 2016, Eizentals et al.,
2019). DPSS was demonstrated to be an effective tool
for gait analysis in a wide range of gait types and
velocities (walking, race walking, jogging, fast
running) (Oks et al., 2017). One of the main
advantages of the DPSS is the ability to be used as a
gait monitoring system both barefoot and with
different types of shoes.
The aim of the present research was an
assessment of the applicability of the DPSS for
objective evaluation of the feet functionality during
an SLST through quasi-static measurements of the
foot plantar pressure. A modified version of the center
of pressure (COP) calculation was applied for
quantification of the characteristic plantar pressure
during the SLST exercise. The obtained result
demonstrated that a clear difference in the
characteristic COP measurement can be observed if
the SLST exercise is performed with increased foot
pronation when compared to the result from the
control group.
2 MATERIALS AND METHODS
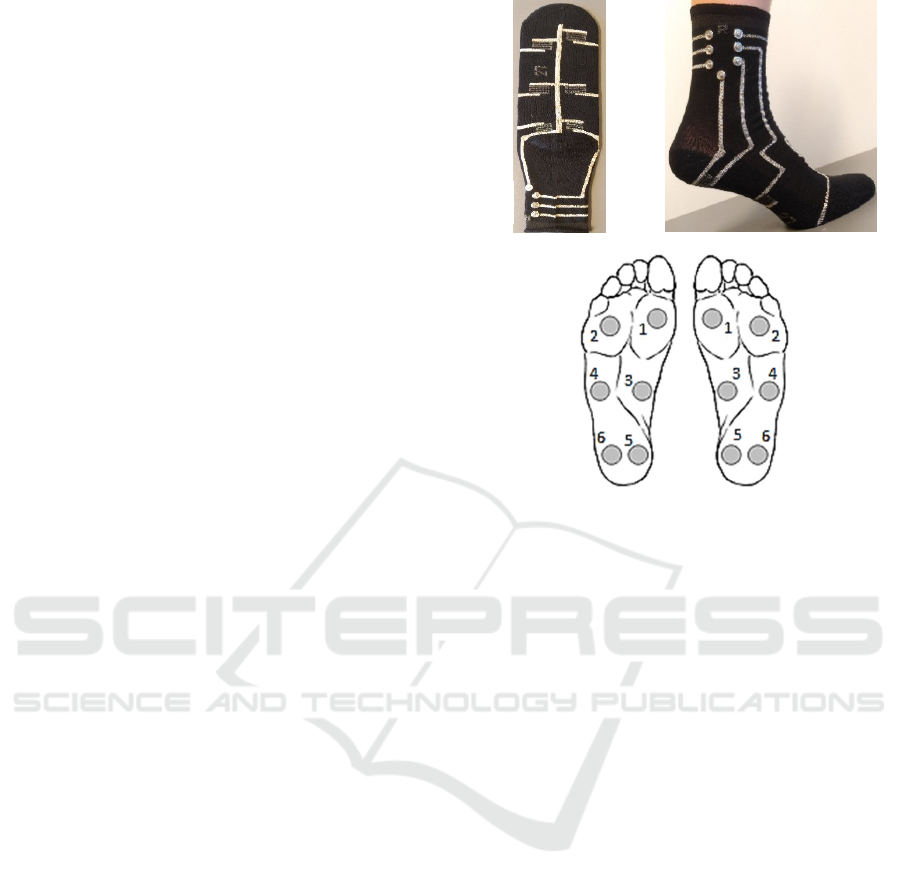
2.1 DAid Pressure Sock System
The DAid Pressure Sock System, used in the present
research, consists of pair of socks with 6 pressure
sensors, knitted into the sole part of each sock: two on
the heel, two under the arch, and two under the
metatarsals (Fig.1a). Such positioning of sensors
enables monitoring of temporal gait characteristics as
well as detection of the supination/ pronation of lower
feet. Conductive pathways are designed to provide
the connection between sensors and the data
acquisition units. The sampling frequency of data
acquisition is up to 200 Hz. A more comprehensive
description of the system is presented in (Eizentals et
al., 2019, Oks et al., 2019).
Figure 1: Smart Sock. a-sole part, b-conductive pathways
with contact snaps, c - placement of sensors (Eizentals et
al., 2019).
2.2 Participants
The study involved volunteers – healthy female
athletes from the FS Metta football club. The
inclusion criteria were age (range 18-25 years) and
experience in sports (at least 10 years). The exclusion
criteria were health-related issues, including:
- Pain in any knee joint during movement
- Lower limb disease, deformity, injury, and/or
surgery in the last 12 months.
- Vestibular disorders
On the base of these criteria, 20 participants were
included in the study. The mean age of the
participants was 20.4 years (SD 2.1) years, the mean
body mass index (BMI) was 21.0 (SD 1.7). Informed
consent was obtained from all individual participants
included in the study. The study was conducted
following ethical standards comparable to the
Declaration of Helsinki and its later amendments. The
study protocol was approved by the Ethics Committee
of Riga Stradins University (6-2/11, 19.12.2019).
a
b
c
icSPORTS 2020 - 8th International Conference on Sport Sciences Research and Technology Support
162
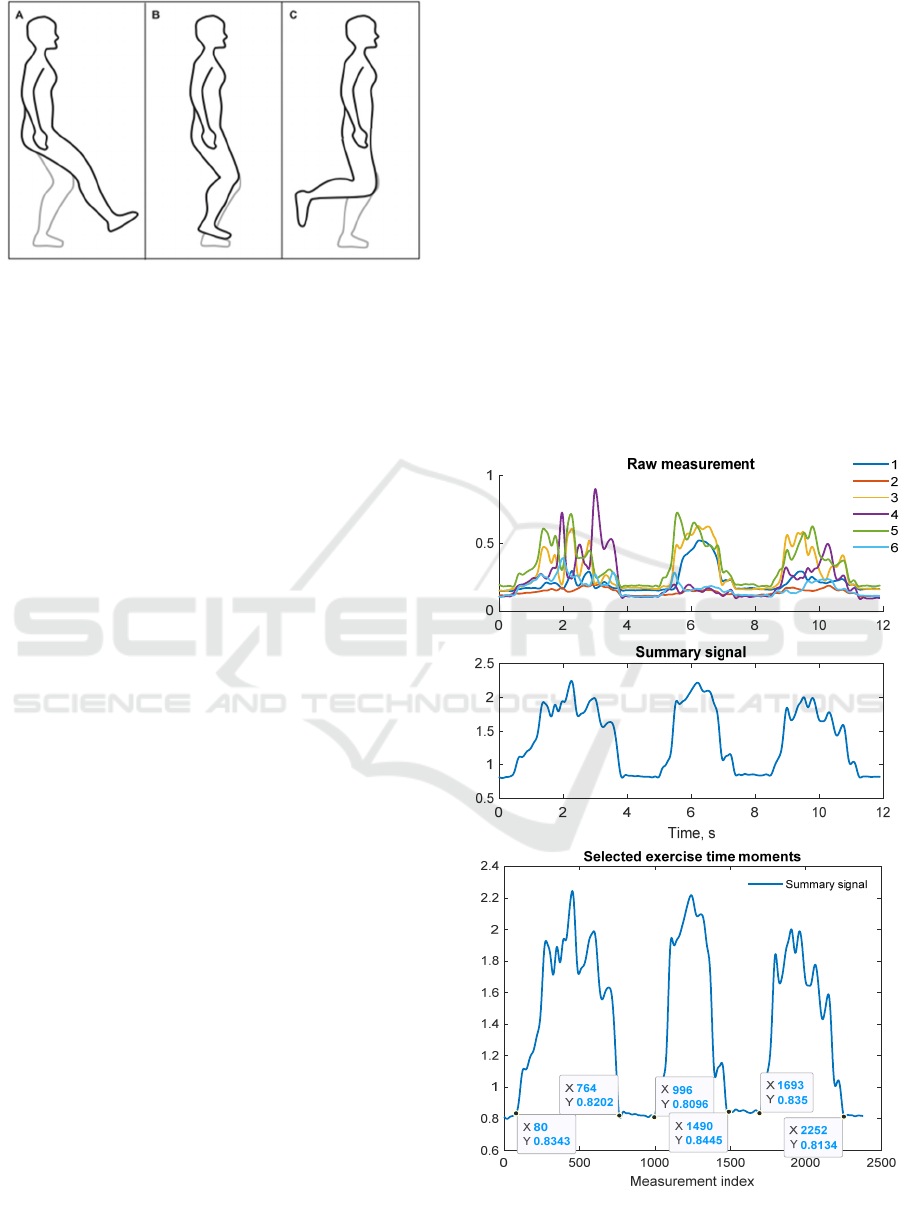
Figure 2: Body position in SLST: a- single leg squat-front
test; b- single-leg squat-middle test; c- single-leg squat-
back test (Khuu et al., 2019).
2.3 Trial Design and “Single Leg
Squat” Functional Tests
Description
SLST was performed with smart socks and sports
shoes. To provide visual observation, surface markers
were placed symmetrically on both lower extremities
- spina iliaca anterior superior, the midpoint between
femur condylus medialis and condylus lateralis, the
midpoint between malleolus medialis and malleolus
lateralis (Ugalde et al., 2015; Khuu et al., 2016;
Hughes et al., 2019).
Three different variations of the “Single Leg
Squat” test were performed (see Fig. 2). The
participants were asked to place their hands on their
hips or along their sides and stand on one leg, while
the other leg (not the supporting one) was placed in
one of three positions. From this position, they were
instructed to squat the supporting leg to
approximately 60-degree flexion position in the knee
joint and return to the starting position by
straightening the knee joint.
Three variations of SLST were:
- the single leg squat-front test (further SLS-F) was
performed with the non-supporting leg stretched fully
forward in front position (Fig. 2a);
- the single leg squat-middle test (further SLS-M)
was performed with the non-supporting leg bent 90
degrees in the knee joint and aligned along the
supporting leg, in the middle position (Fig. 2b);
- the single leg squat-back test (further SLS-B) was
performed with the non-supporting leg bent 90
degrees in the knee joint and pulled behind the back
in a backward position (Fig. 2c).
In every test, at the beginning of the first squat, the
test (supporting) leg was lifted from the floor to
indicate the starting point of the squat, after which the
participant performed three squats in a row. In total,
three squats were performed for each leg for each
variation of SLST.
The squats performed by participants were
visually inspected by a certified physiotherapist, who
assessed participants' feet performance. Alongside,
the data from DPSS were recorded, however, the
results of recording were not communicated to the
physiotherapist. On the base of visual inspection, the
physiotherapist provided
a
reference conclusion
concerning test results, hereby separating participants
into two groups: control group (6 athletes), where
participants demonstrated correct SLST foot
performance, and study group (14 athletes), where
participants performed tests with excessive pronation
of the lower feet. In the control group, the mean age
was 20.6 years (SD 2.2 years), a mean BMI was 20.7
(SD 1.7), while in the study group, the mean age was
20.3 years (SD 2.2 years), and the mean BMI was
21.1 (SD 1.8).
Figure 3: The raw measurement from each sensor during
three separate SLST exercises, the sum of all signals, and
the manually selected time moments for analysis.
Evaluation of the Foot Performance in “Single Leg Squat” Test of Female Athletes using Smart Socks
163
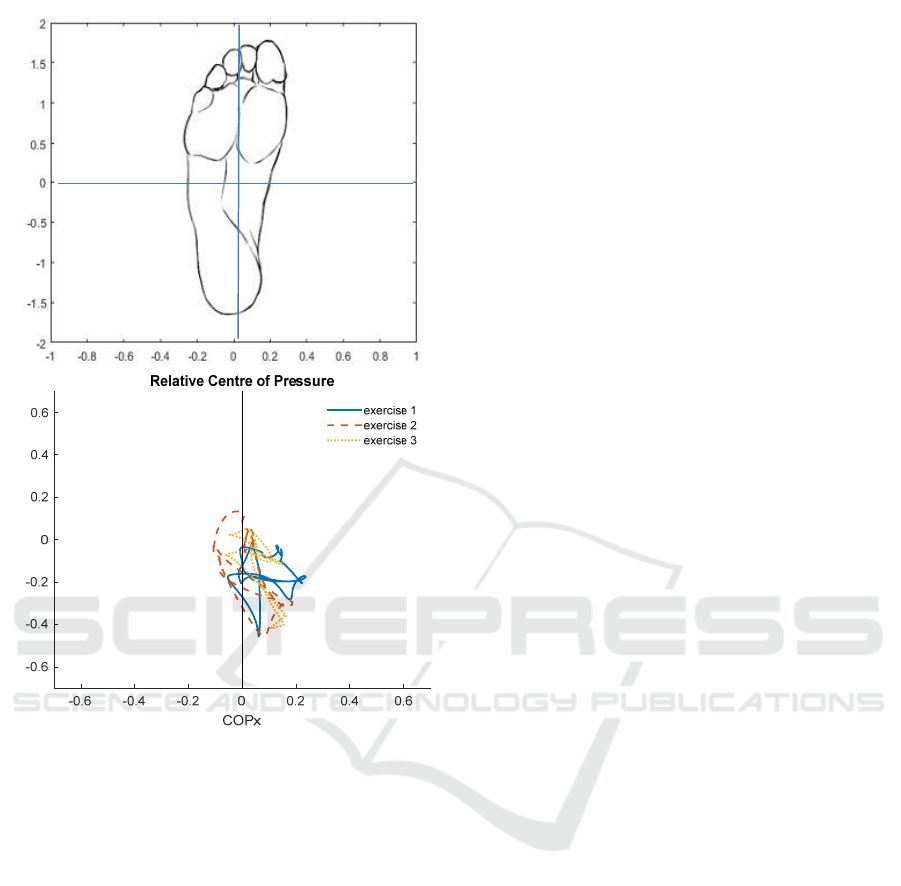
Figure 4: COP coordinates with the center fixed to the
center of the foot (a, not to scale), and an example of the
calculated COP for 3 SLST measurements (b).
2.4 Data Processing
The evaluation of the change of the plantar pressure
of the load-bearing foot during the exercise was
performed by analyzing the variation of the center of
pressure (COP), which is a widely applied method in
gait analysis. Due to a variation of the textile sensor
location on the foot, a modified version of COP was
used for this application, where sensor positions are
defined relative to the center of the foot (P. Eizentals
et al., 2018). This technique of the COP calculation
assigns dimensionless arbitrary positions of the
separate sensors to avoid COP data dependence on
the foot size, consequently, the COP coordinates are
expressed in arbitrary units.
Before the calculation of the COP, the
measurement from DPSS was pre-processed
according to the following algorithm. First, the
measured resistance of the sensors is converted to the
conductance through equation (1):
=
(1)
where R
i
is the i-th measurement of the raw signal.
The calculated values are then filtered with a zero
phase-shift low-pass filter (Chebyshev type II, cut-off
frequency 10Hz). The signal from all sensors (Fig.3a)
then was then summed to obtain the total pressure
measurement during the exercise (Fig 3b), which was
employed for manual selection of the start and end
moment of each SLST exercise (Fig 3c).
For each of the selected periods, the COP was
calculated for the whole movement through the
equations (2) and (3):
=
∑
cos
(2)
=
∑
sin
(3)
where is the measurement from each sensor
obtained from equation (1), =
[1, 1, cos , cos , 1, 1] is a vector holding weight
coefficients assigned to each sensor, and =
[
75°, 105°, 0°, 180°, 285°, 255°
]
is the angle
assigned to each sensor in the arbitrary coordinate
system. The sensors are numbered in the order
presented in Fig. 1c. The coordinate system and an
example of a COP for 3 consecutive squats are
presented in Fig 4. Figure 4b indicates that only the
COP component on X-axis (COPx) is important for
determining the over-pressure on the medial part of
the foot, which is important for this study, and
therefore only this component was used further in the
statistical analysis. For the selected coordinate
system, the positive values of COPx correspond to the
medial shift of COP, negative values of COPx – to the
lateral shift of COP.
2.5 Data Analysis
Statistical analysis of the calculated COPx values
included two parametric methods – two-factor
ANOVA with replication, and unpaired t-test. The
independent factors in ANOVA were the participant
(identified by the ID number) and the variation of
SLST. For each “participant – SLST variation”
combination three replicas, corresponded to separate
squats were used to estimate repeatability of the
DPSS measurement. ANOVA was performed to the
control and the study groups separately, and for right
and left leg tests, resulting in four separate ANOVA
tables. Unpaired t-test was applied to compare the
average COPx values of the control group and the
study group, separately to each variation of the SLST
test for the right and the left leg.
COPy
a
y
x
b
icSPORTS 2020 - 8th International Conference on Sport Sciences Research and Technology Support
164

3 RESULTS AND DISCUSSION
The results of COPx calculations for the control
group and study group are summarised in Table 1.
The table presents data for separate squats, performed
in a series of three different variations of the SLST
exercises, separately for left and right legs.
3.1 Validation of DPSS Applicability
for Evaluation of the SLST Foot
Performance
Data in Table 1 demonstrates that the COPx value
varies between separate squat measurements. To
compare these variations with the differences
between individual athletes as well as with variation
due to modification of the SLST technique, two-
parametric ANOVA with replications was used.
Table 2 summarizes P–values, associated with the
ANOVA test and indicating the contribution of the
corresponding source of variance to the overall
variability of COPx. The data from Table 2 indicates,
that contribution of the SLST variant to the total
variance of COPx was significant (P < 0.05) in half
cases, i.e. for the control group left leg test and for the
study group right leg test. This implies that
differences in COPx, caused by the change of the
SLST mode could be comparable to, or even greater
than the differences between COPx for separate
squats, caused by repeatability error of the DPSS
measurement. In turn, the contribution of the athlete
Table 1: Results of COPx calculations for control group and study group, the mean value for each of three exercises is given
in the table.
Participant
No
Left leg Right leg
Front test Middle test Back test Front test Middle test Back test
(SLS F Left) (SLS M Left) (SLS B Left) (SLS F Right) (SLS M Right) (SLS B Right)
Control group
1 -0.02 -0.02 -0.02 -0.06 -0.09 -0.02 -0.09 -0.06 -0.09 -0.11 -0.1 -0.08 -0.05 -0.06 -0.04 -0.04 -0.03 -0.04
2 -0.09 -0.04 -0.03 -0.04 -0.07 -0.04 -0.09 -0.06 -0.07 -0.04 -0.02 -0.01 -0.02 -0.03 -0.03 -0.06 -0.03 -0.04
3 -0.06 0.00 0.04 -0.07 -0.16 -0.07 -0.08 0.00 -0.04 -0.04 -0.06 -0.06 -0.02 -0.07 -0.01 -0.01 -0.09 -0.05
4 -0.06 -0.03 -0.04 -0.03 -0.02 0.00 0.00 -0.05 -0.06 -0.11 -0.04 -0.08 -0.06 -0.07 -0.1 -0.04 -0.05 -0.06
5 -0.06 0.00 0.04 -0.07 -0.16 -0.07 -0.08 0.00 -0.04 -0.09 -0.06 -0.09 -0.15 -0.11 -0.07 -0.02 -0.06 -0.05
6 -0.03 -0.04 -0.05 -0.02 -0.03 -0.01 -0.06 -0.08 -0.07 -0.04 -0.02 -0.01 -0.02 -0.03 -0.03 -0.06 -0.03 -0.04
Study group
1 0.02 0.09 0.09 0.03 0.19 0.09 0.09 -0.01 0.06 0.02 0.08 0.04 0.04 0.06 0.05 0.03 0.09 0.08
2 0.21 0.16 0.24 0.14 0.16 0.20 0.16 0.23 0.21 -0.02 0.05 0.04 -0.04 0.02 0.03 0.00 0.02 -0.01
3 0.11 0.11 0.07 0.05 0.00 0.01 -0.01 0.03 0.06 0.06 0.07 0.03 0.06 0.00 0.00 0.11 0.04 -0.04
4 0.04 0.03 -0.02 -0.01 0.05 0.01 0.01 0.00 0.05 0.02 0.04 -0.03 0.01 0.06 0.02 0.00 0.02 0.05
5 0.05 0.05 0.08 0.05 0.03 0.06 0.01 0.03 0.00 0.07 0.05 0.10 0.04 0.06 0.05 0.07 0.06 0.07
6 0.05 0.06 0.07 0.03 0.02 0.04 0.04 0.03 0.02 0.05 0.08 0.06 0.08 0.07 0.09 0.06 0.11 0.06
7 0.10 0.13 0.16 0.07 0.09 0.06 0.11 0.10 0.09 0.07 0.07 0.02 0.05 0.05 0.05 0.07 0.09 0.06
8 0.04 0.03 -0.02 0.11 0.13 0.16 0.06 0.15 0.17 0.03 0.04 0.03 0.03 0.19 0.09 0.03 0.09 0.08
9 0.21 0.16 0.24 0.14 0.16 0.20 0.16 0.23 0.21 0.07 0.05 0.10 0.14 0.16 0.20 0.07 0.06 0.07
10 0.05 0.05 0.08 0.05 0.03 0.06 0.01 0.03 0.00 -0.02 0.05 0.04 0.05 0.00 0.01 0.00 0.02 -0.01
11 0.10 0.13 0.16 0.11 0.13 0.16 0.06 0.15 0.17 0.07 0.07 0.02 0.05 0.03 0.06 0.07 0.09 0.06
12 0.11 0.11 0.07 0.05 0.00 0.01 -0.01 0.03 0.06 0.02 0.04 -0.03 0.03 0.02 0.04 0.00 0.02 0.05
13 0.02 0.09 0.09 0.02 0.08 0.04 0.14 0.16 0.20 0.02 0.08 0.04 0.07 0.09 0.06 0.03 0.09 0.08
14 0.03 0.02 0.04 0.06 0.07 0.03 0.11 0.13 0.16 0.06 0.07 0.03 0.11 0.13 0.16 0.11 0.04 -0.04
Evaluation of the Foot Performance in “Single Leg Squat” Test of Female Athletes using Smart Socks
165
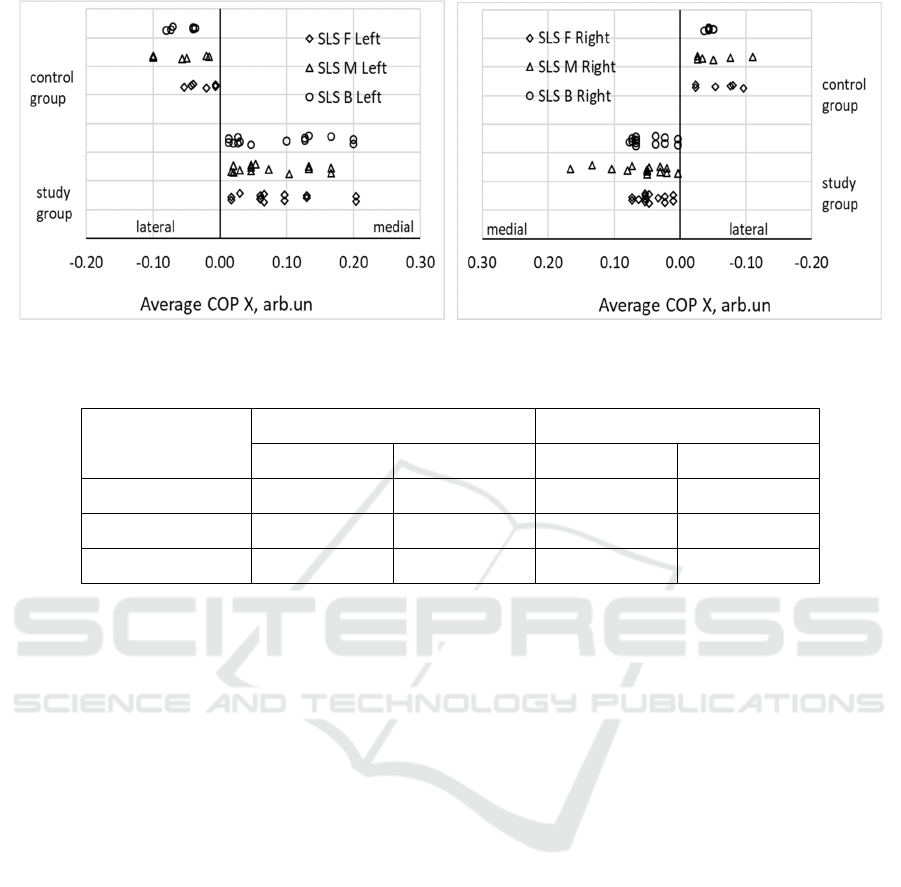
Figure 5: Values of average COPx for (a) left and (b) right foot for different SLST exercises.
Table 2: Summary of ANOVA analysis: P- values associated with influence of the factors.
Factor
Control group Study group
Left leg Right leg Left leg Right leg
SLST variant 0.01 0.14 0.12 0.04
Athlete 0.62 6.4×10
-5
1.28×10
-23
2.7×10
-8
Interaction 0.01 0.006 7.2×10
-7
0.03
factor was significant in three cases out of four. This
means, that individual variations between athletes are
generally higher, then intra-athlete variation due to
DPSS repeatability error.
Additionally, it is worth noting that only a “non-
significant” case corresponds to the left leg squats in
the control group. This may be explained by the fact,
that athletes in the control group were right-handed
persons, having the leading left leg, therefore they
performed squats in a highly stable manner with small
variation in the position of the COP. The interaction
between SLST mode and athlete factors was
significant for all four ANOVA tests. This could be
interpreted, that variations in COPx, caused by
different combinations “SLST mode – athlete” are
generally greater, then variations, caused by DPSS
repeatability error. Summarising these arguments,
one could conclude, that accuracy of the DPSS
measurements is adequate to reveal individual
variations between athletes. In other words,
differences between athletes' COPx measurements
are higher than differences, caused by DPSS
repeatability error in single athlete’s measurements.
This conclusion validates DPSS applicability for
evaluation of the SLST foot performance. Alongside,
in the following analysis, one could use COPx,
averaged over three squats for characterization of
separate athletes.
3.2 Comparative Analysis of COPx
Coordinate Deviation during SLST
Figure 5 summarises data on average COPx
parameter for the control and study groups for
different SLST variations, presenting separately data
for the left and right leg. The figure demonstrates that
the average COPx in the control group is negative, i.e.
center of plantar pressure is placed closer to the lateral
side of the foot. This corresponds to the proper,
supinated position of the foot. In contrast, in the study
group, the average COPx of all athletes was positive,
it means that center of pressure is shifted medially,
under the foot arch. Indeed, athletes in the study
group were prone to excessive pronation. The
application of the t-test to compare data in the control
and study group for different SLST modes just
confirmed the conclusion made by visual analysis of
the Figure 5 data (Table 3). Generally, there was no
significant difference between left and right leg COPx
data both in control and study groups (Table 4). The
only case with P < 0.05 (front test in the study group)
may be a coincidence.
icSPORTS 2020 - 8th International Conference on Sport Sciences Research and Technology Support
166

Table 3: P–values for the t-test of differences in COPx
between control and study groups.
Left leg Right leg
Front test
5.0×10
-6
1.3×10
-4
Middle test
1.8×10
-5
2.8×10
-5
Back test
2.2×10
-6
2.4×10
-9
Additional observation made from Figure 5 data
is the difference in variability of COPx data for
control and study group: the variability in the study
group is noticeably higher. This observation
correlates well with the general opinion, that athletes
in the control group have proper foot functioning and
therefore perform SLST exercise in a more stable and
controllable manner, while athletes in the study group
have difficulties in sustaining proper balance due to
poor foot functioning.
To compare COPx data in SLST variations,
single-factor ANOVA was applied. For all
combinations of co-factors “control/study group” and
“left/right leg”, the P–values, associated with
ANOVA were in the range 0.13 to 0.82. This
demonstrates that there was no significant difference
in the COPx values, obtained for variations of SLST.
Moreover, in the estimation of the foot performance
using COPx values, the same criteria could be used
for all variations of SLST exercises.
Table 4: P–values for the t-test of differences in COPx
between left and right leg in control and study groups.
Control group Study group
Front-test 0.07 0.02
Middle-test 0.87 0.46
Back-test 0.20 0.07
3.3 Discussion
The obtained results demonstrated that the COPx
parameter, derived from the series of DPSS
measurements in SLST exercises is a good indicator
of the foot performance. The COPx values are
negative for athletes with proper foot performance
and positive for athletes, prone to excessive foot
pronation during the squat exercise. For the present
research group, there were no athletes in the control
group with positive average COPx, and there were no
athletes with negative average COPx in the study
group. Therefore, one could claim that the foot
performance test, based on the calculation of average
COPx over three sequential squats would have 100%
sensitivity and 100% specificity. In practice,
however, it would be useful to estimate the prognostic
value of the test, based on the single squat. This is
important for the development of training aid, that
provides real-time feedback to an athlete during each
squat. To estimate the characteristics of the single –
squat test, the distribution of the COPx values over
athletes could be approximated with a normal
distribution. Bearing in mind results of COPx
comparison between left and right foot (no
differences) and between variations of SLST (no
differences), average COPx and sample standard
deviation, calculated using all pool of data, could be
used as estimates of the mean and standard deviation
of this normal distribution. The corresponding
parameters for control group are μ = -0.050, σ = 0.027
and for study group are μ = 0.068, σ = 0.051. The
sensitivity of the single squat test, estimated as a
probability for an athlete with poor foot performance
to get the positive value of COPx in a single squat, is
equal to 0.906. The specificity, estimated as a
probability for an athlete with good foot performance
to get the negative value of COPx in a single squat, is
equal to 0.968. These parameters demonstrate the
good ability of the COPx measurement-based test to
distinguish between good and poor foot performance
in a single squat exercise. Hereby, the proposed
equipment and technique has the potential to be used
for feedback that helps athlete to train correct foot
position during the single-leg squat exercise.
4 CONCLUSIONS
1. The DAid Pressure Sock System can be
employed for quasi-static measurements to collect
objective results of functional tests of lower
exterminates biomechanics. Its application also
essentially simplifies data collection and registration.
2. The study demonstrated that the application of
the DAid Smart Sock system for COP monitoring
during Single leg squat functional tests provides the
possibility to diagnose athletes with an excessive
medial deviation of COP position, i.e. increased
potential risk of lower exterminates injury. Thus, the
application of the DAid Smart Sock system could
become a base of simple and inexpensive express
tests for lower exterminates injury risk prevention.
3. The method has the potential to be used for
feedback that helps athletes to train correct foot
positions during the single-leg squat exercise.
Evaluation of the Foot Performance in “Single Leg Squat” Test of Female Athletes using Smart Socks
167

ACKNOWLEDGEMENTS
This work has been supported by the European
Regional Development Fund within the Activity
1.1.1.2 “Post-doctoral Research Aid” of the Specific
Aid Objective 1.1.1 “To increase the research and
innovative capacity of scientific institutions of Latvia
and the ability to attract external financing, investing
in human resources and infrastructure” of the
Operational Programme “Growth and Employment”
(No. 1.1.1.2/VIAA/1/16/153).
REFERENCES
Buldt, A.K., Forghany, S., Landorf, K.B., Levinger, P.,
Murley, G.S., Menz, H.B. 2018. Foot posture is
associated with plantar pressure during gait: A
comparison of normal, planus and cavus feet. Gait
Posture. May;62:235-240
Cates, W., Cavanaugh, J. 2009. Advances in Rehabilitation
and Performance Testing. Clinics in Sports Medicine.
28(1), 63–76
Eizentals, P., Katashev, A., Oks, A. 2019. A Smart Socks
System for Running Gait Analysis. In: Proceedings of
the 7th International Conference on Sport Sciences
Research and Technology Support, Austria, Vienna, 20-
21 September 2019. Vienna: 2019,.47-54.
Eizentals, P., Katashev, A., Oks, A., Pavare, Z., Balcuna,
D. 2018 Detection of Excessive Pronation and
Supination for Walking and Running Gait with Smart
Socks. In World Congress on Medical Physics and
Biomedical Engineering 2018: IFMBE Proceedings,
Volume 68/2, Čehija, Prague, 3.-8. jūnijs, 2018.
Singapore: Springer Nature Singapore Pte Ltd, 2019,
.603-07.
Hughes, T., Jones, R.K., Starbuck, C., Picot, J., Sergeant,
J.C., Callaghan, M.J. 2019. Are tibial angles measured
with inertial sensors useful surrogates for frontal plane
projection angles measured using 2-dimensional video
analysis during single leg squat tasks? A reliability and
agreement study in elite football (soccer) players.
Journal of Electromyography and Kinesiology.
Feb;44:21-30.
Kagaya, Y., Fujii, Y., Nishizono, H. 2015. Association
between hip abductor function, rear-foot dynamic
alignment, and dynamic knee valgus during single-leg
squats and drop landings. Journal of Sport and Health
Science. Jun 4 (2), 182-187.
Khuu, A., Foch, E., Lewis, C.L. 2016. Not all single leg
squats are equal: a biomechanical comparison of three
variations. International Journal of Sports Physical
Therapy. Apr;11(2):201-11.
Khuu, A., Lewis, C.L. 2019. Position of the non-stance leg
during the single leg squat affects females and
males differently. Human Movement Science.
Oct;67:102506.
Kianifar, R., Joukov, V., Lee, A., Raina, S., Kulic, D. 2017.
Automated Assessment of Dynamic Knee Valgus and
Risk of Knee Injury During the Single Leg Squat. IEEE
J Transl Eng Health Med. 5: 2100213
Neal., B.S., Griffiths, I.B., Dowling, G.J., Murley, G.S.,
Munteanu, S.E., Franettovich Smith, M.M., Collins,
N.J., Barton, C.J. 2014. Foot posture as a risk factor for
lower limb overuse injury: a systematic review and
meta-analysis. Journal of Foot and Ankle Research.
Dec 19;7(1):55
Numata, H., Nakase, J., Kitaoka, K., Shima, Y., Oshima, T.,
Takata, Y., Shimozaki, K., Tsuchiya, H. 2018. Two-
dimensional motion analysis of dynamic knee valgus
identifies female high school athletes at risk of non-
contact anterior cruciate ligament injury. Knee Surgery,
Sports Traumatology, Arthroscopy. Feb;26(2):442-447.
Oks, A., Katashev, A., Bernans, E., Abolins, V. 2017. A
Comparison of the Accuracy of the Smart Sock System
to Force Platform and Optical System for Measurement
of Temporal Parameters of Locomotion. No: IOP
Conference Series: Materials Science and Engineering.
2017. United Kingdom, Bristol: IOP Publishing, 2017,
1.-6.lpp. ISSN 1757-8981. e-ISSN 1757-899X.
Oks, A., Katashev, A., Eizentals, P., Rozenstoka, S., Suna,
D. New Method to Analyze the Load Propagation on
the Plantar Foot Surface During a Walk/Run Using the
Smart Sock System. In: IFMBE Proceedings. Vol.76:
15th Mediterranean Conference on Medical and
Biological Engineering and Computing (MEDICON
2019), Portugal, Coimbra, 26-28 September 2019.
Cham: Springer, 2019,.604-09.
Razak, A.H.A., Zayegh, A., Rezaul K. Begg, R.K., Wahab,
Y. 2012. Foot Plantar Pressure Measurement System:
A Review. Sensors (Basel). 12(7): 9884–9912.
Ugalde, V., Brockman, C., Bailowitz, Z., Pollard, C.D.
2015. Single Leg Squat Test and Its Relationship to
Dynamic Knee Valgus and Injury Risk Screening. PM
R. Mar;7(3):229-35; quiz 235
Wyndow N., De Jong, A., Rial K, Tucker, K., Collins, N.,
Vicenzino, B., Russell, T., Crossley, K. 2016. The
relationship of foot and ankle mobility to the frontal
plane projection angle in asymptomatic adults. Journal
of Foot and Ankle Research. Jan 25;9:3.
icSPORTS 2020 - 8th International Conference on Sport Sciences Research and Technology Support
168
