
Driving the Bus: A Radiology Case Study Utilizing Rich Picture
Diagramming and CATWOE to Capture Staff Perceptions and
Inform Service Improvement Scenarios
Mary Conlon
1,2 a
, Owen Molloy
1,2 b
and Nora ZolzerBryce
1,2
1
College of Engineering and Informatics, National University of Ireland, Galway, Ireland
2
Irish Wheelchair Association, Ireland
Keywords: Workload, Simulation Modelling.
Abstract: Introduction: Demand for computed tomography (CT) services is increasing. This empirical work in a CT
setting, examines how qualitative methods were used to identify staff perceptions and opportunities for
service improvement. The use of soft systems methodologies (SSM) as an action research tool in radiology
is considered. Methods: Hospital Staff were interviewed to create a root definition of the CT service. In a
diagramming session, a rich picture (RP) was created and augmented with staff input. Utilizing the RP, a
session was facilitated with radiology decision makers to identify a list of culturally desirable and feasible
process improvement scenarios. Results: Root definitions were created of the CT service from the
perspective of the staff. The RP graphically illustrated the key features of the CT service and represented a
shared understanding of the service. A targeted set of culturally feasible and desirable service improvement
recommendations were identified. Four directly attributable implemented workflow changes were identified.
Conclusion: RP diagramming provided an opportunity to involve staff in research while capturing their
perceptions and resulted in a shared understanding as well as targeted opportunities for CT service
improvement. The implemented workflow changes resulting from the SSM approach demonstrated its use
as an action research tool.
a
https://orcid.org/0000-0001-7241-8869
b
https://orcid.org/0000-0002-8781-9742
1 INTRODUCTION
The challenges facing CT service provision are
many. Resources are limited and the demand for
Radiology and CT services is increasing year on
year. (Conlon & Molloy, 2019; Granja, Almada-
Lobo, Janela, Seabra, & Mendes, 2014)
The number of over 65 year olds will double
between 2011 and 2031 and the increasing
prevalence of diabetes and obesity among young
people suggests that future elderly cohorts might
suffer from a range of co-morbidities. (Lakdawalla,
Bhattacharya, & Goldman, 2004; Sturm et al., 2007)
(Central Statistics Office., 2015). The calculation of
radiology workload is inherently reductionist in that
it is based on medical requests for imaging of
different body parts. (Rcsi, 2011; Reeves, 2005)
(Reeves, 2005) Radiology workload assessment in
terms of numbers of examinations completed is a
reductionist and crude measurement (MacDonald,
Cowan, Floyd, & Graham, 2013; Naylor, 1992;
Ondategui-Parra et al., 2004; Pitman, Cowan, Floyd,
& Munro, 2018; RCSI, 2011; Sunshine &
Burkhardt, 2000). This work examines the
intertwined elements of a CT service including the
motivations and priorities of those involved in the
service using tools from soft systems methodology
(SSM) to identify opportunities for service
improvement (Crowe, Brown, et al., 2017). SSM is a
well-established action research approach and
requires one to use the experience itself as a research
object and to extract learning through conscious
reflection. This process leads to action in a never
ending learning cycle: once the action is taken, a
new situation with new characteristics arises and the
learning process starts again (Rodriguez-Ulloa &
Paucar-Caceres, 2005).
88
Conlon, M., Molloy, O. and ZolzerBryce, N.
Driving the Bus: A Radiology Case Study Utilizing Rich Picture Diagramming and CATWOE to Capture Staff Perceptions and Inform Service Improvement Scenarios.
DOI: 10.5220/0010145600880099
In Proceedings of the 12th International Joint Conference on Knowledge Discovery, Knowledge Engineering and Knowledge Management (IC3K 2020) - Volume 3: KMIS, pages 88-99
ISBN: 978-989-758-474-9
Copyright
c
2020 by SCITEPRESS – Science and Technology Publications, Lda. All r ights reserved
In this case study, SSM tools are used to create a
shared understanding of the CT service, as part of a
larger operations research (OR) project utilizing
simulation modelling. Operations research (OR) is
the art of applying analytical methods to the solution
of complex management problems(Ackermann,
2012a). OR has the potential to improve radiology
workflows and systems and can capture human
responses to work pressure (Greasley & Owen, n.d.;
Oliva, 2002)
(Booker, O’Connell, Desai, &
Duddalwar, 2016; Van Lent et al., 2012). The SSM
tools used are CATWOE and rich picture (RP)
diagramming. CATWOE focuses on creating a root
definition of a service from varying perspectives,
aiming to illicit perspectives on an issue by
identifying the Customers, Actors, Transformation,
Weltanschauung/Worldview, Owner and
Environmental constraints (Crowe, Brown, et al.,
n.d.; Lamé, Jouini, Stal-Le Cardinal, & Lam, 2019).
Rich picture (RP) diagramming allows groups to
explore their information flows, communications,
subconscious, occult sentiments and conflicted
understandings(Rodriguez-Ulloa & Paucar-Caceres,
2005) (Bell, Berg, & Morse, n.d.; Berg, 2015). RP
diagrams use cartoon like freeform drawings to
enact or provoke knowledge and reflection and
therefore allow a problem situation to be viewed in a
more structured way, without commitment to any
particular solution(Peter Checkland, 1985) (P
Checkland, 1999). The purpose of a RP is to firstly
determine what is learnt in the process of its
construction and secondly to use the picture as a
means of conveying a message or sharing an
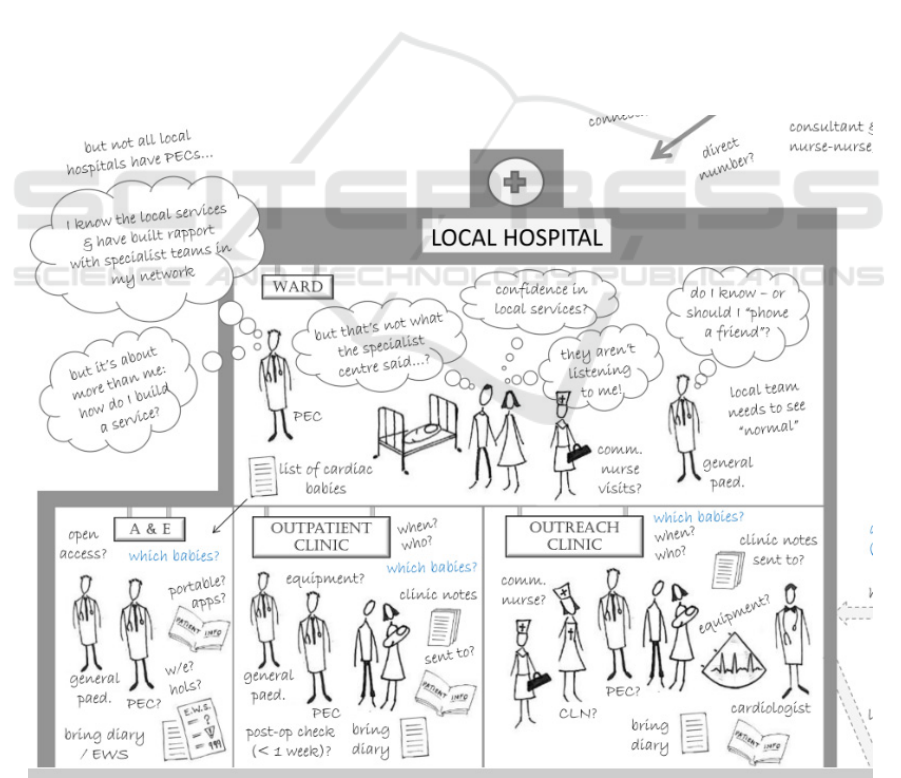
understanding. Crowe et al created a RP diagram
from interview recordings in a mixed methods case
study to analyze the service provided to infants with
congenital heart disease (CHD), see figure 1(REF).
In the subsection of the RP, the hospital, the various
staff, patient and family are represented along with
their fears and concerns and perceived issues. They
concluded that RP diagramming facilitated the work
in acknowledging and working with multiple
perspectives systematically while considering
feasible and culturally desirable targeted service
improvements (Crowe, Brown, et al., 2017).
Figure 1: Subsection of RP diagram Crowe et al, 2016.
Driving the Bus: A Radiology Case Study Utilizing Rich Picture Diagramming and CATWOE to Capture Staff Perceptions and Inform
Service Improvement Scenarios
89
RP diagramming in healthcare has facilitated the
provision services and education (Crowe et al.,
2017; Goebel, Cristancho, & Driman, 2019). There
is however a paucity of literature using SSM
techniques to formally capture the staff experience
of providing CT and other diagnostic imagining
services. SSM has the potential to allow staff to
share their experience of service delivery (Bate,
2000). To summaries, the research paper objectives
are as follows:
1. To elicit knowledge relating to the factors
affecting CT service delivery from staff and
create a shared understanding of the CT
service using RPs and CATWOE statements.
2. To identify potentially feasible and culturally
desirable targeted service improvements for
use in an OR projects using simulation
modelling to address the increasing demand
for CT.
3. To identify implemented workflow changes
which resulted from the use of the SSM tools.
4. To produce a RP diagram for dissemination.
2 METHODS
A SSM approach was deemed appropriate given its
focus on engaging multiple staff perspectives and its
ability to illicit information and potential simulations
(Peter Checkland, 1999). Data was collected over a
one month period using semi-structured interviews
and RP diagramming sessions.
The case study hospital provides a 24/7 acute
surgical, medical and critical care service with
emergency and maternity services and has
approximately 100 inpatient beds. In radiology, a
single CT scanner provides a scheduled service from
8.30am to 5pm and a 24 hour emergency service for
inpatients and accident and emergency patients.
Approval to conduct the study was obtained from
the hospital management team. Informed consent
was sought from all participants and this consent
was approved by hospital management. The
researcher had ten years experience in CT and was
employed for four years in the CT department prior
to commencing the research work. All data was
anonymized and stored in line with local data
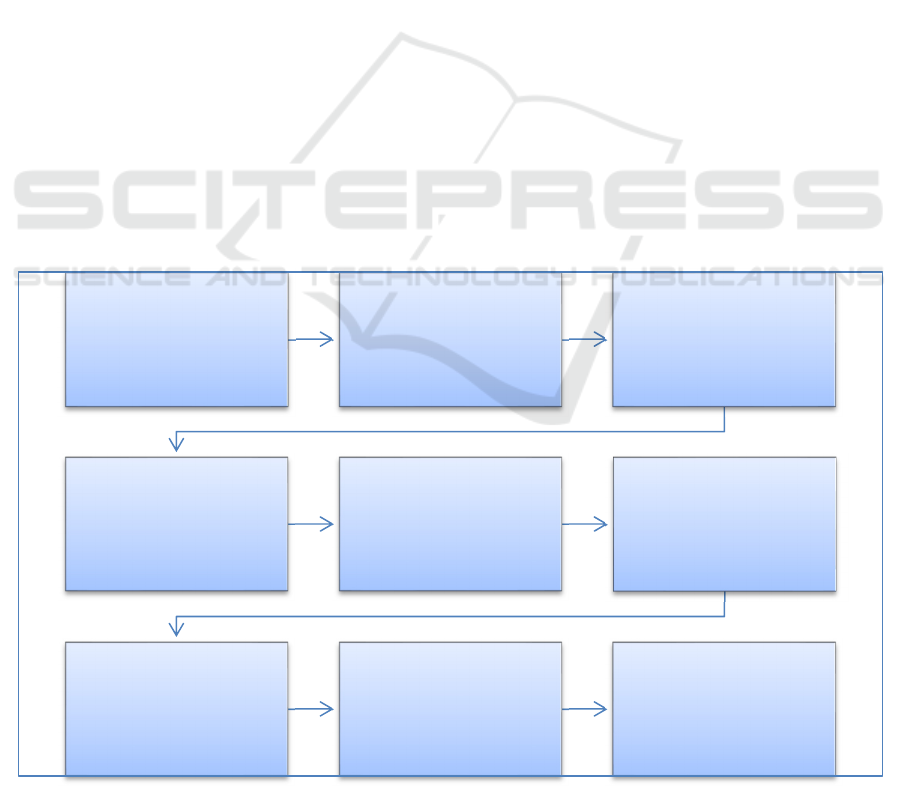
protection guidelines. Figure 2 outlines the
methodological approach taken.
2.1 CATWOE
A 20 minute PowerPoint introduction was provided
to staff on the use of SSM, RP diagramming and
CATWOE, staff were provided with examples of RP
diagrams (Crowe, Knowles, et al., n.d.). Interviews
were conducted to elicit information from staff
regarding the important aspects of the service by
Figure 2: Process of RP building.
1.Powerpoint
IntroductiontoSSM
2.StaffInterviews
usingCATWOE
structure
3.StaffRP
Diagramming
session
4.Additionof
CATWOEdatatoRP
5.SoftcopyRP
design
6.Reviewofissues
(RP)andconstraints
(CATWOE)with
staff
7.Decisionmaker
RPdiagramming
8.FinalRPinput
andverification
9.Identificationof
service
improvements
KMIS 2020 - 12th International Conference on Knowledge Management and Information Systems
90
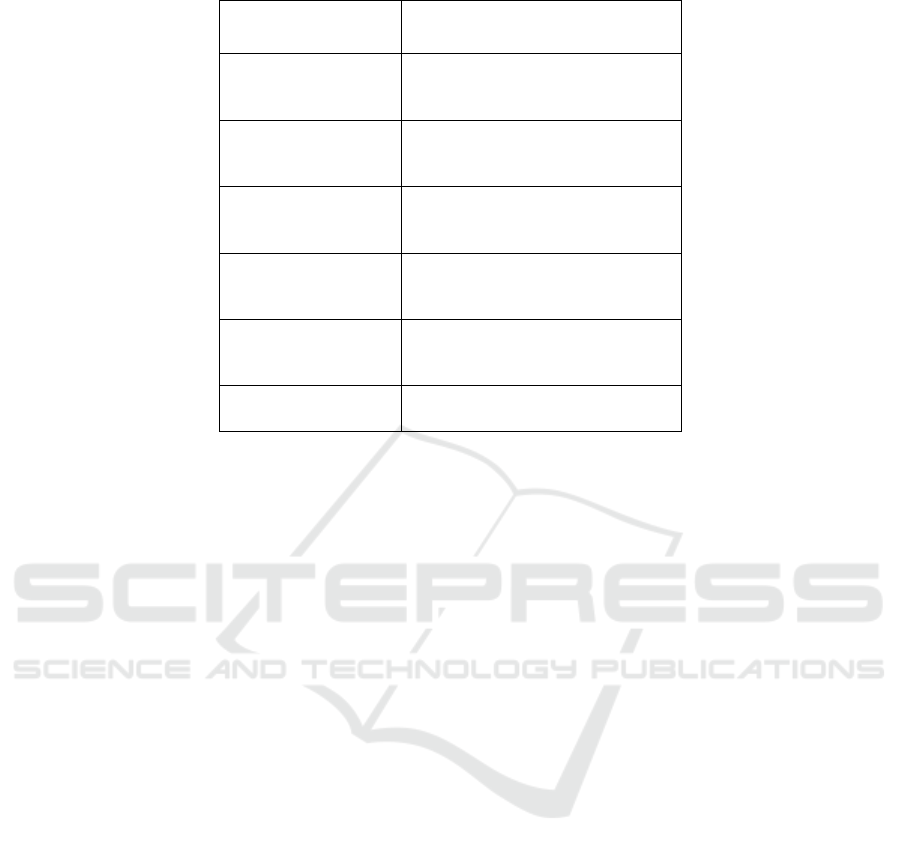
Table 1: CATWOE pneumonic explanation.
CATWOE Explanation
Customers
Beneficiaries of service or
transformation process (T)
Actors
Who carries out the service or
transformation process
Transformation
process
What occurs to inputs in the
process
Worldview
The worldview - why the service or
transformation process is important
Owners
Those who can stop the service or
transformation process
Environment Environmental constraints
identifying the customers, actions, transformation
process, worldview, owners and environmental
constraints (CATWOE) of the CT service(Crowe,
Brown, et al., n.d.). Convenience sampling was used
to recruit interview participants (n=5), which
included a CT clinical specialist, a department
manager, a hospital referrer, a porter and a nurse.
Staff were interviewed individually in their place of
work and the interview schedule was based on the
SSM pneumonic CATWOE (Peter Checkland, 1985,
1999). Notes were taken on a pre-printed document
with sections for each part of the CATWOE
pneumonic (Table 1).
2.2 RP Diagramming
In step 3, the CT clinical specialist, two senior CT
radiographers, department nurse and one radiologist
were directly involved in the RP session. The
facilitator was a member of staff from the radiology
department. During a 35 minute picturing session,
participants were presented with a blank page and a
set of colored markers, and were asked to draw
freehand graphics representing their interpretation of
the service(Berg, 2015). Participants were instructed
to avoid the use of text where possible(Bell et al.,
n.d.). Questions were encouraged throughout the
session. The facilitator prompted throughout so as to
uncover difficult to observe workflows and
communications. Where text could not be avoided
comments and speech bubbles were written directly
onto the RP poster as well as a list of perceived
issues generated. While not directly involved in the
RP session, the worldview and environmental
constraints of the porter and the nurse obtained from
the structured interviews were added to the RP by
the facilitator (step 4).
2.3 Creating the Soft Copy RP and
Validation
In order to create a version of the RP which could be
disseminated outside of the case study, drawings
were created to represent the hand drawings of staff
(step 5). These were scanned and imported into
Microsoft Publisher for arranging. Where text was
used these comments were typed and added to the
softcopy version. Once completed the RP was
presented to staff members. The purpose of this was
to allow participants to talk through the diagram,
discuss insights and to confirm and refine the RP
diagram(Bell et al., n.d.; Berg, 2015). Suggested
changes were made and once again shown to staff
for verification.
In step 6 the list of perceived issues generated
during the RP diagramming session and the
constraints identified in the CATWOE statements
were reviewed by the participants and scrutinized so
as to identify important aspects of the
service(Howick & Ackermann, 2011; Rashwan,
2017).
Driving the Bus: A Radiology Case Study Utilizing Rich Picture Diagramming and CATWOE to Capture Staff Perceptions and Inform
Service Improvement Scenarios
91

2.4 Targeted Set of Service
Improvement Opportunities
A guided discussion with radiology decision makers
(Radiology manger and Clinical Director) was
arranged in which the soft copy version of the RP
diagram and the original staff diagram were
presented. The intention of showing both was to
reassure participants of the informal nature of the
drawings whilst also providing the clarity of the
“cleaned up” version. Decision makers were
afforded the opportunity to contribute to the RP
(step 7) and asked to identify a targeted set of
culturally feasible and desirable changes to the
service (step 9). Decision makers were prompted to
consider potential changes to the CT schedule, the
number of CT scanners, the addition of staff and
skill mix of staff etc (Crowe, Knowles, et al., n.d.).
3 RESULTS
3.1 RP Diagram
The softy copy final version of the RP (Figure 3)
captures the key features of the CT service, such as
staff activities, the process, the environment, the
delays, distractions and external factors contributing
to workload and affecting service delivery. A clock
and phone are visible in each room to represent the
time sensitive nature of the work and constant “often
repetitive” communications occurring between staff.
Background chatter whilst scanning is a common
occurrence.
A clear definition is made between the inpatient
and outpatient services by placing these groups on
separate floors of the hospital. The inpatient service
includes the acute medical assessment unit and
accident and emergency department, whose patient’s
generally require an immediate service. The
experience of the GP in the community is depicted
and their awareness of growing waiting lists. GP and
outpatient waiting lists appear as an external factor
as these do not impact the daily operations of the
service and were a concern at management/decision
maker level. A graphic representing an inpatient
depicts how patient complexity varies in terms of a
patient’s care needs, infectiousness, mobility and
exam complexity. The outpatients are seen to be
experiencing delays and the staff are conscious of
the inconvenience a delay causes and feel
responsible.
The frustration of the staff nurse as they seek to
confirm a patient’s future scan time is also depicted.
They just want a verbal answer and do not want to
refer to the information system; they may not
remember their password or may imagine a phone
call is quicker than logging on to the RIS/PACS.
Bad habits have appeared over the years and they are
conditioned to expect verbal confirmation of a time.
They are under pressure to ensure a scan happens in
a timely manner because they know discharge is
dependent on it or are aware the patient is waiting a
long time or is deteriorating.
External factors affecting service provision are
grouped to the left of the diagram and appear outside
of the drawing of the hospital. It was agreed to
locate waiting lists as external as they were not a
concern for CT service provision on a daily basis.
Age and infection and chronic diseases and
newspaper headline also appear externally.
3.2 Contributing Example
The RP diagram shown in Figure 3 represents
various contributions by participants. For example,
one radiographer (MD) created their own drawing
using the metaphor of a bus Figure 4. The halo
represents the radiographer arriving to work like an
“angel”. Conscious of staying ahead of demand, the
radiographer arrives early to prepare the necessary
blood results and information required for each
patient request. This all changes by 11am however at
which point their “heart is broken” and their “brow
furrowed” due to the number of phone calls and
interruptions.
This radiographer is also represented in the RP
diagram in Figure 3 and is seen to have many items
on their mind. Phone calls result where a referring
doctor is looking for another phone number or where
they are seeking verbal confirmation of a scan time
which may already be available on the Radiology
Information System (RIS). They describe being the
lead radiographer in CT as like being the driver of a
bus with other staff on board. If the bus goes into
third gear there will be casualties – speed kills. If
they stay in first or second gear everyone is smiling
at the end of the day. The mantra of the radiographer
is “one man, one job”, while it may be possible to
scan (acquire images), plan (schedule work) and run
(transfer patients, test intravenous lines, inject,
position patients etc), errors are an inevitably of that.
KMIS 2020 - 12th International Conference on Knowledge Management and Information Systems
92
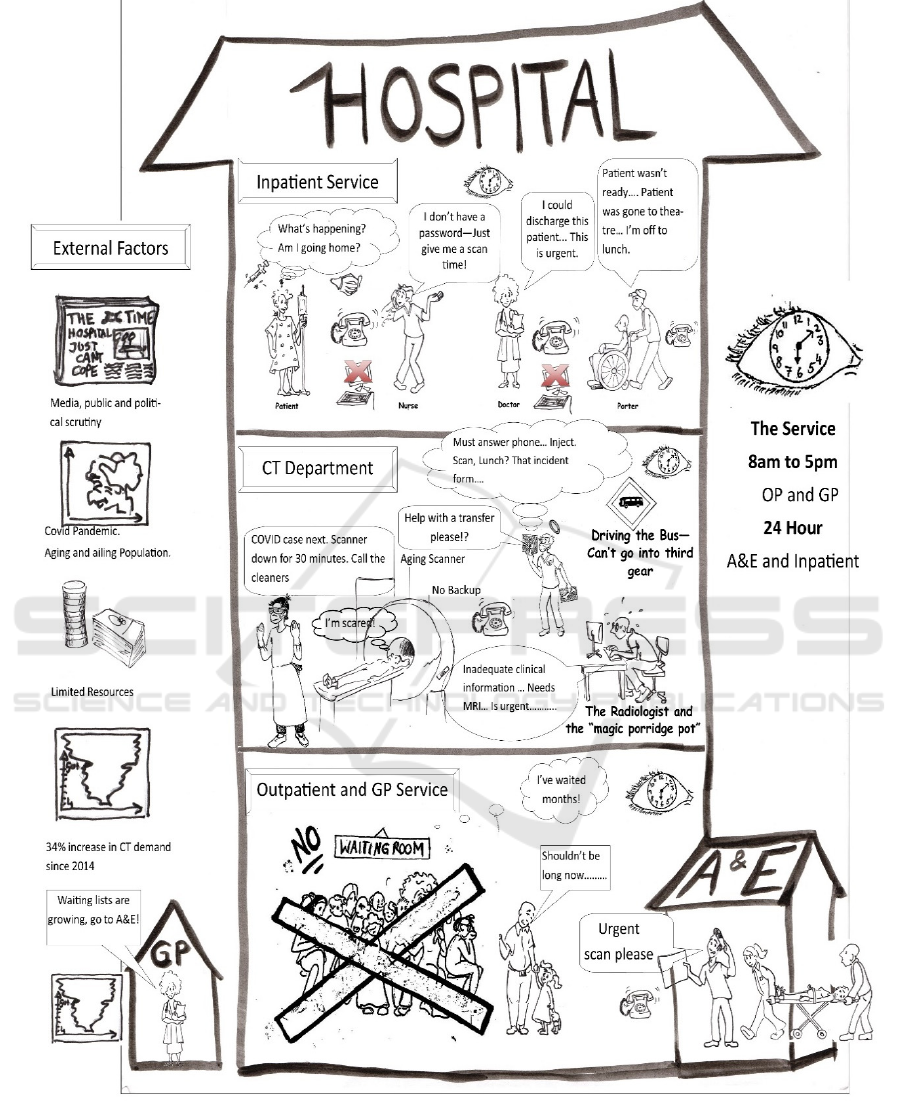
Figure 3: Soft Copy RP Diagram created by the research team and validated by participants and staff.
3.3 Perceived Issues and Constraints of
the Service
Table 3 presents a sample of the total issues and
constraints (n=32) identified by staff during the RP
diagramming and CATWOE interviews.
Driving the Bus: A Radiology Case Study Utilizing Rich Picture Diagramming and CATWOE to Capture Staff Perceptions and Inform
Service Improvement Scenarios
93
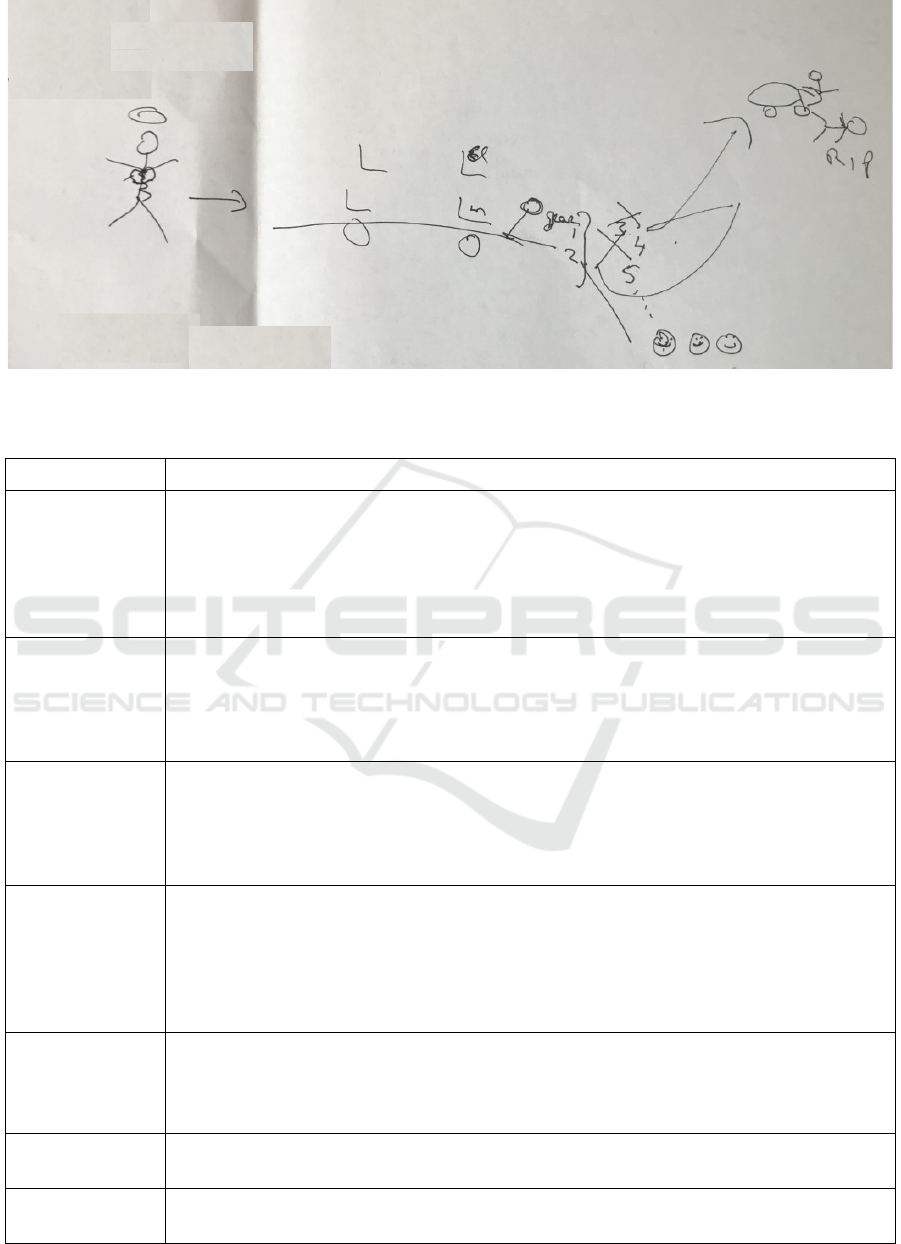
Figure 4: The Bus - A Radiographer's metaphor for the CT service.
Table 2: Sample of service issues and constraints.
Source Perceived Issue
Clinical
Specialist
Overall demand is increasing and the CT service has multiple referral sources with
patients of varying priority, priority may change over time. Constant reprioritization is
required.
Phone calls and visits from the various referral sources cause time delays and
distract radiographers who are scanning. Staff want verbal confirmation of scan times
even though this information is available on the RIS.
Radiographer1 In order to have all the information I need to hand; I have to transcribe information
onto a paper schedule. Some use the RIS but this works for me and saves me from
going in and out of multiple screens, multiple times or relying on my memory.
Delays occur when staff are not available for the manual transfer of patients from
their bed/trolley to the CT scanner and back again.
Radiographer2 The skill mix amongst the radiographers and percentage of staff able to cannulate
and inject patients has been depleted due to recent staffing changes.
Delays result where transportation is not immediately available for inpatients, this
may be due to porter or wheelchair shortages or where patients on the wards are not
ready to leave the ward when the patient arrives.
Radiographer3 Quite often someone forgets to arrange transportation for the inpatients who are
drinking on the wards. There can be up to 3 calls per inpatient to arrange preparation
and transportation and to discuss whatever time’s been allocated to them.
We need a dedicated workstation for planning – there are constant demands for the
PC from multiple staff which breaks concentration when planning. The Lab system and
RIS/PACS systems should be side by side or on the same PC.
Porter: At break times we may only have one porter covering several areas
Patients are not always ready to be transported when we arrive on the ward and we
have to ring back to CT to explain, or we think they are going to need a wheelchair but
we arrive and they need a bed.
Manager: Waiting lists are increasing and so is demand.
The CT scanner is old and its tube is no longer fully covered under service contract.
Nurse Post colonoscopy we provide a hot drink and a sandwich. We have to ring the
canteen for this and the tea is often cold on arrival.
KMIS 2020 - 12th International Conference on Knowledge Management and Information Systems
94
3.4 Changes as a Result of the RP
Four changes were implemented following the use
of the SSM tools.
1. Clinical specialist – Issue (1)
A handover tool was designed for staff to ensure that
information relating to patients requiring a scan was
not lost between the day and night shift who may not
see each other. Such information may include
inpatients being prepped with oral contrast in
advance of a scan or requiring hydration or repeated
blood tests.
2. Clinical specialist – Issue (2)
Ward staff were offered RIS/PACS training and
advised to consult the RIS/PACS for to check if a
time had been allocated to an inpatient scan request.
The practice of verbally informing ward staff of
scheduled times ceased.
3. Radiographer 3 – Issue (1)
The method of arranging transportation for
inpatients requiring oral contrast was changed.
Previously a radiographer was responsible for
arranging transportation for inpatients 10 minutes in
advance of the scan so as to ensure no delay. Post
research the healthcare assistants undertook to notify
clerical staff of the intended scanning time and the
need for transportation.
4. Nurse - Issue (1)
Post CT examinations such as CT colonoscopy and
CT cardiac angiogram patients were previously
provided with refreshments such as Tea and
scone/sandwich. One phone call to the canteen was
made per patient and delays were common. Changes
were made where a daily delivery of sandwiches and
juice boxes to CT was arranged and the necessity to
place individual orders removed. A targeted set of
potential service improvement scenarios were iden-
tified in the final step of the methodology (Table 3).
4 DISCUSSION
4.1 General Study Reflection
This paper sought to elicit knowledge from
radiology staff while creating a shared
understanding of the CT service using RPs and
CATWOE statements and to identify potentially
feasible and culturally desirable targeted service
improvements. This study showed that the important
aspects of a service could be represented on a RP
Table 3: Potential service improvement scenarios.
Service Improvement Scenario Benefits
Extended CT Schedule: Changing the CT
Schedule from 8.30 to 5 to 8am to 8pm.
Outpatient capacity increased, waiting lists
decreased. Dedicated outpatient and GP block booking
possible minimizing disruption from inpatient demand.
Addition of a permanent second CT scanner Inpatient and outpatient cohorts will have
dedicated scanners.
Less infection control related downtime on
outpatient scanner. Waiting lists will be decreased.
The addition of more preparation and observation
space.
Combined simulation:
The addition of a temporary mobile second
scanner to be located in the car park.
Replace old scanner with new permanent
scanner.
Run two scanners until a point in time where
the waiting list is reduced to effectively zero.
Removed temporary scanner and introduce an
extended day 8am to 8pm scanning scheduled on
the new scanner.
Waiting list is addressed. The extended schedule
would allow outpatients to be blocked booked
minimising interaction between the cohorts. The
extended should address the current increase in
demand though waiting list would be expected to
accumulate again.
Driving the Bus: A Radiology Case Study Utilizing Rich Picture Diagramming and CATWOE to Capture Staff Perceptions and Inform
Service Improvement Scenarios
95

diagram and that the process of creating and
validating the RP was a powerful means for staff to
reflect on the service they worked in. The final RP
considered multiple perspectives and reflected a
multitude of perceived problems, service constraints
and factors contributing to workload (P Checkland,
1999; Lewis, 1992) (Rcsi, 2011). The SSM approach
adopted yielded insights rather than testable results
and required the researcher to work with groups
when deciding on what to include (Ackermann,
2012b).
The final RP was constructed using the software
Microsoft paint and Microsoft publisher which
contravenes the predominantly freeform and
unstructured nature favored for RP generation(Berg,
2015). As the purpose of the model was to convey a
shared understanding and to disseminate to a wider
community a more professional finish and clarity
was required. The RP however does not purport to
describe every CT department’s service claiming
instead to be a representation of the reality of those
interviewed(Bell et al., n.d.; Rodriguez-Ulloa &
Paucar-Caceres, 2005). While RPs are usually
considered merely a by-product of the process of
investigation, as a communication tool the final RP
fulfils its purpose of communicating the shared
understanding and perspectives of the healthcare
staff(P Checkland, 1999; Fougner & Habib, 2008;
Lewis, 1992) . This RP is the first of its kind as no
other rich picture of a CT service has been found for
objective comparison.
Waiting lists have purposefully been described as
an external factor as they are not a concern for those
directly involved in providing the service on a daily
basis. They are an unintended consequence or
emergent behavior related to the increase in demand
and become a managerial or governance problem
over time (Marshall et al., n.d.; Sterman, 1994).
Examples have been provided of four immediate
changes which resulted from the RP diagramming
process. This reaffirms RP diagramming as a vehicle
for action research, changing the problem situation in
the very process of researching it (Morrison &
Lilford, 2001; Rose, 1997). These changes were not
imposed, or even knowable in advance(Bate, 2000).
Gaining buy-in for the project was aided by ensuring
that important and relevant issues were identified, and
that the work resulted in quick tangible changes and
benefits to the department(P R Harper & Pitt, 2004).
4.2 Challenges
The full list of perceived issues highlights the
challenges facing modern radiology departments and
these challenges will not be solved by this study.
While we cannot analyze all the issues within the
scope of this study, one issue is elaborated on; the
staff experience of how the RIS and PACS support
workflow. Feedback indicated that the information
system did not adequately support the CT workflow.
Staff highlighted how RIS information regarding the
patient’s blood results needed to be verified on a
separate laboratory information system and how at
the point of scanning a radiographer was required to
toggle between two screens to ensure that they had
visibility of the clinical history and comments and
blood results/prompts. As a workaround some
radiographers were found to use a paper schedule to
organize the daily list and document the blood
results and other considerations such as pregnancy
and infection status on said paper schedule, thus
evidencing a gap between how the system is used
and how it was intended to be used (Unertl,
Weinger, Johnson, & Lorenzi, 2009). Radiology
staff also listed the non compliance of ward staff
regards checking the status of CT scan times on the
RIS as an issue which resulted in phone call
interruptions and distractions. The ability of the
department to scan patients is constrained by the
effort required to safely organize inpatient exams
and further research is required into the ergonomics
of the information system (Unertl et al., 2009).
4.3 Targeted Service Improvement
Recommendations
Consensus was reached on three culturally desirable
and feasible service improvement recommendations
(Table 4). RP diagramming provided a strategic
opportunity for meaningful decision-maker
involvement allowing a tangible space to discuss and
negotiate worthwhile recommendations for change
(Bell et al., n.d.). While some argue that SSM is not
a decision making tool and rather a post hoc measure
to justify the status quo (Bergvall-Kareborn, 2002) it
did, in this case study, arrive at a service
improvement recommendation (number 3) that had
not previously been considered by either facilitator
or management staff. Benefits of the inclusion of
decision makers in the research project included
providing them with an opportunity to internalize
research knowledge, promotion of trust and interest
in the project, higher likelihood of implementation
and a more meaningful focus than it might otherwise
have had (Paul Robert Harper & Pitt, 2004; Monks,
Robinson, & Kotiadis, 2016; Ross, Lavis,
Rodriguez, Woodside, & Denis, 2003).
KMIS 2020 - 12th International Conference on Knowledge Management and Information Systems
96

4.4 Research Limitations and Further
Work
In operations research lacunae are gaps where deep
fundamental questions remain unanswered
(Ormerod, 2014). SSM requires the OR researcher to
ask whether the voice of all the affected was
included. A limitation of this work is that the voice
of the patient and general practitioner (GP) was not
included in the process of creating a RP diagram
(Ormerod, 2014). While the seniority and experience
of participating staff was high, staff were primarily
chosen for interview based on their availability.
SSM is subjective in nature with the researcher
acting as a research tool. In this case the researcher
was employed as a CT radiographer in the case
study department for over six years, ensuring
proximity with staff in both a physical and social
sense and minimizing the potential impact of the
Hawthorn effect. (McCarney et al., 2007) Future
work will focus on the testing of the targeted set of
service improvements scenarios in a simulation
model of the radiology service.
5 CONCLUSIONS
The creation of a RP provided an opportunity for
staff to reflect on the environment they work in and
service they provide and resulted in some immediate
workflow changes. While the RP may not resonate
fully with every CT department’s service it provides
an effective tool for sharing this department’s
experience of service provision and is a useful
alternative to a text based description of a CT
service. As well as identifying specific service
improvements the list of perceived issues presents
decision makers with multiple areas for
improvement. Rich picture diagramming and SSM
permit radiographers to consider the “familiar
landscape” of a radiology department with “new
eyes” (Proust, 1934).
ACKNOWLEDGEMENTS
We would like to acknowledge the support and
assistance of the staff in Portiuncula Hospital,
Ballinasloe, Co Galway.
Thank you sincerely to the creator of the "Driver
of the Bus", Senior Radiographer, Maeve Darcy and
to CT Clinical Specialist, Avril Hanley.
REFERENCES
Ackermann, F. (2012). Problem structuring methods “in
the Dock”: Arguing the case for Soft or. European
Journal of Operational Research, 219(3), 652–658.
https://doi.org/10.1016/j.ejor.2011.11.014
Bate, P. (2000). Synthesizing research and practice: Using
the action research approach in health care settings.
Social Policy and Administration, 34(4), 478–493.
https://doi.org/10.1111/1467-9515.00205
Bell, S., Berg, T., & Morse, S. (2019). Towards an
Understanding of Rich Picture Interpretation. Systemic
Practice and Action Research, 32, 601-614
https://doi.org/10.1007/s11213-018-9476-5
Berg, T. (2015). Rich Picture: The Role of the Facilitator.
Systemic Practice and Action Research, 28(1), 67–77.
https://doi.org/10.1007/s11213-014-9318-z
Bergvall-Kareborn, B. (2002). Enriching the model-
building phase of soft systems methodology.
(Research Paper). Systems Research and Behavioral
Science, 19(1), 27–49. Retrieved from https://go-gale-
com.libgate.library.nuigalway.ie/ps/i.do?p=AONE&s
w=w&issn=10927026&v=2.1&it=r&id=GALE%7CA
83281263&sid=googleScholar&linkaccess=fulltext
Booker, M. T., O’Connell, R. J., Desai, B., & Duddalwar,
V. A. (2016). Quality Improvement with Discrete
Event Simulation: A Primer for Radiologists. Journal
of the American College of Radiology, 13(4), 417–
423. https://doi.org/10.1016/j.jacr.2015.11.028
Central Statistics Office. (2015). Regional Population
Projections 2016 - 2031 - CSO - Central Statistics
Office. Retrieved from http://www.cso.ie/en/
releasesandpublications/er/rpp/regionalpopulationproje
ctions2016-2031/
Checkland, P. (1999). Systems thinking, systems practice.
John Wiley. Retrieved from https://books.google.ie/
books?id=Ct0PAQAAMAAJ
Checkland, Peter. (1985). Achieving “Desirable and
Feasible” Change: An Application of Soft Systems
Methodology. The Journal of the Operational
Research Society, 36.
Checkland, Peter. (1999). Soft systems methodology : a
30-year retrospective. (Peter Checkland, Ed.) ([New
ed.].). Chichester: Chichester : John Wiley.
Conlon, M., & Molloy, O. (2019). Knowledge
management in healthcare: Information requirements
when creating a decision support tool in radiology.
IC3K 2019 - Proceedings of the 11th International
Joint Conference on Knowledge Discovery,
Knowledge Engineering and Knowledge Management,
3(Ic3k), 317–324. https://doi.org/10.5220/ 000835270
3170324
Crowe, S., Brown, K., Tregay, J., Wray, J., Knowles, R.,
Ridout, D. A., Utley, M. (2017). Combining
qualitative and quantitative operational research
methods to inform quality improvement in pathways
that span multiple settings. BMJ Quality & Safety,
26(8), 641–652. https://doi.org/10.1136/bmjqs-2016-
005636
Crowe, S., Knowles, R., Wray, J., Tregay, J., Ridout, D.
Driving the Bus: A Radiology Case Study Utilizing Rich Picture Diagramming and CATWOE to Capture Staff Perceptions and Inform
Service Improvement Scenarios
97

A., Utley, M., Brown, K. L. (2016). Identifying
improvements to complex pathways: evidence
synthesis and stakeholder engagement in infant
congenital heart disease. BMJ Open, 6(6).
https://doi.org/10.1136/bmjopen-2015-010363
Fougner, M., & Habib, L. (2008). If I had a rich picture⋯:
Insights into the use of “soft” methodological tools to
support the development of interprofessional
education. Journal of Interprofessional Care, 22(5),
488–498. https://doi.org/10.1080/13561820802168125
Goebel, E. A., Cristancho, S. M., & Driman, D. K. (2019).
Pimping in Residency: The Emotional Roller-Coaster
of a Pedagogical Method–A Qualitative Study Using
Interviews and Rich Picture Drawings. Teaching and
Learning in Medicine, 31(5), 497–505.
https://doi.org/10.1080/10401334.2019.1610658
Granja, C., Almada-Lobo, B., Janela, F., Seabra, J., &
Mendes, A. (2014). An optimization based on
simulation approach to the patient admission
scheduling problem: Diagnostic imaging department
case study. Journal of Digital Imaging, 27(1), 33–40.
https://doi.org/10.1007/s10278-013-9626-3
Greasley, A., & Owen, C. (2018). Modelling people’s
behaviour using discrete-event simulation: A review.
International Journal of Operations & Production
Management, 38(5), 1228-1244. https://doi.org/
10.1108/ IJOPM-10-2016-0604
Harper, P R, & Pitt, M. A. (2004). On the Challenges of
Healthcare Modelling and a Proposed Project Life
Cycle for Successful. The Journal of the Operational
Research Society, 55(6), 657–661.
https://doi.org/10.1057/palgrave.jors.2601719
Howick, S., & Ackermann, F. (2011). Mixing OR methods
in practice: Past, present and future directions.
https://doi.org/10.1016/j.ejor.2011.03.013
Lakdawalla, D. N., Bhattacharya, J., & Goldman, D. P.
(2004). Are The Young Becoming More Disabled?
Health Affairs, 23(1), 168–176. https://doi.org/
10.1377/hlthaff.23.1.168
Lamé, G., Jouini, O., Stal-Le Cardinal, J., & Lam, G.
(2019). Combining Soft Systems Methodology,
ethnographic observation, and discrete-event
simulation: A case study in cancer care. Journal of the
Operational Research Society, 71(10), 1545-1562.
https://doi.org/10.1080/01605682.2019.1610339
Lewis, P. J. (1992). Rich picture building in the soft
systems methodology. European Journal of
Information Systems, 1(5), 351–360. https://doi.org/
10.1057/ejis.1992.7
MacDonald, S. L. S., Cowan, I. A., Floyd, R. A., &
Graham, R. (2013). Measuring and managing
radiologist workload: A method for quantifying
radiologist activities and calculating the full-time
equivalents required to operate a service. Journal of
Medical Imaging and Radiation Oncology, 57(5).
https://doi.org/10.1111/1754-9485.12091
Marshall, D. A., Burgos-Liz, L., Eng, I., Ijzerman, M. J.,
Osgood, N. D., Padula, W. V, Crown, W. (2015).
Applying Dynamic Simulation Modeling Methods in
Health Care Delivery Research-The SIMULATE
Checklist: Report of the ISPOR Simulation Modeling
Emerging Good Practices Task Force Background to
the Task Force. ISPOR Task Force Report, 18(1), 5-
16. https://doi.org/10.1016/j.jval.2014.12.001
McCarney, R., Warner, J., Iliffe, S., Haselen, R. van,
Griffin, M., & Fisher, P. (2007). The Hawthorne
Effect: a randomised, controlled trial. BMC Medical
Research Methodology, 7, 30. https://doi.org/10.1186/
1471-2288-7-30
Monks, T., Robinson, S., & Kotiadis, K. (2016). Can
involving clients in simulation studies help them solve
their future problems? A transfer of learning
experiment. European Journal of Operational
Research, 249(3), 919–930. https://doi.org/10.1016/
j.ejor.2015.08.037
Morrison, B., & Lilford, R. (2001). How Can Action
Research Apply to Health Services? Qualitative health
research, Vol. 11 No. 4, July 2001 436-449
Naylor A (1992). Quantitative assessment of radiology
workload and facilities requirements. European
Journal of Radiology, 15 210-215.
Oliva, R. (2002). Tradeoffs in responses to work pressure
in the service industry. IEEE Engineering
Management Review, 30(1), 53–62.
https://doi.org/10.1109/EMR.2002.1022405
Ondategui-Parra, S., Bhagwat, J. G., Gill, I. E., Nathanson,
E., Seltzer, S., & Ros, P. R. (2004). Essential practice
performance measurement. Journal of the American
College of Radiology, 1(8), 559–566.
https://doi.org/10.1016/j.jacr.2004.03.020
Ormerod, R. J. (2014a). The mangle of OR practice:
Towards more informative case studies of “technical”
projects. Journal of the Operational Research Society,
65(8), 1245–1260. https://doi.org/10.1057/jors.
2013.78
Pitman, A., Cowan, I. A., Floyd, R. A., & Munro, P. L.
(2018). Measuring radiologist workload: Progressing
from RVUs to study ascribable times. Journal of
Medical Imaging and Radiation Oncology, 62(5),
605–618. https://doi.org/10.1111/1754-9485.12778
Proust, M. (1934). Remembrance of things past. New
York: Random House.
Rashwan, W. (2017). An Integrated Framework for
Staffing and Shift Scheduling in Hospitals [Doctoral
dissertation, Technological University Dublin].
Arrow@TUDublin. https://arrow.dit.ie/busdoc/25/
RCSI. (2011). Measuring Consultant Radiologist
workload in Ireland. The Board of the faculty of
Radiologists, Royal College of Surgeons, Ireland
Reeves, P. J. (2005). Chronic disease and independence in
old age: A case study. Radiography, 12(3), 253-257.
https://doi.org/10.1016/j.radi.2005.06.003
Rodriguez-Ulloa, R., & Paucar-Caceres, A. (2005). Soft
System Dynamics Methodology (SSDM): Combining
Soft Systems Methodology (SSM) and System
Dynamics (SD). Systemic Practice and Action
Research, 18(3). https://doi.org/10.1007/s11213-005-
4816-7
Rose, J. (1997). Soft systems methodology as a social
science research tool. Systems Research and
KMIS 2020 - 12th International Conference on Knowledge Management and Information Systems
98

Behavioral Science, 14(4), 249–258. https://doi.org/
10.1002/(SICI)1099-1743(199707/08)14:4<249::AID-
SRES119>3.0.CO;2-S
Ross, S., Lavis, J., Rodriguez, C., Woodside, J., & Denis,
J. L. (2003). Partnership experiences: Involving
decision-makers in the research process. Journal of
Health Services Research and Policy, 8(SUPPL. 2),
26–34. https://doi.org/10.1258/135581903322405144
Sterman, J. (1994). Learning in and about complex
systems. System Dynamics Review, 10(2–3), 291–330.
Sturm, R., Ringel, J., Lakdawalla, D., Bhattacharya, J.,
Goldman, D., Hurd, M., Andreyeva, T. (2007).
Obesity and Disability: The Shape of Things to Come.
RAND Corporation. https://doi.org/10.7249/RB9043-1
Sunshine, J. H., & Burkhardt, J. H. (2000). Radiology
groups’ workload in relative value units and factors
affecting it. Radiology, 214(3), 815–822.
Unertl, K. M., Weinger, M. B., Johnson, K. B., & Lorenzi,
N. M. (2009). Describing and Modeling Workflow
and Information Flow in Chronic Disease Care.
Journal of the American Medical Informatics
Association, 16(6), 826–836.
https://doi.org/10.1197/jamia.M3000
Van Lent, W. A. M., Deetman, J. W., Teertstra, H. J.,
Muller, S. H., Hans, E. W., & Van Harten, W. H.
(2012). Reducing the throughput time of the
diagnostic track involving CT scanning with computer
simulation. European Journal of Radiology, 81, 3131–
3140. https://doi.org/10.1016/j.ejrad.2012.03.012
Driving the Bus: A Radiology Case Study Utilizing Rich Picture Diagramming and CATWOE to Capture Staff Perceptions and Inform
Service Improvement Scenarios
99
