
Knowledge-based Reliability Metrics for Social Media Accounts
Nuno Guimaraes
1 a
, Alvaro Figueira
1 b
and Luis Torgo
2 c
1
CRACS/INESCTEC and University of Porto, Porto, Portugal
2
Faculty of Computer Science, Dalhousie University, Halifax, Canada
Keywords:
Reliability Metrics, Social Media, Unreliable Accounts.
Abstract:
The growth of social media as an information medium without restrictive measures on the creation of new
accounts led to the rise of malicious agents with the intend to diffuse unreliable information in the network,
ultimately affecting the perception of users in important topics such as political and health issues. Although
the problem is being tackled within the domain of bot detection, the impact of studies in this area is still
limited due to 1) not all accounts that spread unreliable content are bots, 2) human-operated accounts are
also responsible for the diffusion of unreliable information and 3) bot accounts are not always malicious (e.g.
news aggregators). Also, most of these methods are based on supervised models that required annotated data
and updates to maintain their performance through time. In this work, we build a framework and develop
knowledge-based metrics to complement the current research in bot detection and characterize the impact and
behavior of a Twitter account, independently of the way it is operated (human or bot). We proceed to analyze
a sample of the accounts using the metrics proposed and evaluate the necessity of these metrics by comparing
them with the scores from a bot detection system. The results show that the metrics can characterize different
degrees of unreliable accounts, from unreliable bot accounts with a high number of followers to human-
operated accounts that also spread unreliable content (but with less impact on the network). Furthermore,
evaluating a sample of the accounts with a bot detection system shown that bots compose around 11% of the
sample of unreliable accounts extracted and that the bot score is not correlated with the proposed metrics.
In addition, the accounts that achieve the highest values in our metrics present different characteristics than
the ones that achieve the highest bot score. This provides evidence on the usefulness of our metrics in the
evaluation of unreliable accounts in social networks.
1 INTRODUCTION
Social Networks have revolutionized the way users
communicate online. From a journalistic perspective,
these platforms allow the publication and spreading of
information at a speed that traditional news medium
(television and newspapers) do not allow. From a
personal user point of view, social networks are a
medium for publication and discussion of ideas. The
exponential growth of users in these platforms has at-
tracted the interest of companies, personalities, and
other important entities that saw an opportunity in so-
cial networks to influence and share their brand, opin-
ions, and thoughts.
Social networks also change the way information
is consumed. Due to the amount of new content pub-
a
https://orcid.org/0000-0003-2854-2891
b
https://orcid.org/0000-0002-0507-7504
c
https://orcid.org/0000-0002-6892-8871
lished every second, users often rely on a minimal
number of indicators (such as post title and image) to
decide if they will proceed to read further. Not only
this affects the way news outlets interact with their
audience (forcing them to adapt to a reality where
information is consumed at a high rate and in large
quantities) (Newman, 2011) but also leads to the rise
of unreliable content spreading. In fact, the freedom
of creating accounts with a high degree of anonymity
contributes towards the publication of unreliable and
malicious content. This type of content has been re-
cently used as a method to influence user opinions on
important questions with a major focus on political-
driven events such as elections, protests, laws, and re-
forms. Several studies (Nikolov et al., 2015; Quattro-
ciocchi et al., 2016; Wang et al., 2015) have confirmed
that phenomenons that influence user perceptions and
opinions are present in social media. For example,
the echo chamber/filter bubble effect refers to the cus-
tomization of the content provided by social media
Guimaraes, N., Figueira, A. and Torgo, L.
Knowledge-based Reliability Metrics for Social Media Accounts.
DOI: 10.5220/0010140403390350
In Proceedings of the 16th International Conference on Web Information Systems and Technologies (WEBIST 2020), pages 339-350
ISBN: 978-989-758-478-7
Copyright
c
2020 by SCITEPRESS – Science and Technology Publications, Lda. All rights reserved
339

algorithms to each individual user, modeling the con-
tent shown to their individual preferences. This phe-
nomenon restrains the diversification of the content
presented to each individual user. In addition, users
tend to connect with persons/accounts that share sim-
ilar interests, narrowing opinions, ideas, and informa-
tion shared to common or similar perspectives. An-
other well-studied phenomena affecting users’ opin-
ions in social media is the bandwagon-effect. This
occurs when a user is persuaded due to exposure to
the same content from several different sources. This
behavior is based on the underlying principle that the
probability of a certain individual adopting a certain
idea, opinion, or belief increases the more other peo-
ple have adopted it. The spreading and consumption
of unreliable content enhances the occurrence of this
phenomenon with serious consequences. Therefore,
it becomes crucial that social network users become
aware of what content is unreliable and which ac-
counts are spreading it.
Companies such as Facebook and Twitter are cur-
rently testing and implementing new measures to deal
with the propagation of unreliable content on their
platforms. For example, Twitter has recently intro-
duced a feature to add context to certain claims made
in tweets (Fung, 2020) while Facebook is working
with fact-checking services to label their posts (Face-
book, 2020). Nonetheless, adding context and fact-
checking still relies heavily on human annotation and
comprehension and this type of labeling can only oc-
cur after a rumor or fake news begins circulation.
Another focus has been to detect accounts that
are operated automatically (bots). These software-
controlled accounts can post content and interact with
other accounts (human-operated or not) (Varol et al.,
2017b; Davis et al., 2016). Several studies have
worked on this approach (Varol et al., 2017a; Gi-
lani et al., 2017; Benevenuto et al., 2010). How-
ever, it is also important to mention that some bot
accounts are not associated with the spreading of un-
reliable content and have other purposes (p.e. news
aggregators). In addition, due to the psychological
phenomenons previously mentioned, some human-
operated accounts are also responsible for spreading
unreliable content. Consequently, the distinction be-
tween bot and human-operated accounts has its limi-
tations on the detection of accounts that publish and
diffuse unreliable content.
Therefore, in this study, we focus on building a
framework capable of extracting and annotating un-
reliable accounts based on the impact that they can
pose to the social network. Our definition of unreli-
able accounts includes bots and human-operated ac-
counts (while in bot detection studies, human oper-
ated accounts are normally associated with reliable
accounts). In addition, we present knowledge-based
metrics to signal unreliable accounts in social net-
works and thus not focusing on supervised algorithms
whose performance can decrease through time (Varol
et al., 2017a). It is our goal to clearly distinguish ac-
counts that are unreliable and have an impact on the
network from those that are not (whether is because
they do not spread unreliable content or because the
unreliable content is in low quantity or withing a very
limited reach).
In the next section, we review the current state of
the art on the detection and analysis of unreliable ac-
counts as well as some metrics already developed for
social networks. Next, we introduce the process used
to extract unreliable content from Twitter and then we
propose a set of metrics based on that knowledge. In
section 4 we analyze accounts with high unreliable
and reliable scores in the metrics proposed and evalu-
ate the necessity of these metrics by comparing them
with a state of the art bot detection system. Finally, in
section 4.2, we draw some conclusions and lay foun-
dations for future work.
2 BACKGROUND AND RELATED
WORK
A large number of studies have focused on the de-
velopment and application of social media metrics.
For example, in marketing, the authors in (Mu
˜
noz-
Exp
´
osito et al., 2017) proposed a set of metrics to
measure user engagement with companies/brands on
Twitter. These metrics (Interest and Engagement) use
the interactions of the users (replies, retweets, and fa-
vorites) with a brand’s account. Another well-studied
area is altmetrics in scientific research. This corre-
sponds to alternative metrics that measure the impact
of scientific research in the community. For exam-
ple, D
´
ıaz-Faes et al. (2019) use a set of metrics to
characterize the impact of scientific research such as
shares of tweets to paper, number of retweets link-
ing to scientific publication, and number of distinct
publications tweeted. Another work adapts the h-
index metric to measure the impact of a publication on
Twitter using the tweets as publications and retweets
or favorites as citations (Razis and Anagnostopoulos,
2014).
Several other metrics measure different aspects of
a Twitter account. Activity metrics such as Twee-
tRank and ActivityScore (Yuan et al., 2013) mea-
sure how active an account is in the network (in gen-
eral or in a specific topic). Popularity metrics weigh
the reach of account popularity using its close con-
WEBIST 2020 - 16th International Conference on Web Information Systems and Technologies
340

nections. Examples of these metrics can be the in-
degree measure (using followers and followees count)
(Hajian and White, 2011) and the Twitter Followers-
Followees ratio (Bigonha et al., 2012). Nevertheless,
it is the metrics that allow quantifying the influence of
a user/account that are largely studied. Adaptations of
the Closeness (size of the shortest path from a node
to every other) and Betweenness (number of shortest
paths that pass through the node) were proposed in a
social network scenario. Furthermore, different au-
thors proposed variations of the Page Rank algorithm
applied to social networks (Riquelme and Gonz
´
alez-
Cantergiani, 2016; Yamaguchi et al., 2010).
In spite of the large number of metrics proposed
in the literature, there seems to be a lack of works
that apply these metrics in the context of unreliable
and/or fake account detection in social networks. As
a matter of fact, regarding reliability account analysis,
the majority of works have focused on the detection
of bot or spam accounts. These accounts are highly
associated with the spread of fake and ad-based con-
tent through the network. Gilani et al. Gilani et al.
(2017) developed a methodology and built a classi-
fier to distinguish between bot and human accounts.
The authors use features such as the age of the ac-
count, number of tweets and source type and conduct
a set of experiments in which several classifiers were
tested with accounts whose popularity ranged from
1 thousand to 1 million followers. The best model
achieves an accuracy of approximately 80%, which
is near the agreement obtained by human annotators.
Similar work is presented in (Benevenuto et al., 2010)
where the authors use content and user behavior at-
tributes (e.g. number of spam words in tweets, num-
ber of mentions per tweet and number of interactions
with other users) to build a Support Vector Machine
classifier with 70% accuracy in detecting spammers
and 96% in detecting non-spammers. Another work
(Chu et al., 2012) presents a system to classify ac-
counts in social media in three categories: human,
bot, and cyborg (which refers to accounts that are bot-
assisted). The system is capable of distinguishing the
three categories with precision above 90%. Finally,
the work in (Varol et al., 2017a) presents a bot detec-
tion system based on sentiment, time, content, friends
network, and account features to determine the bot
score of Twitter accounts. The system uses random
forests and obtained an AUC of 0.95.
Although the detection of bots and spam spread-
ing accounts can be related to the task of classifying
account reputation, it works only as an underlying
problem since accounts that spread unreliable infor-
mation can be bot or human-operated. Few works try
to combine unreliable accounts and metrics. In other
words, to use social network metrics to quantify the
impact and influence that an unreliable account has on
the network. An on-going work proposes spread and
skepticism metrics to evaluate if the wisdom of the
crowd is enough to distinguish false and true claims
(Finn et al., 2015). However, it is very preliminary
work and differentiates in concept and type of data
(the authors focus on claims). Yet another work (Al-
Khalifa and Al-Eidan, 2011) relies on supervised and
similarity metrics to predict news credibility on Twit-
ter. Nonetheless, this study is only focused on assign-
ing a credibility score to the content instead of the
accounts.
This work tries to tackle the current gap in the
state of the art by addressing account reliability clas-
sification in general (bots and human-operated ac-
counts) and using knowledge-based metrics to per-
form that classification.
3 ACCOUNT RELIABILITY
FRAMEWORK
In this section, we propose a framework to retrieve
and score accounts based on their behavior (i.e. the
content they post) and their influence on the net-
work. We adopt and modify a data retrieval method-
ology presented in previous works (Guimar
˜
aes et al.,
2018; Guimaraes et al., 2020), and complement it
with newly developed metrics to classify each account
regarding its reliability. We start by establishing some
requirements that we aim for our framework. Un-
like similar works, it is our goal that the framework
retrieves and annotates accounts in an unsupervised
fashion. We opt for this path due to major constraints
in using annotated data in the classification of unreli-
able content. First, the identification of what is unre-
liable or not is a difficult task for annotators without
expertise (due to their personal beliefs and psycho-
logical phenomenons like confirmation bias). Con-
sequently, the use of Crowdsourcing platforms be-
comes infeasible or subject to outputting untrustwor-
thy data. Second, the diversified quantity of topics
and the time dynamics of unreliable content would
require that new annotated data was introduced after
some time to maintain the models updated. Our sec-
ond goal is to be able to output a quick response on
the computation of the reliability score of an account.
Due to the importance of early detection on the clas-
sification of accounts (p.e. to avoid the diffusion of
unreliable content through the network), the neces-
sity of gathering a large amount of historical data on
each account or to perform computationally expen-
sive processes, may hinder the provision of a relia-
Knowledge-based Reliability Metrics for Social Media Accounts
341

bility score at a reasonable time. A concrete exam-
ple can be the use of a framework with a front-end
web-browser add-on where, upon clicking in a certain
post, users have the account metrics displayed. Thus,
to ensure that the information is provided on time, it
is important to guarantee that the framework can out-
put a score almost instantaneously in such a way that
it is possible to integrate it with a front-end environ-
ment without requiring the user to wait a long period
of time for the results. These two goals lay the foun-
dations for the data retrieval method and the metrics
explained and justified in the following sub-sections.
3.1 Data Retrieval
To establish a methodology to capture accounts that
are spreading unreliable and reliable content, we
must first define some concepts. Therefore, in this
work, we rely on several definitions provided by
OpenSources to determine what is unreliable content.
OpenSources is a database for online information
sources. Although the website (http://opensources.
co) was shut down, the database is still used by the
scientific community as ground truth for several stud-
ies (Bovet and Makse, 2019; Guimaraes et al., 2020).
The database is currently available through the Github
repository
1
. We consider that a post/tweet propagates
unreliable content if it contains a hyperlink to a web-
site whose content falls into one or several of the fol-
lowing definitions, provided by OpenSources:
• fake: the news content provided is fabricated in-
formation or distorts actual news with the goal of
deceiving users
• clickbait: the news content provided has an eye-
catching title or headline with the sole intention to
deceive users in social media to click the associ-
ated URL
• bias: the news content provided is extremely bi-
ased and aggressively favors the opinion of one
side and/or demeans and insults the other.
• junksci: the news content provided is related to
scientific theories which are false or whose verac-
ity is unclear (also known as junk science)
• hate: the news content provided promotes racism,
homophobia, or other forms of discrimination.
• unreliable
2
: the news content provided is unclear
and lacks more investigation to determine its ve-
racity.
1
https://github.com/BigMcLargeHuge/opensources
2
In this work we use the term unreliable to classify the
content provided by all categories. This is the only excep-
tion since, for the sake of coherency, we opt to keep the
OpenSources categories names unchanged.
Each source is investigated by researchers and profes-
sionals and annotated according to the overall content
that provides. Each source can be annotated to a max-
imum of 3 (out of 12) categories in a ranked manner
(i.e. from the most predominant type of content to
the least). However, in this work, from all the 12 dif-
ferent categories, we only select 5 since: 1) we are
interested in using OpenSources only for unreliable
content thus we exclude categories like ”political” and
”reliable” and 2) other categories are less representa-
tive of the problem (like ”gossip”). In addition, we
simplify our classification by only using the predom-
inant tag in each website.
On the other hand, it is also important to define
what are reliable accounts. The concept is similar.
However, due to the limitations on the OpenSources
platform in reliable content (fewer sources and very
restrained to the political domain), we opt by using
Media Bias Fact Check (MBFC) database
3
.
MBFC has two different types of classification for
each source. The first is according to the type of con-
tent that each source publishes. The labels include 6
different bias values ranging from the extreme right
to the extreme left. In addition, sources that fall out
of this spectrum, are included in labels such as ”Pro-
Science”, ”Conspiracy/Pseudo-Science” or ”Satire”.
The second type of classification regards the fac-
tuality of each source. The classification has 6 labels
ranging from ”Highly Factual” (when the source only
presents factual content) to ”Very Low” (when the
source never uses credible sources and is not trust-
worthy).
To determine what is reliable, we used the sources
classified with the following labels:
• Pro-Science - Sources that consist of legitimate
scientific content and are based in credible scien-
tific methods and source.
• Left-Center Bias - Sources with minor democratic
bias that are generally trustworthy for informa-
tion.
• Least Biased - The most credible media sources
with minimal bias and highly factual reporting.
• Right-Center Bias - Same as left-center bias but
towards conservative causes.
The vast majority of the sources included in this labels
has a factuality score ranging from ”Mostly Factual”
to ”Highly Factual”. Although we could restrain our
sources solely to the ones with ”Highly Factual” label,
this would lead to a high difference between the num-
ber of unreliable and reliable sources. Therefore, we
3
http://mediabiasfactcheck.com
WEBIST 2020 - 16th International Conference on Web Information Systems and Technologies
342

slightly relax our criteria to ensure a more balanced
number of sources between classes.
We used the website’s URL of the selected cat-
egories as a keyword for the Search API on Twit-
ter. For each query (i.e. URL), a collection of 100
tweets was extracted on a daily basis. For each tweet,
the account information (such as screenname, num-
ber of followers, verification status) is also extracted.
If repeated tweets are captured, only the fields that
suffered any change are updated (e.g. the number
of posts retweets/favorites and the number of follow-
ers/followees of the account).
The retrieved tweets can be used to classify ac-
counts regarding the content that they spread. Since
each website from OpenSources and MBFC was used
as a keyword, each returning tweet has a URL for that
page or for an article (i.e. subdomain) of that website.
This differs from similar methodologies that use only
the Twitter account of the sources (Helmstetter and
Paulheim, 2018) or directly extract articles from the
websites (Baly et al., 2018). Finally, we map the clas-
sification of the site to the tweet, thus automatically
annotating the totality of tweets captured. Several
studies have used this distant labelling approach with
success (Horne et al., 2019; Guimaraes et al., 2020;
Helmstetter and Paulheim, 2018). Therefore, this an-
notation will be the basis for the reliability metrics
explained in the next section.
3.2 Reliability Metrics
Through the analysis conducted in the previous sec-
tion, we develop metrics to analyze Twitter accounts
based on the number of unreliable and reliable posts
(and their social feedback).
From the information extracted in the data re-
trieval process, the following variables will be used
to compute the metrics.
• account creation date
• account number of followers
• account verification status
• post publish date
• post retweet count
• post favorite count
The first metric (which serves as a baseline) is based
on the assumption that the behavior of an account re-
garding the content that publishes is time-independent
and therefore the impact that an account has on the
network is solely based on the number of tweets that
it spreads (independently of the age of the account).
Thus for an account a and reliability class (reliable,
unreliable) c pcount
a
can be defined as:
PCOUNT
a,c
= n
a,c
(1)
where n is the number of posts from account a in
the class c. This first metric can be summarized to a
post count but it provides the basis for classification
of accounts. It is important to highlight that the main
differences between this work and similar social net-
work metrics in the literature is the knowledge-based
component that was extracted and stored using the
methodology in the previous section. This allows a
quick categorization of the accounts and stores the in-
formation necessary for the computation of these met-
rics.
We use the following notation to simplify the for-
mulation of the next metrics. Each post i published by
account a and annotated with a classification c, can be
defined by a tuple (t
i,a,c
, f
i,a,c
, r
i,a,c
) where i ∈ [0, n
a,c
],
t
i,a,c
is the age of the post (in months- derived from
the post’s publication date), f
i,a,c
the number of ac-
counts that ”favorited” that post and r
i,a,c
the number
of retweets.
The second metric is time-aware (i.e. the older
the post, the less impact it has on the reliability of the
account) and regards the behavior (BEH) of the ac-
count, discarding any output variables such as its con-
nections or the social feedback obtained in its posts.
The equation to compute these values for each class c
is:
BEH
a,c
=
∑
n
a,c
i=1
1
t
i,a,c
AGE
a
(2)
Let us further demonstrate the intuition behind
these equations. The use of the multiplicative inverse
on the post’s age allows a linear decrease in the impact
of that post in the assessment of the account behav-
ior metric. Let us consider two different examples.
The first is a bot account that was actively dissemi-
nating information prior to the 2016 U.S. presidential
election (account
1
). The second is a human-operated
account that shares extremely bias content during the
Covid-19 pandemic (account
2
). It is reasonable to as-
sume that the last account should achieve a higher
score due to the post being more recent. In fact, in
a simulated environment where account
1
propagates
50 posts in an interval of time from September to
November of 2016 and an account that posts 10 posts
in the last 2 months (May and June 2020), the results
for the multiplicative inverse is 1.16 and 4.83 respec-
tively. The sum of each post’s age multiplicative in-
verse allow us to quantify each post individually and
considering their respective time differences.
The next step in the metric is to divide the sum
of all posts’ inverse age from account a by the age of
the account (AGE
a
). There are two main reasons to
diminish the effect of older accounts. First, the reg-
istration date plays an important role in most works
Knowledge-based Reliability Metrics for Social Media Accounts
343

in the fake news domain (Boididou et al., 2018; Wu
et al., 2015) with some works highlighting the impor-
tance of this feature (Xiao et al., 2015; Castillo et al.,
2011). Secondly, due to the ongoing efforts of Twitter
to remove bot accounts and accounts spreading mis-
information (Conger, 2020; Margolin and Thorbecke,
2020), it is plausible that accounts with a long history
and constant propagation would be captured by the
social network’s internal algorithms. Once again, let
us consider to example accounts: account
3
was cre-
ated in 2016 while account
4
was registered last month
(June 2020). Account 3 is a human-operated account
that published unreliable information 10 to 20 times
in its lifespan but has recently deviated from such
content. On the other hand, account
4
has published
5 tweets containing unreliable content. Due to the re-
cent creation date of account
4
, the penalization given
by the behavior metric would be higher than account
3
.
It is reasonable to assume that a recently created ac-
count that propagates unreliable content in its first
months could potentially be a bot or even an unreli-
able account that will continue to display the same be-
havior and therefore the unreliable metrics proposed
should assign a higher value to it.
Finally, the impact (IMP) metric combines the be-
havior with the influence of an account on Twitter. As
it was previously mentioned in Section 2, influence
metrics on Twitter have been thoroughly proposed in
social network studies. However, recalling the sec-
ond goal for the development of the framework, it is
important that the metrics would give a quick output
and avoid heavy computation. Therefore, influence
metrics that require knowledge on the close network
(such as the closeness, betweenness, h-index (Razis
and Anagnostopoulos, 2014) or PageRank (Wang and
Japkowicz, 2010)) are not feasible for this purpose.
Therefore, our influence metric relies solely on data
that can be derived from the account information pro-
vided by the API. A metric more suitable for our goals
is the information diffusion metric (Pal and Counts,
2011). This metric is used for estimating the influ-
ence of an account in a topic by measuring the differ-
ence between the number of friends of an account that
tweets on a topic before and the number of follow-
ers of the account that tweets on the same topic after.
The metric also uses a logarithmic scale due to the
possible differences between the number of follow-
ers (NFOLLOWS) and friends (NFRIENDS). How-
ever, this metric still relies on information from the
connections to be computed and thus is subject to the
limitations of the Twitter API. Metrics based only on
the number of followers and friends (and thus pos-
sible to compute almost instantaneously) were also
proposed. For example the Followers Rank (Nag-
moti et al., 2010) (presented in equation 3) and Twit-
ter Follower-Followee Ratio (Bigonha et al., 2012).
The first measure is the adaptation of the in-degree
metric and the second is self-explanatory.
FollowersRank =
NFOLLOW
NFOLLOW + NFRIENDS
(3)
Nevertheless, these metrics have limitations.
The first is the disproportion that NFOLLOW and
NFRIENDS may have. For example, at the time
of the writing of this paper, the official Twitter ac-
count of the president of the United States (@real-
DonaldTrump) has 82.9 million followers but only 42
friends which can highly affect the value of this met-
ric when compared with more balanced accounts.
Furthermore, we argue that in the specific domain
of unreliable content, the verification status of an ac-
count can play an important role in the influence of
that account, and thus it should be considered. The
main reason is that Twitter assigns a verification sta-
tus to accounts that are of public interest and authentic
Twitter (2018b). Therefore, if a verified account pub-
lishes unreliable posts could more easily lead users to
believe that the content is reliable due to the authen-
ticity of the account.
Due to the aforementioned reasons, we present the
(INFLUENCE
a
) metric, which can be measured us-
ing the following equation
INFLUENCE
a
= log(NFOLLOW
a
+ 1) × α
V ER
a
(4)
where V ER
a
refers to the account verified status (0 if
it is not verified and 1 otherwise) and α refers to a
user-defined variable that assigns the weight applied
to the influence of an account when it is verified. We
also restrain NFOLLOW to a logarithmic scale due
to the large difference in the number of followers in
Twitter accounts.
Another clear distinction between our influence
metric and others presented in the literature is the ex-
clusion of the number of friends (or followees) from
the metric. The reason behind this is the specific do-
main where we wish to apply these metrics.
When measuring the influence in terms of the
overall popularity of an account, a ratio between the
number of followers and followees is essential since
high influence accounts (belonging for example to
musicians and actors) have a high disparity on these
variables due to the fans that follow this particular ac-
counts. However, when assessing the impact of an
account in spreading unreliable content, it is reason-
able to assume that the influence it has on its fol-
lowers should not be reduced by a high number of
friends/followees. For instance, if we consider two
WEBIST 2020 - 16th International Conference on Web Information Systems and Technologies
344

accounts with the same behavior value but the first ac-
count follows many more other accounts than the sec-
ond, it is plausible that both accounts have the same
reach in their close network since each account feed is
based on its followers. Nevertheless, since that high
disparity of followers and followees is normally as-
sociated with accounts of public interest, the verifi-
cation status component in our metric can deal with
those particular cases.
Finally, combining influence and behavior, we
characterize the impact of an account on the social
network using the following equation:
IMP
a,c
= BEH
a,c
× INFLUENCE
a
(5)
We can further complement the metrics based on
the information from social feedback such as retweets
and favorites. Thus, we propose a variation of the be-
havior (Equation 6) and impact metric (7) that con-
sider the social feedback of tweets at the time of the
retrieval.
BEH SF
a,c
=
∑
n
a,c
i=1
1+log(1+ f
i,a,c
)+log(1+r
i,a,c
)
t
i,a,c
AGE
a
(6)
IMP SF
a,c
= BEH SF
a,c
× INFLUENCE
a
(7)
By adding the number of retweets and number of
favorites in each post to the behavior function we aim
at a better characterization of the impact on the net-
work. We use the number of retweets and number of
favorites in individual logarithmic functions to high-
light the difference between posts with a large number
of only one type of social feedback from the ones that
have a large number of both favorites and retweets.
The value is smoothed by the age of the post and the
age of the account due to the reasons mentioned ear-
lier.
However, there is also a limitation on the applica-
tion of social feedback. Since we are trying to build a
knowledge-based metric that relies on information al-
ready presented in our database and we want to avoid
calls to APIs or computationally expensive processes
at classification time, we rely solely on the social
feedback at the time of the extraction. In other words,
as time passes, the number of retweets and favorites
of each tweet can increase.
It is important to mention that some measures
have been taken to minimize the dynamic effect of
some of these variables. First, we update the values
each time a duplicated tweet is found and since we are
using the Twitter Search API, in the best case scenario
we can update a tweet upon 7 days of its publication.
Second, when looking for tweets, we specify that the
search should be constituted from a mix of popular
and recent tweets by using the mixed parameter from
the Twitter API (Twitter, 2018a). This trade-off al-
lows the capture of recent tweets that eventually may
not be engaging (and thus not posing an impact on the
network but still relevant for a broad characterization
of Twitter accounts) as well as tweets that have al-
ready gained some traction on Twitter (and therefore
are considered popular for the API).
Nevertheless, these measures are not enough to
ensure that all accounts have their reliability metrics
computed based on the most recent data. Due to the
main goals of the framework, updating mechanisms
are out of the scope of this work. Some hypotheses
on updating each accounts’ metrics based on the most
recent data are suggested in Section 5.
In the next section, we apply these metrics to the
accounts captured. In addition, we compare the re-
sults obtained with a state of the art bot detection sys-
tem and provide some reasoning on the usefulness of
these metrics.
4 CASE STUDIES
In this section, we present two case studies to evalu-
ate the usefulness of our metrics. First, we analyze the
top reliable and unreliable accounts captured (subsec-
tion 4.1). Second, we study how the metrics compare
with a state of the art bot detection method (subsec-
tion 4.2). The data used was extracted between July,
2019 and July 2020. It includes over 4M tweets with
more than 750k distinct accounts.
In previous work (Guimar
˜
aes et al., 2018;
Guimaraes et al., 2020) when analyzing a sample of
unreliable accounts, we found that only a small per-
centage (≈ 1%) were verified. In addition, verified ac-
counts often have a large number of followers. There-
fore, in these case studies, the value of alpha was set
to 2 to avoid that verified accounts were treated as out-
liers in our IMP
SF
metric but on the other hand, can
be distinguished from non-verified accounts. Defin-
ing α = 2 means that if an account is verified, its in-
fluence value doubles.
4.1 Top Unreliable and Reliable
Accounts
We select the 5000 accounts with the highest
PCOU NT value for both classes (reliable and unreli-
able). We opt for this metric since it allow us to eval-
uate the difference on the more complete metrics pro-
posed (BEH and IMP) and how they differ between
them and PCOUNT . If one of the other metrics was
selected, other characteristics (like number of follow-
ers or age of the account) could be less propitious to
Knowledge-based Reliability Metrics for Social Media Accounts
345

change and thus making the accounts extracted more
similar to each other.
4.1.1 Unreliable Accounts
When looking at the unreliable accounts, there were
44 accounts verified in our sample. The majority of
these were Twitter accounts of the websites anno-
tated in OpenSources or entities associated with those
websites (such as reporters or commentators). The
non-verified accounts that present the highest IMP
SF
and BEH
SF
are bots that publish and disseminate ex-
tremely biased content. We select the top 5 for a more
in depth analysis. However, one of the these accounts
had been already suspended at the time of this anal-
ysis. Screenshots from the remaining 4 are presented
in Figure 1.
The similarity of the accounts presented in Fig-
ure 1 as well as the absence of a personal profile pic-
ture/banner and lack of original publications, shows
clear signals of bot accounts. Three out of the four
accounts present a high number of followers (between
13000 and 25.8K). In addition, they have a recent reg-
istration date with the oldest account being registered
less than two years earlier to the writing of this article,
and the other three being registered approximately a
year ago. These factors combined with the number of
posts captured justify the score they achieved. Fur-
thermore, we argue that the score assigned to these
accounts is fair in the sense that these accounts dis-
play bot behavior and present a threat to the upcom-
ing 2020 United States elections due to the impact of
their content in the social network. The last account
showed in Figure 1 presents a lower number of fol-
lowers by comparison. However, its IMP
SF
score is
severely affected by the high number of posts cap-
tured and it is the account with the highest BEH
SF
value in this sample. Hence, although its number of
connections is low, it was recently created and sys-
tematically propagates unreliable content, making it
also a potential problem in the network. When com-
pared with the other accounts analyzed, this account
has 2076 posts captured in our database while in the
remaining one the number of posts is situated between
407 and 737.
We proceed to manually analyze some random ex-
amples of accounts that score a IMP
SF
value between
2000 and 4000 and BEH
SF
between 250 and 500. In
the 20 accounts manually analyzed, there was a mix
of bot and human-operated accounts. Although there
is still a large presence of bots, it is clear that some ac-
counts present human behavior. In some cases, these
accounts feeds have a large percentage of retweets
with a small percentage of original posts. On others,
they present a large volume of original publications
and a small set of publications linking to unreliable
websites.
Finally, we manually analyzed some of the ac-
counts with low unreliable scores in our metrics. We
selected accounts with a BEH
SF
score between 10 and
150 and IMP
SF
between 40 and 100. Once again there
is a mixture of human-operated and bot accounts but
with less influence and older registration date than
the previous tier. A curious example is an account
that at the time of extraction had a BEH
SF
value of
121.93 and an IMP
SF
of 0 (since it had no followers).
This case perfectly illustrates that even when some ac-
counts have a high propagation of unreliable content,
their impact on the network might be limited.
Summarising, by manually sampling some of the
accounts captured we can provide some confidence on
the effectiveness of the metrics to annotate high im-
pact accounts that frequently spread unreliable con-
tent (such as bots), as well as human-operated ac-
counts (whose propagation frequency is lower). In
addition, we can argue that the metrics clearly dis-
tinguish the ones that can have a high impact on the
social network from the ones that do not.
4.1.2 Reliable Accounts
We shift our analysis towards the reliable accounts
and proceed to inspect some of the accounts that
achieve high IMP
SF
values in this class. First, the
number of verified accounts is higher than in the un-
reliable domain with 221 of the accounts achieving
this status. Once again, a large number of these ver-
ified accounts are the official Twitter accounts of the
websites presented in MBFC. Second, the values ob-
tained in IMP
SF
and BEH
SF
metrics are lower than
in unreliable accounts. We hypothesize that due to
the highest number of human-operated accounts, the
feed of these accounts is more diversified with con-
versational threads and fewer publications with links
to reliable websites.
We proceed to analyze some of the accounts
manually. One of the first observations that illus-
trates the necessity of these metrics to complement
the current bot detection systems is that the ac-
count with the highest behavior score is a bot ac-
count that retweets news from several reliable sources
(@world news eng). This account is recent (created
in January 2020) and thus does not present a high
number of followers (consequently not having a high
IMP
SF
value). It is also important to mention that
similar to unreliable accounts, there are some ac-
counts that were removed at the time of this analy-
sis. Furthermore, some accounts manually analyzed
present moderated bias opinions. However, their in-
formation and opinions are based on information from
WEBIST 2020 - 16th International Conference on Web Information Systems and Technologies
346
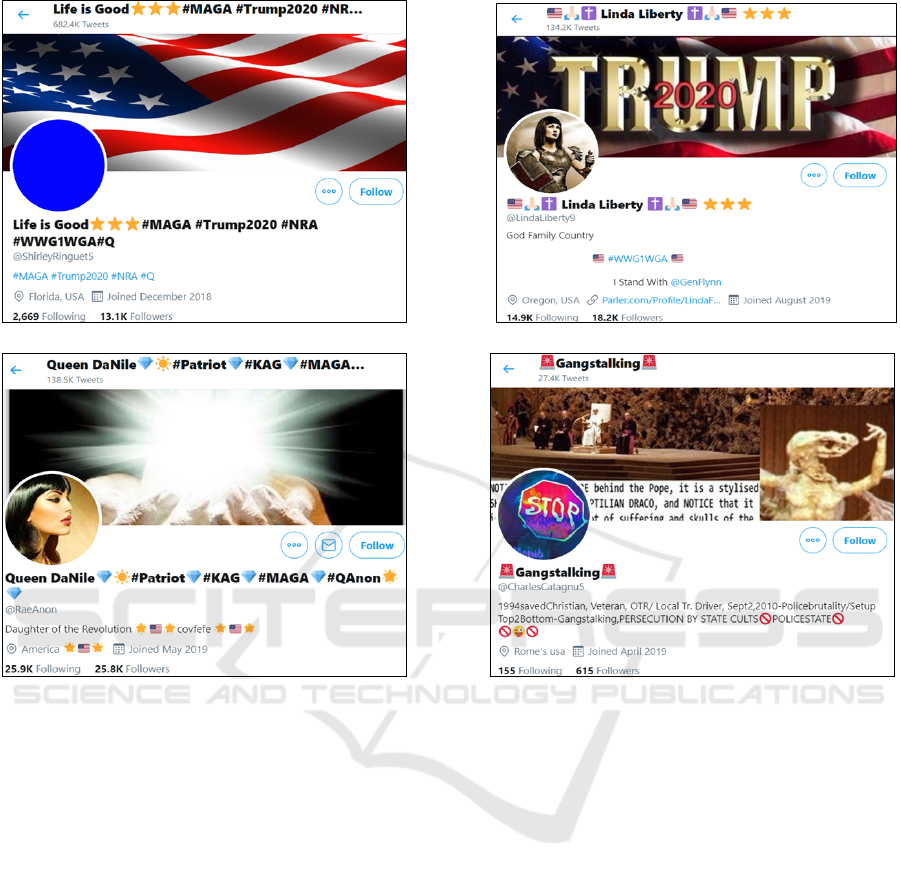
Figure 1: Characteristics of the accounts with the highest IMP
SF
. The similarities of the accounts is visible and present all
the indicators of bot accounts.
reliable websites/sources and thus they are included in
these category.
Nevertheless, comparing the metrics in both
classes, it is clear that the impact that the accounts
spreading unreliable information on Twitter surpasses
the ones the impact of accounts spreading reliable
content.
4.2 Botometer Vs Reputation Metrics
To understand how the metrics developed compare
to the traditional bot detection systems presented in
the state of the art, we analyzed and evaluate the ac-
counts extracted using Botometer. This tool, previ-
ously known as BotOrNot, is one of the state of the
art systems for bot detection (Varol et al., 2017a). Al-
though the metrics presented in this paper aim to de-
tect unreliable accounts (bots and human-operated),
we compare the scores assigned by Botometer with
the ones computed by our metrics to 1) understand the
similarities/differences between both scores 2) evalu-
ate the necessity (or not) of our metrics.
For this experiment, we used Botometer ”univer-
sal” score to identify if an account is a bot. This
score was used since it relies solely on language-
independent features and some of the accounts cap-
tured do not write in English. The reliability metric
used was the IMP score metric. We opt by this par-
ticular metric for a fair comparison since Botometer
scores are more account and content-focus and do not
use social feedback features (Varol et al., 2017a). In
addition, we also normalize the reliability score since
Botometer provides scores between 0 and 1.
We compute the universal bot score in a large sam-
ple of unreliable accounts (n ≈ 50000). The percent-
age of bots identified is approximately 11% of this
sample since that, according to the authors, accounts
are only considered bot if they achieve a score supe-
rior to 0.5. Figure 2 presents the contrast between the
universal score obtained by each account and the IMP
metric.
We also evaluate if there is a significant correla-
Knowledge-based Reliability Metrics for Social Media Accounts
347
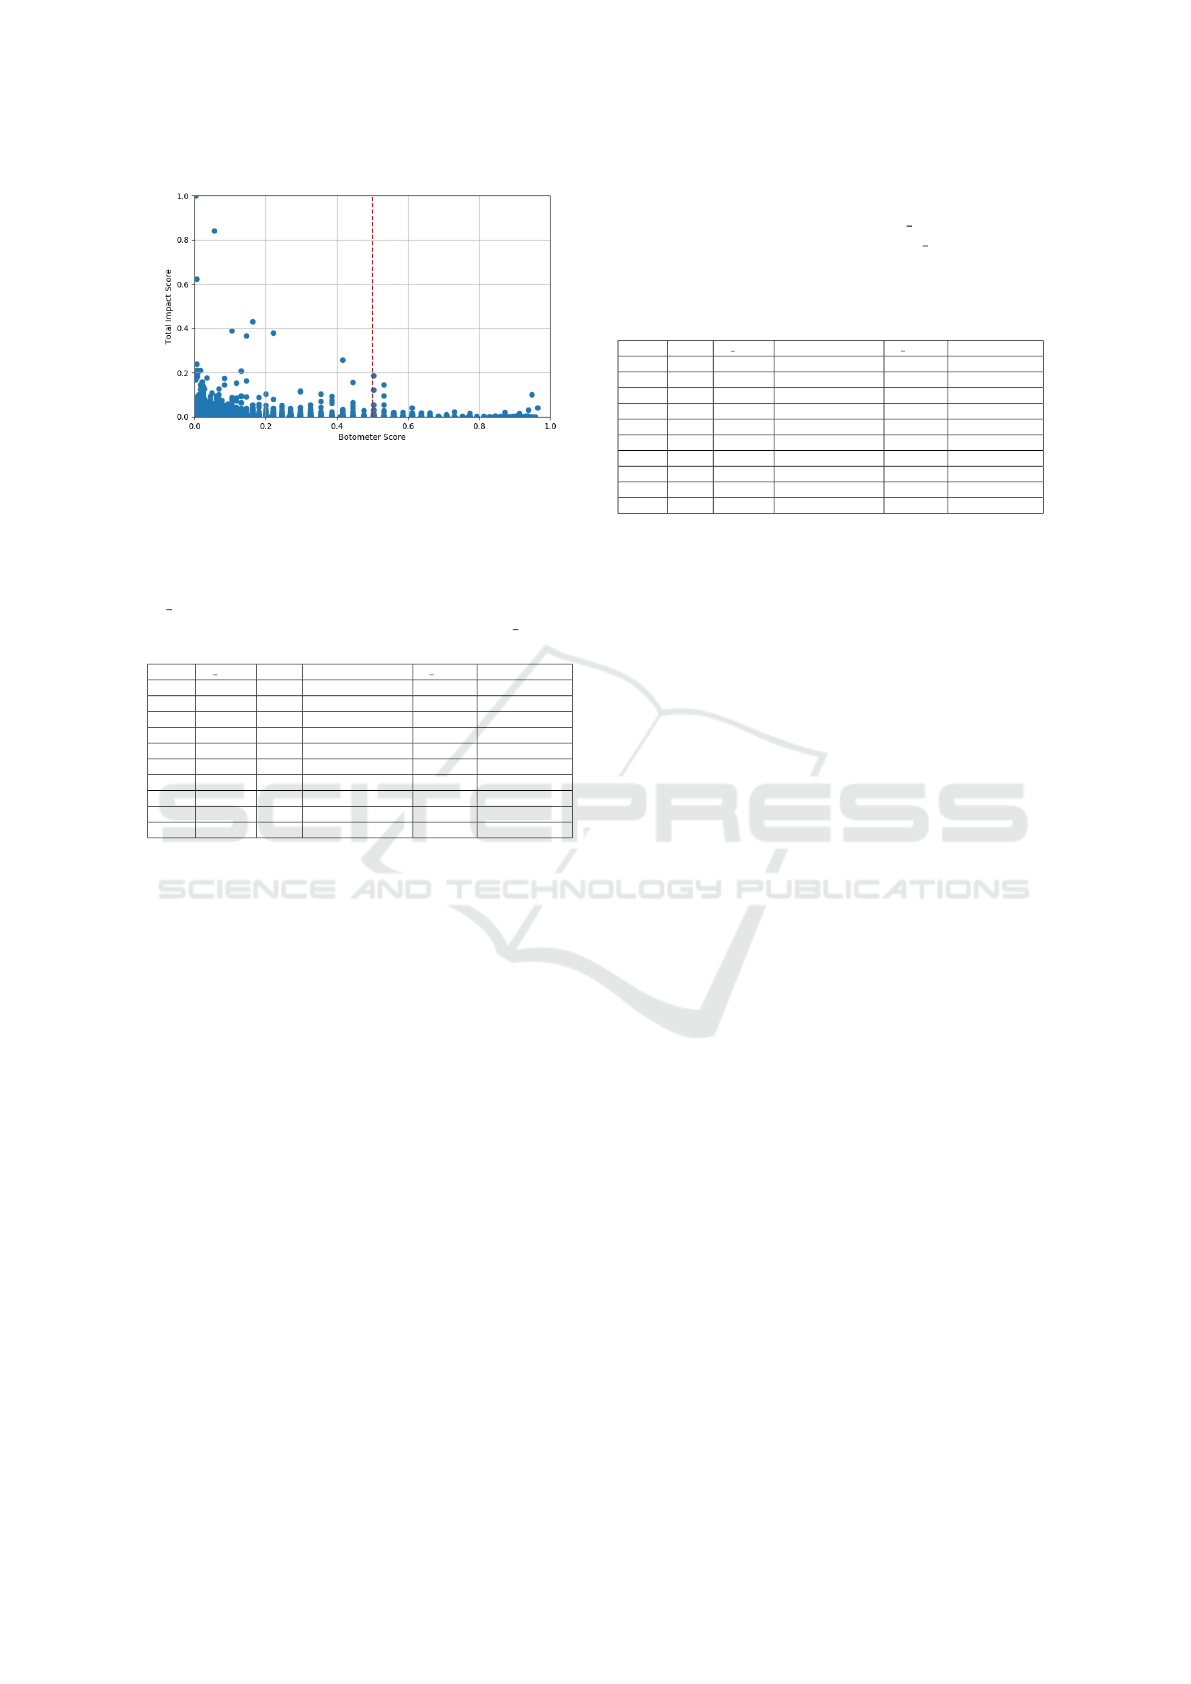
Figure 2: Comparison between IMP and Botometer score
for the accounts retrieved. The red trace indicates the sepa-
ration between human-operated and bot accounts according
to Botometer. Above that value (Botometer score > 0.5),
accounts are considered to be bots.
Table 1: Accounts with the highest Botometer score
(B Score) and their respective reputation score (IMP), num-
ber of followers (NFOLLOWERS) and posts (P Count),
and date of creation.
ID B Score IMP NFOLLOWERS P Count Creation Date
Bot1 0.965 0.041 305 6.0k Mar 2017
Bot2 0.958 0.001 175 259 Jan 2019
Bot3 0.952 0.006 3114 11.7k May 2012
Bot4 0.952 ≈ 0 4180 1971 Dec 2016
Bot5 0.948 0.001 253 5.7k Jun 2017
Bot6 0.948 0.1 27 3 Aug 2014
Bot7 0.944 ≈ 0 1275 6 Feb 2019
Bot8 0.944 0.001 44 70 Mar 2014
Bot9 0.942 ≈ 0 1 3 Feb 2019
Bot10 0.942 ≈ 0 12 1 Dec 2013
tion between the scores from Botometer and the relia-
bility scores. The hypothesis is that bots have a higher
impact on the network (and thus achieve a higher
score on our metrics) than human-operated accounts.
Since the distribution is not normal, we evaluate
the correlation between the IMP total score and the
Botometer universal score using Spearman correla-
tion. The value obtained was 0.191 (p-value<0.0001)
which indicates a lack of correlation between bot and
reliability scores.
We further investigate some of the accounts sam-
pled to understand the relation between bots and un-
reliable accounts. Thus, we manually analyzed the
accounts with the highest botometer score and the
normalized reliability metric. Table 1 provides some
characteristics on the 10 highest Botometer score ac-
counts while Table 2 refers to the top 10 accounts ac-
cording to our metric.
There are several observations that are important
to highlight from Table 1 and 2. First, the bottom half
of the top accounts with the highest bot score have a
below-average number of posts (≤70) and a low num-
ber of followers (with the exception of Bot7). Fur-
thermore, some accounts are classified as bots with
high confidence but whose number of posts and fol-
lowers is below 10. This means that even if these
Table 2: Accounts with the highest reputation score (IMP)
and their respective Botometer score (B Score), number of
followers (NFOLLOWERS) and posts (P Count), and ac-
count’s creation date. The account in bold was suspended
in the analysis process. Thus, the information provided was
extracted prior to the analysis and therefore may be out-
dated.
ID IMP B Score NFOLLOWERS P Count Creation Date
Unr 1 0.003 5044 46.8k Oct 2014
Unr2 0.842 0.054 9751 358.9k Dec 2018
Unr3 0.622 0.006 863 20.3k May 2019
Unr4 0.432 0.162 1047 17.9k Mar 2018
Unr5 0.390 0.104 3706 83.4k May 2017
Unr6 0.378 0.221 12120 134.8k Jul 2016
Unr7 0.365 0.146 6615 20.7k Nov 2018
Unr8 0.258 0.416 22.6k 86.2k Jan 2019
Unr9 0.234 0.006 3967 321.8k Jun 2013
Unr10 0.210 0.016 843 13.1k Jun 2018
accounts are labeled as bots, their current impact on
the Twitter ecosystem as spreaders of unreliable con-
tent is small. Shifting our analysis towards Table 2
we can see that none of the unreliable accounts with
the highest scores were classified as bots (bot score >
0.5) by the Botometer metric. This fact highlights the
importance of these metrics since accounts which are
often discarded as bots can still pose a threat to the
Twitter ecosystem. By manually inspecting the ac-
counts, we can conclude that Unr10 and Unr9 publish
false information and present human-operated behav-
ior since they contain original tweets, original profile
images (not found on other websites by using reverse
image search) and personal information. Un2, Unr4,
Unr6 and Unr7 also present human behavior although
they do not have an original profile picture. Unr5 is
a non-English account whose unreliable tweets cap-
tured are English retweets. Finally, accounts Unr1
and Unr3 are the exceptions since they are social me-
dia accounts for two of the websites included in Open-
Sources (thus reaching a high unreliable score). Two
main conclusions can be derived from this analysis.
The first is that state of the art bot detection systems
are insufficient to detect unreliable accounts since the
goal of these systems is to detect accounts that are op-
erated automatically. Also, some of the top accounts
labeled as bots do not have a significant impact on
the network due to their low number of connections
and publications. On the other hand, Table 2 high-
lights the importance of the development of frame-
works and metrics to detect unreliable accounts since
these are often undetected by bot/spam detection sys-
tems. Also, human-operated unreliable accounts rep-
resent a large portion of the unreliable accounts an-
alyzed (≈ 89%), which reinforces that bot detection
systems are not enough to prevent the detection of un-
reliable accounts.
WEBIST 2020 - 16th International Conference on Web Information Systems and Technologies
348

5 CONCLUSION
In this work, we proposed a framework to extract and
classify the reliability of an account. We develop met-
rics that can measure the impact that an account has
in a social network environment. By analysing some
of the accounts with the larger values and comparing
the metrics with a bot detection system we can con-
clude that 1) the framework and metrics are able to
capture and classify unreliable accounts that can pose
a threat to the Twitter ecosystem and 2) the metrics
proposed are useful because they can capture unreli-
able accounts that bot detection systems like (botome-
ter) failed to capture.
However, as it was previously mentioned, there
are some limitations with the methodology presented
in this work. First, the limitations in the Twitter API
force us to restrain the number of tweets extracted per
day. This can have an impact on the number of un-
reliable posts captured and thus may affect the score
for each account. An ideal scenario would be the cap-
ture of all daily tweets that refer a link to a unreliable
website. However, this would require the access to a
more restrictive API and could potentially escalate the
resources and computation costs. The second limita-
tion (that is also related to the limitations of the Twit-
ter API) is the lack of an update mechanism for each
account score. Due to the dynamics of some posts’
features (such as number of favourites and retweets),
at the time of the capture, the posts may still have low
number of favorites/retweets thus not representing the
real impact that they can have on the network. Up-
dates on these posts may require some time due to the
limited calls to the Twitter API. In future work, we in-
tend to tackle that problem by implementing updating
(i.e. when should an account’s score be updated) and
forgetting (i.e. when should an account be removed
from the database) mechanisms that respect the goals
proposed in this work. Finally, we will also aim to
tackle with more precision the time require to possi-
bly extract additional information to complement the
metrics and how they affect the overall performance
of the system.
ACKNOWLEDGEMENTS
This work is partially financed by National Funds
through the Portuguese funding agency, FCT -
Fundac¸
˜
ao para a Ci
ˆ
encia e a Tecnologia, within
project UIDB/50014/2020.” Nuno Guimaraes thanks
the Fundac¸
˜
ao para a Ci
ˆ
encia e Tecnologia (FCT), Por-
tugal for the Ph.D. Grant (SFRH/BD/129708/2017).
REFERENCES
Al-Khalifa, H. S. and Al-Eidan, R. M. (2011). An exper-
imental system for measuring the credibility of news
content in Twitter. International Journal of Web Infor-
mation Systems, 7(2):130–151.
Baly, R., Karadzhov, G., Alexandrov, D., Glass, J., and
Nakov, P. (2018). Predicting factuality of report-
ing and bias of news media sources. Proceedings of
the 2018 Conference on Empirical Methods in Natu-
ral Language Processing, EMNLP 2018, pages 3528–
3539.
Benevenuto, F., Magno, G., Rodrigues, T., and Almeida, V.
(2010). Detecting spammers on twitter. In In Collab-
oration, Electronic messaging, Anti-Abuse and Spam
Conference (CEAS.
Bigonha, C., Cardoso, T. N., Moro, M. M., Gonc¸alves,
M. A., and Almeida, V. A. (2012). Sentiment-based
influence detection on Twitter. Journal of the Brazil-
ian Computer Society, 18(3):169–183.
Boididou, C., Papadopoulos, S., Zampoglou, M., Apos-
tolidis, L., Papadopoulou, O., and Kompatsiaris, Y.
(2018). Detection and visualization of misleading
content on Twitter. International Journal of Multime-
dia Information Retrieval, 7(1):71–86.
Bovet, A. and Makse, H. A. (2019). Influence of fake news
in Twitter during the 2016 US presidential election.
Nature Communications, 10(1):1–14.
Castillo, C., Mendoza, M., and Poblete, B. (2011). Infor-
mation Credibility on Twitter. In Proceedings of the
20th international conference on World wide web.
Chu, Z., Gianvecchio, S., Wang, H., and Jajodia, S. (2012).
Detecting automation of Twitter accounts: Are you a
human, bot, or cyborg? IEEE Transactions on De-
pendable and Secure Computing, 9(6):811–824.
Conger, K. (2020). Twitter removes chinese disinformation
campaign. https://www.nytimes.com/2020/06/11/
technology/twitter-chinese-misinformation.html.
Acessed: 2020-07-07.
Davis, C. A., Varol, O., Ferrara, E., Flammini, A., and
Menczer, F. (2016). BotOrNot: A System to Evalu-
ate Social Bots. pages 4–5.
D
´
ıaz-Faes, A. A., Bowman, T. D., and Costas, R. (2019).
Towards a second generation of ‘social media met-
rics’: Characterizing Twitter communities of attention
around science. PLoS ONE, 14(5):1–18.
Facebook (2020). How our fact-checking program
works. https://www.facebook.com/journalismproject/
programs/third-party-fact-checking/how-it-works.
Acessed: 2020-07-21.
Finn, S., Metaxas, P. T., and Mustafaraj, E. (2015). Spread
and skepticism: Metrics of propagation on twitter.
Proceedings of the 2015 ACM Web Science Confer-
ence, pages 2–3.
Fung, B. (2020). Twitter labeled trump tweets with a fact
check for the first time. https://edition.cnn.com/2020/
05/26/tech/twitter-trump-fact-check/index.html.
Acessed: 2020-07-21.
Gilani, Z., Kochmar, E., and Crowcroft, J. (2017). Classi-
fication of twitter accounts into automated agents and
Knowledge-based Reliability Metrics for Social Media Accounts
349

human users. In Proceedings of the 2017 IEEE/ACM
International Conference on Advances in Social Net-
works Analysis and Mining 2017, ASONAM ’17,
pages 489–496, New York, NY, USA. ACM.
Guimaraes, N., Figueira, A., and Torgo, L. (2020). Analy-
sis and Detection of Unreliable Users in Twitter: Two
Case Studies. Number June in Knowledge Discov-
ery, Knowledge Engineering and Knowledge Manage-
ment. Springer International Publishing.
Guimar
˜
aes, N.,
´
Alvaro Figueira, and Torgo, L. (2018). Con-
tributions to the detection of unreliable twitter ac-
counts through analysis of content and behaviour. In
Proceedings of the 10th International Joint Confer-
ence on Knowledge Discovery, Knowledge Engineer-
ing and Knowledge Management - Volume 1: KDIR,,
pages 92–101. INSTICC, SciTePress.
Hajian, B. and White, T. (2011). Modelling influence in a
social network: Metrics and evaluation. In 2011 IEEE
Third International Conference on Privacy, Security,
Risk and Trust and 2011 IEEE Third International
Conference on Social Computing, pages 497–500.
Helmstetter, S. and Paulheim, H. (2018). Weakly super-
vised learning for fake news detection on Twitter. Pro-
ceedings of the 2018 IEEE/ACM International Con-
ference on Advances in Social Networks Analysis and
Mining, ASONAM 2018, pages 274–277.
Horne, B. D., NØrregaard, J., and Adali, S. (2019). Ro-
bust fake news detection over time and attack. ACM
Transactions on Intelligent Systems and Technology,
11(1):1–23.
Margolin, J. and Thorbecke, C. (2020). Twitter removes
account of white nationalist group posing as an-
tifa online. https://abcnews.go.com/US/twitter-
removes-account-white-nationalist-group-posing-
antifa/story?id=71024345. Acessed: 2020-07-07.
Mu
˜
noz-Exp
´
osito, M., Oviedo-Garc
´
ıa, M.
´
A., and
Castellanos-Verdugo, M. (2017). How to mea-
sure engagement in Twitter: advancing a metric.
Internet Research, 27(5):1122–1148.
Nagmoti, R., Teredesai, A., and De Cock, M. (2010). Rank-
ing approaches for microblog search. Proceedings
- 2010 IEEE/WIC/ACM International Conference on
Web Intelligence, WI 2010, 1(Section III):153–157.
Newman, N. (2011). Mainstream media and the distribution
of news in the age of social media. Technical report.
Nikolov, D., Oliveira, D. F., Flammini, A., and Menczer,
F. (2015). Measuring online social bubbles. PeerJ
Computer Science, 2015(12):1–14.
Pal, A. and Counts, S. (2011). Identifying topical authori-
ties in microblogs. Proceedings of the 4th ACM Inter-
national Conference on Web Search and Data Mining,
WSDM 2011, pages 45–54.
Quattrociocchi, W., Scala, A., and Sunstein, C. R. (2016).
Echo Chambers on Facebook.
Razis, G. and Anagnostopoulos, I. (2014). Influencetracker:
Rating the impact of a twitter account. In Iliadis,
L., Maglogiannis, I., Papadopoulos, H., Sioutas, S.,
and Makris, C., editors, Artificial Intelligence Appli-
cations and Innovations, pages 184–195, Berlin, Hei-
delberg. Springer Berlin Heidelberg.
Riquelme, F. and Gonz
´
alez-Cantergiani, P. (2016). Measur-
ing user influence on Twitter: A survey. Information
Processing and Management, 52(5):949–975.
Twitter (2018a). Twitter - search api. ”https:
//developer.twitter.com/en/docs/tweets/search/api-
reference/get-search-tweets”. [Accessed: 2018-05-
07].
Twitter (2018b). Twitter verified. https://twitter.com/
verified. Acessed: 2018-05-17.
Varol, O., Ferrara, E., Davis, C., Menczer, F., and Flammini,
A. (2017a). Online human-bot interactions: Detec-
tion, estimation, and characterization. In Proceedings
of the International AAAI Conference on Web and So-
cial Media.
Varol, O., Ferrara, E., Davis, C. A., Menczer, F., and Flam-
mini, A. (2017b). Online human-bot interactions: De-
tection, estimation, and characterization. Proceedings
of the 11th International Conference on Web and So-
cial Media, ICWSM 2017, (Icwsm):280–289.
Wang, B. X. and Japkowicz, N. (2010). Boosting support
vector machines for imbalanced data sets. Knowledge
and Information Systems, 25(1):1–20.
Wang, K. C., Lai, C. M., Wang, T., and Wu, S. F. (2015).
Bandwagon effect in facebook discussion groups.
ACM International Conference Proceeding Series, 07-
09-Ocobert-2015:1–6.
Wu, K., Yang, S., and Zhu, K. Q. (2015). False rumors
detection on Sina Weibo by propagation structures.
Proceedings - International Conference on Data En-
gineering, 2015-May:651–662.
Xiao, C., Freeman, D. M., and Hwa, T. (2015). Detecting
Clusters of Fake Accounts in Online Social Networks.
Proceedings of the 8th ACM Workshop on Artificial
Intelligence and Security - AISec ’15, pages 91–101.
Yamaguchi, Y., Takahashi, T., Amagasa, T., and Kitagawa,
H. (2010). TURank: Twitter user ranking based on
user-tweet graph analysis. Lecture Notes in Computer
Science (including subseries Lecture Notes in Artifi-
cial Intelligence and Lecture Notes in Bioinformatics),
6488 LNCS:240–253.
Yuan, J., Li, L., and Huang, M. (2013). Topology-based
algorithm for users’ influence on specific topics in
micro-blog. The Journal of Information and Compu-
tational Science, 10:2247–2259.
WEBIST 2020 - 16th International Conference on Web Information Systems and Technologies
350
