
Influence of the -3826A/G Polymorphism UCP1 (rs1800592) and
Physical Activity on Obesity-related Traits in Russian Females with
Different Level of Physical Activity
Elvira Bondareva
1a
, Olga Parfenteva
1b
and Valentine Son’kin
2,3 c
1
Institute and Museum of Anthropology, Moscow State University, Mokhovaya st, 11/1, Moscow, Russia
2
Moscow Center of Advanced Sports Technologies, Sovietskoi armii st, 6, Moscow, Russia
3
Russian State University of Physical Education, Sports, Youth, and Tourism, Sirenevyi blv, 4, Moscow, Russia
Keywords: Athletes, Abdominal Obesity, UCP1, Gene-Environment Interactions, Physical Activity.
Abstract: The association between level of physical activity and -3826A/G polymorphism UCP1 (rs1800592) with
obesity-related traits was examined in the group of Russian females. A cross-sectional study of 124 adult
females aged of 18-30 years living in Moscow was performed. The genotype of the UCP1 rs1800592 variant
was determined. Height, body mass, waist, hip circumferences and body fat mass were measured. Waist to
hip ratio (WHR), waist to height ratio (WHtR), body mass index (BMI), and body adiposity index (BAI) were
calculated. Association analysis revealed that physical activity and the -3826A/G polymorphism of UCP1
(rs1800592) were significantly associated with obesity-related traits. However, physical activity had a greater
impact on obesity-related traits. Decreased level of physical activity is associated with increased waist to
height ratio, the amount of body fat and body adiposity index. Decreased level of physical activity enhanced
the effect of UCP1 gene polymorphism rs1800592 on obesity-related traits in the studied cohort.
1 INTRODUCTION
Over the last 50 years, the prevalence of obesity
among adults increased dramatically. According to
the last World Health Organization (WHO) report,
the number of overweight and obese individuals 18
years and older raised to 39% and 13%, respectively.
Obesity is defined as a multifactorial disease
which results from a combination of energy
imbalance, low physical activity and genetic
predisposition.
It was shown that the genetic effects may be
modified by various environmental factors
(Kilpeläinen et al., 2011; Rask-Andersen et al., 2017;
Bondareva et al., 2019). Physical activity, diet,
alcohol consumption, smoking, could enhance or
attenuate the influence of genetic factors on obesity-
related traits. For instance, physical activity
attenuated the effect of FTO common variants on
obesity risk (Kilpeläinen et al., 2011; Rask-Andersen
a
https://orcid.org/0000-0003-3321-7575
b
https://orcid.org/0000-0001-7895-6887
c
https://orcid.org/0000-0003-3834-8080
et al., 2017; Bondareva et al., 2019). Several studies
reported that the influence of other obesity-related
loci is diminished by physical activity. In physically
active adults, the minor T allele of the UCP3
rs1800849 (-55C/T) variant is associated with a lower
risk of obesity compared to C allele (Alonso et al.,
2005). Physical activity attenuated the influence of
the risk C allele of the UCP1 rs3811791 on type 2
diabetes risk (Dong et al., 2020).
Gene-lifestyle (gene-environment) interactions
can explain much of the variation in obesity-related
traits. The identification of gene-lifestyle interactions
is a promising method for understanding the etiology
of obesity and development of preventive strategies
(Lin et al., 2013).
In the current study, we investigate the effect of
physical activity level along with the common variant
of the UCP1 rs1800592 (-3826A/G) on obesity-
related traits in the female adults.
156
Bondareva, E., Parfenteva, O. and Son’kin, V.
Influence of the -3826A/G Polymorphism UCP1 (rs1800592) and Physical Activity on Obesity-related Traits in Russian Females with Different Level of Physical Activity.
DOI: 10.5220/0010130901560160
In Proceedings of the 8th International Conference on Sport Sciences Research and Technology Support (icSPORTS 2020), pages 156-160
ISBN: 978-989-758-481-7
Copyright
c
2020 by SCITEPRESS – Science and Technology Publications, Lda. All rights reserved

2 MATERIALS AND METHODS
The study cohort included 124 healthy normal weight
Russian females aged 18-30 years with different level
of physical activity. The dataset included Russian
females who live in Moscow metropolitan area. The
average age of individuals was 18.1±4.2 and 18.4±0.9
years in physically active and inactive individuals,
respectively. The study cohort included individuals
with low physical activity level (N=54) and
professional athletes (N=70) who are engaged in
aerobic sports. The individuals in the first group
performed less than 150 minutes of moderate or
vigorous physical activity per week. Professional
athletes were included in the second group with a high
physical activity level. Physical activity level was
determined by a short questionnaire in which subjects
were asked about the number of minutes of moderate
(moderate physical effort) or vigorous (hard physical
effort) physical activity per week.
The study was approved by the Commission on
Bioethics of the Biological Faculty of Lomonosov
Moscow State University (Ref. 91-o from
24.05.2018). Each participant provided written
informed consent before the examination. The
examination was conducted at the Research Institute
and Museum of Anthropology of Lomonosov
Moscow State University. The anthropometric
examination included measurements of height (cm),
body weight (BW, kg), waist circumference (cm) and
hip circumference (cm). Height and weight were
measured by stable stadiometer Seca (SECA,
Germany) and flat scale Seca (SECA, Germany). The
following anthropometric indices were calculated:
body mass index (BMI, kg/m2), body adiposity index
(BAI, %), waist to hip ratio (WHR), waist to height
ratio (WHtR) The percentage of body fat mass was
measured by a bioimpedance analyzer ABC-01
“MEDASS” (Russia).
All genetic analysis was performed by
commercial company Lytekh (Moscow, Russia).
DNA was extracted and purified from buccal
epithelium following the manufacturer’s procedures
(COrDIS Sprint). The rs1800592 was determined
using matrix-assisted laser desorption/ionization -
time of flight mass spectrometry (MALDI-TOF MS).
The genotype data was checked for Hardy-Weinberg
equilibrium (HWE).
Statistical analysis was performed in the
computer environment R, version 3.5.1 (RStudio
Team, 2015). A comparison of the allele and
genotype frequencies rs1800592 between two studied
groups was carried out using the Fisher exact test
(Raymond M., Rousset F., 1995). A standard
exploratory analysis was carried out (Shapiro and
Wilk, 1965; Grubbs, 1969; Levene et al., 1960).
Based on the results of the exploratory analysis, we
decided to use quantile regression (Koenker et al.,
2001). Quantile regression has a few advantages
compared to ordinary least square regression.
Quantile regression is robust to outliers and does not
require normality assumption. Moreover, here, the
upper conditional quantiles functions were of interest.
It is assumed that the effect of the rs1800592 of the
UCP1 will be stronger at higher values of the
dependent variables. The models were built using
quantreg package (Available at: https://CRAN.R-
project.org/package=quantreg was used to build the
regression model. Accessed: 07/08/2020). The
bootstrap algorithm was used to calculate the standard
error of the quantile regression model. Regression
models were constructed for quantiles 10, 20, 30, 40,
50, 60, 70, 80, 90 to test the main effect of physical
activity and the variant rs1800592 of the UCP1 on the
dependent variables. The main effect of the variant
1800592 UCP1 on obesity-related traits was tested in
the whole study population as well as in physically
active (N=54) and inactive individuals (N=70). The
dominant model was used (AG+GG vs AA). The
main effect of physical activity was tested in the
whole sample (N=124). The model was used to test
the combined effect of the risk rs1800592 variant of
the UCP1 and physical activity. Age was added to the
models as covariates. The Benjamini-Hochberg
method was used for multiple testing comparison.
3 RESULTS AND DISCUSSION
The baseline phenotypic characteristics of the
individuals are presented in the table 1 and figure 1.
The minor allele frequency of the variant UCP1
rs1800592 (G allele) in the studied sample was 0.25.
In European populations, minor allele frequency
ranged from 0.15 to 0.27. The distribution of the
rs1800592 UCP1 in the study sample was in Hardy-
Weinberg equilibrium (χ
2
=0.31, p=0.57). Physically
active and inactive individuals did not significantly
differ in the allele frequency of the UCP1 rs1800592
(p=0.14).
Quantile regression revealed that physical activity
had a significant effect on obesity-related traits (Table
1). Individuals with a low level of physical activity
had significantly higher body adiposity index
(ß=4.16, p=2*10
-4
), waist to height ratio (ß=0.01,
p=1*10
-3
) and the percentage of body fat mass
(ß=6.30, p=1*10
-4
). The influence of physical activity
was higher at the upper quantile of waist to height
Influence of the -3826A/G Polymorphism UCP1 (rs1800592) and Physical Activity on Obesity-related Traits in Russian Females with
Different Level of Physical Activity
157
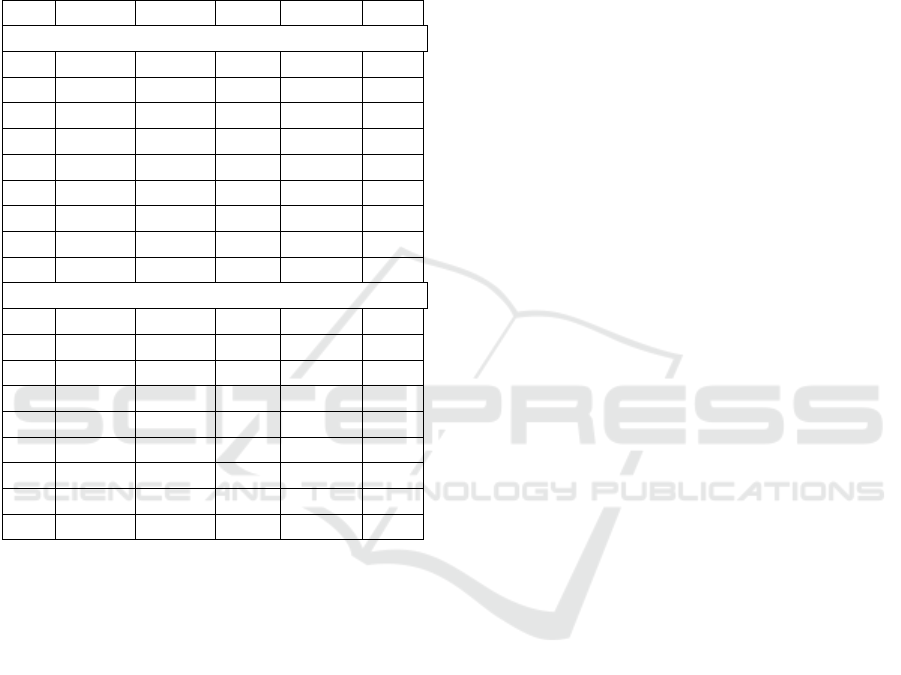
ratio, waist to hip ratio, and body adiposity index
(Fig. 2). Low level of physical activity led to increase
in waist to height ratio value by 0.01 at 25% quantile,
by 0.02 at 50% quantile (median) and by 0.04 at 90%
quantile (Fig. 2).
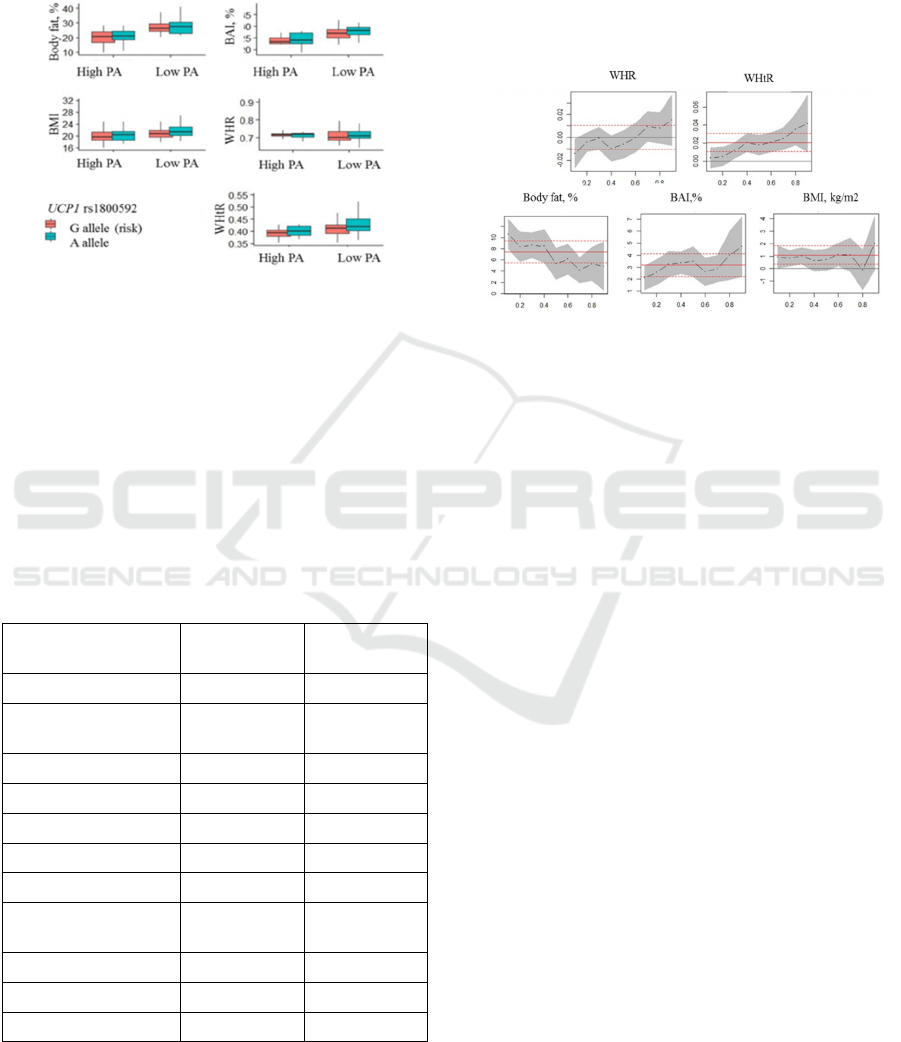
Figure 1: Boxplots of body fat percentage, body adiposity
index (BAI), body mass index (BMI), waist to hip ratio
(WHR), waist to height ratio (WHtR) in physically active
inactive individuals according to rs1800592 UCP1 risk
allele (AG+GG vs AA).
Insufficient physical activity increased the
amount of body fat. The influence of insufficient
physical activity is higher at the lower quantiles (Fig.
2). Moreover, a low level of physical activity led to
decrease in the amount of muscle mass (49.60% vs
51.1%, ß =-1.14, p=3*10
-3
).
Table 1: Baseline phenotypic characteristics of the studied
cohort (Mean, SD).
Parameter
Physically
active (n=54)
Physically
inactive (n=70)
Age 18.1 (4.2) 18.4 (0.9)
Waist circumference,
cm
65.8 (3.8) 69.2 (6.0)
Hip circumference, cm 90.9 (4.7) 96.5 (5.8)
Body weight, kg 56.3 (7.1) 57.7 (7.3)
Height, cm 165.2 (7.2) 163.7 (5.7)
BMI, kg/m
2
20.6 (2.2) 21.6 (2.8)
Body fat content, % 20.3 (4.8) 28.1 (4.8)
Body adiposity index,
%
25.1 (3.6) 28.1 (3.5)
Waist to hip ratio 0.72 (0.03) 0.72 (0.04)
Waist to height ratio 0.40 (0.03) 0.42 (0.04)
Muscle mass, % 50.5 (2.1) 48.6 (1.4)
Body mass index did not significantly differ
between physically active and inactive individuals
(ß=0.84, p=0.07). Anthropometric indices such as
waist to height ratio and body adiposity indices may
be better predictors of body fat accumulation in
individuals with different levels of physical activity
than body mass index (Sayeed et al., 2003; Lee et al.,
2008). In physically active individuals, an increase in
body mass index may be due to an increase in the
muscle mass rather than fat mass (Freedman et al.,
2005; Torstveit et al., 2012).
Figure 2: Changes of the beta (ß) value of the coefficients
(in y-axis) at different quantiles (in x-axis) of body fat
percentage, body adiposity index (BAI), body mass index
(BMI), waist to hip ratio (WHR), waist to height ratio
(WHtR) according to physical activity level.
In the studied sample, the risk G allele (AG+GG
vs AA) of the UCP1 rs18008592 was associated with
a higher body mass index (ß=1.89, p=0.04), waist to
hip ratio (ß=0.05, p=0.01), and waist to height ratio
(ß=0.05, p=0.05). Several studies reported that the
risk G allele increased the risk of obesity in different
populations (Cha et al., 2008; Chathoth et al., 2018).
In physically inactive individuals, the risk G allele
increased waist to height ratio, body mass index, the
percentage of body fat mass and waist to hip ratio
(table 2). In physically active individuals, the
significant effect of the risk variant UCP1 rs1800592
on waist to hip ratio (ß=0.03, p=0.05) and waist to
height ratio (ß=0.01, p=0.01) was confirmed at the
upper quantiles (table 2).
Physical activity and the UCP1 rs1800592 risk
variant significantly modified the risk of body fat
accumulation. However, physical activity has a
greater influence on obesity-related traits compared
to the UCP1 rs180592 risk variant. Physical activity
modified the influence of the UCP1 1800592 risk
variant on obesity-related traits. The influence of the
UCP1 rs180592 risk variant on obesity-related traits
was higher in individuals with a low level of physical
activity compared to physically active individuals.
Several studies reported that physical activity is an
effective way to control weight gain even in
individuals with genetic predisposition (Kilpeläinen
et al., 2011; Young et al., 2016; Rask-Andersen et al.,
icSPORTS 2020 - 8th International Conference on Sport Sciences Research and Technology Support
158
2017; Bondareva et al., 2019). For instance, the risk
FTO rs9939609 had a significant effect on body fat
accumulation only in individuals with a low level of
physical activity (Bondareva et al., 2019).
Table 2: Association of the risk G allele of the rs1800592
UCP1 and obesity-related traits in physically active and
inactive females (ß – regression coefficient,
* - p-value<0.05, ** - p-value<0.01, Q- quantile).
Q BF BMI WHR WHtR BAI
Physically inactive individuals
0.1 0.54 0.17 0.01 0.01 1.4**
0.2 0.95 0.4 0.02 0.02* 1.51*
0.3 0.51 0.97* 0.01 0.01 1.97*
0.4 1.26 0.76* 0.00 0.01 2.2*
0.5 1.65* 0.48 0.00 0.01 1.64*
0.6 1.41 1.18 0.00 0.01 1.24
0.7 2.63** 1.94** 0.01 0.03** 1.07
0.8 2.44** 2.09** 0.02 0.02* 0.49
0.9 6.13* 3.31** 0.04 0.07** 1.47
Physically active individuals
0.1 3.73* 0.03 0.001 0.01 1.55*
0.2 2.56* 0.01 0.001 0.001 -0.7*
0.3 0.31 0.01 0.001 0.001 0.32
0.4 0.85 0.01** 0.001 0.001 0.37
0.5 -0.22 0.66 0.001 0.01 0.65
0.6 0.03 0.6 0.001 0.01 0.59
0.7 0.29 0.8* 0.001 0.01 1.51
0.8 1.48 0.46 0.01 0.02** 1.65
0.9 0.10 1.30 0.01 0.03* 1.18
The study has several limitations. First, the UCP1
rs1800592 risk variant explained a small amount of
the variance of the obesity-related traits. Thus, it
cannot be a significant predictor of obesity. However,
recent study revealed around 1000 common obesity-
related loci accounted for 6% of the variance of
obesity-related traits (Yengo et al., 2018). Second, the
studied sample included only female individuals, so
the findings are not generalizable to other population,
i.e. male. Third, the conducted study is cross-
sectional, that does not take into account changes
across the life course.
4 CONCLUSIONS
Physical activity and the UCP1 rs1800592 risk
variant significantly influence the risk of fat
accumulation and obesity. However, physical activity
is a better predictor of fat accumulation and obesity
compared to the UCP1 rs1800592 risk variant.
However, to confirm the effect of the interaction,
additional studies are needed in adult males, as well
as in the group of children and adolescents.
REFERENCES
Alonso, A., Martí, A., Corbalán, M. S., Martínez-González,
M. A., Forga, L., & Martínez, J. A. 2005. Association
of UCP3 gene–55C> T polymorphism and obesity in a
Spanish population. Annals of nutrition and
metabolism, 49(3), 183-188.
Bergman, R.N., Stefanovski, D., Buchanan, T.A., Sumner,
A.E. et al. 2011. A better index of body adiposity.
Obesity, 19(5), 1083-1089.
Bondareva, E. A., Popova, E. V., Ketlerova, E. S.,
Kodaneva, L. N., & Otgon, G. 2019. Physical activity
attenuates the effect of the FTO T/A polymorphism on
obesity-related phenotypes in adult russian males.
Человек. Спорт. Медицина, 19(3).
Cha, M. H., Kang, B. K., Suh, D., Kim, K. S., Yang, Y., &
Yoon, Y. 2008. Association of UCP1 genetic
polymorphisms with blood pressure among Korean
female subjects. Journal of Korean medical science,
23(5), 776-780.
Chathoth S., Ismail M. H., Vatte C., Cyrus C., Al Ali Z. et
al. 2008. Association of Uncoupling Protein 1 (UCP1)
gene polymorphism with obesity: a case-control study.
BMC medical genetics, 19(1), 203.
Dong C., Lv Y., Xie L., Yang R., Chen L. et al. 2020.
Association of UCP1 polymorphisms with type 2
diabetes mellitus and their interaction with physical
activity and sedentary behavior. Gene, 739, 144497.
Freedman D.S., Wang J., Maynard L.M., Thornton J.C.,
Mei Z. et al. 2005. Relation of BMI to fat and fat-free
mass among children and adolescents. International
journal of obesity, 29(1), 1-8.
Grubbs, F. E. 1969. Procedures for detecting outlying
observations in samples. Technometrics, 11(1), 1-21.
Kilpeläinen T.O., Qi L., Brage S., Sharp S.J., Sonestedt E.
et al. 2011. Physical activity attenuates the influence of
FTO variants on obesity risk: a meta-analysis of
218,166 adults and 19,268 children. PLoS medicine,
8(11), e1001116.
Koenker, R., & Hallock, K. F. 2001. Quantile regression.
Journal of economic perspectives, 15(4), 143-156.
Lin, X., Lee, S., Christiani, D. C., & Lin, X. 2013. Test for
interactions between a genetic marker set and
environment in generalized linear models. Biostatistics,
14(4), 667-681.
Lee, C. M. Y., Huxley, R. R., Wildman, R. P., &
Woodward, M. 2008. Indices of abdominal obesity are
better discriminators of cardiovascular risk factors than
BMI: a meta-analysis. Journal of clinical epidemiology,
61(7), 646-653.
Levene H. 1960. Robust tests for equality of variances.
Stanford University Press, pp. 278–292.
Influence of the -3826A/G Polymorphism UCP1 (rs1800592) and Physical Activity on Obesity-related Traits in Russian Females with
Different Level of Physical Activity
159

Team, R. 2015. RStudio: integrated development for R.
RStudio. Inc., Boston, MA, 700.
Rask-Andersen, M., Karlsson, T., Ek, W. E., & Johansson,
Å. 2017. Gene-environment interaction study for BMI
reveals interactions between genetic factors and
physical activity, alcohol consumption and
socioeconomic status. PLoS genetics, 13(9), e1006977.
Raymond, M., & Rousset, F. 1995. An exact test for
population differentiation. Evolution, 49(6), 1280-
1283.
Sayeed, M. A., Mahtab, H., Latif, Z. A., Khanam, P. A.,
Ahsan, K. A., Banu, A., & Azad, A. K. 2003. Waist-to-
height ratio is a better obesity index than body mass
index and waist-to-hip ratio for predicting diabetes,
hypertension and lipidemia. Bangladesh Medical
Research Council Bulletin, 29(1), 1-10.
Shapiro, S. S., & Wilk, M. B. 1965. An analysis of variance
test for normality (complete samples). Biometrika,
52(3/4), 591-611.
Torstveit M. K., Sundgot-Borgen J. 2012. Are under-and
overweight female elite athletes thin and fat? A
controlled study. Medicine & Science in Sports &
Exercise, 44(5), 949-957.
Koenker R. Quantile regression in r: a vignette. Available
at: CRAN: http://cran.r-project.org. Accessed
08.07.2020.
icSPORTS 2020 - 8th International Conference on Sport Sciences Research and Technology Support
160
