
Empirical Evaluation of Distance Measures for Nearest Point with
Indexing Ratio Clustering Algorithm
Raneem Qaddoura
1
, Hossam Faris
2
, Ibrahim Aljarah
2
, J. J. Merelo
3
and Pedro A. Castillo
3
1
Information Technology, Philadelphia University, Amman, Jordan
2
Department of Business Information Technology, King Abdullah II School for Information Technology,
The University of Jordan, Amman, Jordan
3
ETSIIT-CITIC, University of Granada, Granada, Spain
http://www.evo-ml.com
Keywords:
Clustering, Cluster Analysis, Distance Measure, Nearest Point with Indexing Ratio, NPIR, Nearest Point,
Indexing Ratio, Nearest Neighbor Search Technique.
Abstract:
Selecting the proper distance measure is very challenging for most clustering algorithms. Some common dis-
tance measures include Manhattan (City-block), Euclidean, Minkowski, and Chebyshev. The so called Nearest
Point with Indexing Ratio (NPIR) is a recent clustering algorithm, which tries to overcome the limitations of
other algorithms by identifying arbitrary shapes of clusters, non-spherical distribution of points, and shapes
with different densities. It does so by iteratively utilizing the nearest neighbors search technique to find dif-
ferent clusters. The current implementation of the algorithm considers the Euclidean distance measure, which
is used for the experiments presented in the original paper of the algorithm. In this paper, the impact of the
four common distance measures on NPIR clustering algorithm is investigated. The performance of NPIR al-
gorithm in accordance to purity and entropy measures is investigated on nine data sets. The comparative study
demonstrates that the NPIR generates better results when Manhattan distance measure is used compared to the
other distance measures for the studied high dimensional data sets in terms of purity and entropy.
1 INTRODUCTION
Clustering is the task of grouping similar points to the
same cluster and dissimilar points to different clus-
ters (Han et al., 2011). It is used in many applications
such as image processing (Kumar et al., 2018; Santos
et al., 2017), dental radiography segmentation (Qad-
doura et al., 2020a), pattern recognition (Liu et al.,
2017; Silva et al., 2017), document categorization
(Mei et al., 2017; Brodi
´
c et al., 2017), and financial
risk analysis (Kou et al., 2014).
A recent clustering algorithm was proposed by
(Qaddoura et al., 2020b), which is named Nearest
Point with Indexing ratio (NPIR). NPIR uses the near-
est neighbor search technique along with three novel
operations, which are Election, Selection, and As-
signment. It is a combination of partitional clus-
tering and density-based clustering approaches as it
uses iterations same as K-means, and also uses near-
est neighbors search technique to find dense predicted
clusters.
The original paper of NPIR (Qaddoura et al.,
2020b) uses the Euclidean distance measure to find
the nearest neighbors of a certain point. Authors of
the algorithm argued that the performance of the al-
gorithm decreases for high dimensional data sets due
to the use of the Euclidean distance. Thus, in this
work, we experiment NPIR using other distance mea-
sures such as Manhattan, Chebyshev, and Minkowski
distance measures. The results of running the algo-
rithm are evaluated using two well-known measures,
which are purity and entropy.
The remainder of the paper is organized as fol-
lows: Section 2 presents recent work on cluster-
ing. Section 3 describes in brief the nearest neigh-
bors search technique, the distance measures, and the
NPIR algorithm. Section 4 discusses the experimental
results. Finally, Section 5 concludes the work.
2 RELATED WORK
Clustering algorithms can be categorized into par-
titioning algorithms, hierarchical algorithms, and
430
Qaddoura, R., Faris, H., Aljarah, I., Merelo, J. and Castillo, P.
Empirical Evaluation of Distance Measures for Nearest Point with Indexing Ratio Clustering Algorithm.
DOI: 10.5220/0010121504300438
In Proceedings of the 12th International Joint Conference on Computational Intelligence (IJCCI 2020), pages 430-438
ISBN: 978-989-758-475-6
Copyright
c
2020 by SCITEPRESS – Science and Technology Publications, Lda. All rights reserved

density-based algorithms (Han et al., 2011; Chen
et al., 2016; Lu et al., 2018). Partitioning algorithms
include K-means (Jain, 2010), K-means++ (Arthur
and Vassilvitskii, 2007), and Expectation Maximiza-
tion (EM) (Han et al., 2011). Density-based algo-
rithms include DBSCAN (Ester et al., 1996) and OP-
TICS (Ankerst et al., 1999). Hierarchical algorithms
include BIRCH (Zhang et al., 1996) and HDBSCAN
(Campello et al., 2015). Partitioning algorithms are
not suitable for non-spherical clusters and they fall in
local optima (Chen et al., 2016). Hierarchical algo-
rithms are not suitable for clusters that are not well
separated and they take more time and space com-
pared to the partitioning algorithms (Lu et al., 2018).
Density-based algorithms fail to detect clusters of dif-
ferent densities (Chen et al., 2016; Lu et al., 2018)
and parameters tuning is very difficult for these al-
gorithms. Another class of algorithms combining
nature-inspired algorithms and partitional clustering
algorithms can also be observed for clustering (Qad-
doura et al., 2020c).
Due to the limitations of the aforementioned algo-
rithms, work can still be found for solving the clus-
tering task. A cluster weights are determined for each
cluster in the MinMax K-means algorithm proposed
by (Tzortzis and Likas, 2014). The work of (Frandsen
et al., 2015) uses iterative K-means to cluster site rates
by selecting the partitional schemes automatically.
entropy-based farthest neighbor technique is used to
find the initial centroids in K-means in the work of
(Trivedi and Kanungo, 2017). A residual error-based
density peak clustering algorithm (REDPC), is pro-
posed in the work of (Parmar et al., 2019) to han-
dle data sets of various data distribution patterns. An
improved density algorithm named as DPC-LG, uses
logistic distribution that is proposed in the work of
(Jiang et al., 2019). The work of (Cheng et al., 2019)
presents a Hierarchical Clustering algorithm Based
on Noise Removal (HCBNR), which recognizes noise
points and finds arbitrary shaped clusters. An ant-
based method that takes advantage of the coopera-
tive self-organization of Ant Colony Systems to cre-
ate a naturally inspired clustering and pattern recog-
nition method is proposed in (Fernandes et al., 2008).
The work of (Sfetsos and Siriopoulos, 2004) consid-
ers a cluster-based combinatorial forecasting schemes
based on clustering algorithms and neural networks
with an emphasis placed on the formulation of the
problem for better forecasts. Authors in (Pal et al.,
1996) criticized the sequential competitive learning
algorithms that are curious hybrids of algorithms used
to optimize the fuzzy c-means (FCM) and learning
vector quantization (LVQ) models by showing that
they do not optimize the FCM functional and the gra-
dient descent conditions are not the necessary condi-
tions for optimization of a sequential FCM functional.
The work of (Bhattacharyya et al., 2016) discusses
data sets with multiple dimensions. It shows how data
clustering is applied on such data sets. Large and high
dimensional data sets are experimented using a vari-
ant of the EM algorithm in the work of (Kadir et al.,
2014). Parallel implementation of the Best of both
Worlds (BoW) method on a very large moderate-to-
high dimensional data set can be found in the work
of (Ferreira Cordeiro et al., 2011). GARDEN
HD
is
an effective, efficient, and scalable algorithm which
is introduced in the work of (Orlandic et al., 2005) on
multi-dimensional data set. In addition, several works
can be found for large scale data sets in the work of
(Al-Madi et al., 2014; Aljarah and Ludwig, 2012; Al-
jarah and Ludwig, 2013a; Cui et al., 2014)
Distance measures effect on clustering is ana-
lyzed and compared in several studies. The paper
(Finch, 2005) presents a comparison of four distance
measures in clustering with dichotomous data and
their performance in correctly classifying the individ-
uals. Other comparison can be found in the work
of (Huang, 2008) by analyzing the effectiveness of
five distance measures in partitional clustering for text
document datasets. Further, a technical framework is
proposed in the work of (Shirkhorshidi et al., 2015)
to compare the effect of different distance measures
on fiffteen datasets which are classified as low and
high-dimensional categories to study the performance
of each measure against each category. The work of
(Pandit et al., 2011) presents the effect of different
distance measures based on application domain, effi-
ciency, benefits and drawbacks. Other works can also
be found in the literature which are specialized to spe-
cific domain or algorithm. Authors of (Klawonn and
Keller, 1999) proposed a modified distance function
of the fuzzy c-means based on the dot product to de-
tect different cluster shape, lines, and hyper-planes.
A study of the effect of different distance measures
in detecting outliers using clustering-based algorithm
for circular regression model is presented in (Di and
Satari, 2017). Authors of (Paukkeri et al., 2011) stud-
ied the effect of dimensionality reduction on different
distance measures in document clustering.
Due to the shortness of the partitional and the
density-based algorithms on clusters of non-spherical
shapes and clusters of different densities, respectively,
a very recent algorithm was introduced by the authors
of (Qaddoura et al., 2020b), which is named Nearest
Point with Indexing Ratio (NPIR). It combines both
behaviors of partitional and density-based algorithms
by using iterations and the nearest neighbor search
technique. It detects arbitrary shaped clusters having
Empirical Evaluation of Distance Measures for Nearest Point with Indexing Ratio Clustering Algorithm
431

non-spherical clusters and clusters with different sizes
or densities. However, it uses the Euclidean distance
to calculate the distance between any two points. In
some cases, this leads to low quality of results for high
dimensional data sets. Thus, this work investigates
other distance measures for calculating the distance
between the points in the NPIR algorithm, to find the
most appropriate distance measure for the high di-
mensional data sets.
3 GENERAL DEFINITIONS AND
TERMINOLOGY
This section discusses the nearest neighbors search
problem and the distance measures for finding the
nearest neighbors. This section also discusses the
NPIR algorithm, which is used in the experiments.
3.1 Nearest Neighbors and Distance
Measures
Searching for the nearest neighbors of a point is used
as part of performing the clustering task for many re-
cent algorithms (Lu et al., 2018). It is used to clus-
ter the closest points to a certain point to the cluster
of that point. The nearest neighbor search problem
can be defined as follows (Lu et al., 2018; Hoffmann,
2010):
Definition 1. Given a set of N points
P = {p
1
, p
2
...p
N
} in space, find k-NN(p
i
) =
{nn
1
,nn
2
...nn
k
} which represents the k-nearest neigh-
bors set of a certain point p
i
where p
i
∈ {p
1
, p
2
...p
N
},
k = |k-NN(p
i
)|, and k < N.
A distance measure is used to discover a near-
est neighbor nn
j
∈ {nn
1
,nn
2
...nn
k
} to a point p
i
∈
{p
1
, p
2
...p
N
}. Several distance measures can be used
to find the nearest neighbor, which include Manhat-
tan (Black, 2006), Euclidean (Anton, 2013), Cheby-
shev (Cantrell, 2000), and Minkowski (Grabusts et al.,
2011).
The Minkowski distance measure generalizes
other distance measures such as Euclidean and Man-
hattan distance measures having different values of r
to calculate the distance between the point p
i
and nn
j
.
Minkowski distance can be defined as follows (Gra-
busts et al., 2011):
Minkowski(p
i
,nn
j
) = (
d
∑
f =1
|p
i f
− nn
j f
|
r
)
1/r
(1)
where d is the dimension or the number of features
and f is the feature number. Manhattan, Euclidean,
and Chebyshev distance measures are derived from
the Minkowski distance measure where a p value of 1,
2, and ∞ is determined, respectively. These measures
can be defined by Equations 2, 3, and 4:
Manhattan(p
i
,nn
j
) =
d
∑
f =1
|p
i f
− nn
j f
| (2)
Euclidean(p
i
,nn
j
) =
v
u
u
t
d
∑
f =1
(p
i f
− nn
j f
)
2
(3)
Chebyshev(p
i
,nn
j
) = lim
r−>∞
(
d
∑
f =1
|p
i f
− nn
j f
|
r
)
1/r
= max
f
|p
i f
− nn
j f
|
(4)
3.2 Nearest Point with Indexing Ratio
(NPIR) Algorithm
Nearest Point with Indexing Ratio (NPIR) is a recent
clustering algorithm with three parameters: the num-
ber of clusters (k), the indexing ratio (IR), and the
number of iterations (i). NPIR consists of three main
operations, namely the Election, the Selection, and
the Assignment. The Election simply selects an as-
signed point in space and names it as Elected. The
Selection considers selecting the k-NN point to the
Elected point and naming it as Nearest. The Assign-
ment considers assigning the Nearest to the cluster of
the Elected, and marking the Elected as the Assigner,
if the Nearest is not assigned or the Nearest is closer
to the Elected than its original Assigner. At each as-
signment/reassignment of the Nearest to the cluster of
the Elected, the descendants of the Nearest are clus-
tered to the cluster of the Elected. K-dimensional
tree (Maneewongvatana and Mount, 1999) is used to
find the Nearest point to an Elected point. The Eu-
clidean distance is used to find the distance between
the points
1
.
The algorithm uses an iterative process to enhance
the quality of the clustering results. At each iteration,
multiple Election, Selection, and Assignment oper-
ations are performed, which are controlled by the IR
parameter. That is, multiple considerations for select-
ing a Nearest point for an Elected point and consid-
erations of assigning/reassigning the Nearest to the
cluster of the Elected. Pseudocode 1 represents the
steps of the algorithm. Lines 2 – 5 represents the ini-
tial steps of the algorithm. Lines 6 – 24 represents
1
http://evo-ml.com/npir/
NCTA 2020 - 12th International Conference on Neural Computation Theory and Applications
432

Algorithm 1: NPIR Pseudo Code (Qaddoura et al., 2020b).
Input: Points, K, IR, i
Output: The predicted assignments
1: procedure NPIR
2: Initialize index, iterations
3: Create K-dimensional tree for the points
4: TotalIndex =Round(IR × (#Points)
2
)
5: Select k random points as the initial points for the clusters
6: repeat
7: repeat
8: Randomly elect an assigned point and mark it as Elected (E)
9: Select the k-NN point of the Elected
10: Mark the selected points as Nearest (N)
11: Increment the k value of the k-NN for the Elected by 1
12: if Nearest is not assigned yet to a cluster or (Nearest is assigned to a
13: different cluster than the Elected and
14: distance(N,E)<distance(N,A)) then
15: Assign the Nearest and its descendants to the cluster of the Elected
16: Mark the Elected as the Assigner (A) for the Nearest
17: Add the Nearest as a descendant to the Assigner
18: if Old cluster of the Nearest becomes empty then
19: Assign a random point to the old empty cluster of the Nearest
20: end if
21: end if
22: until All points are clustered and index++>TotalIndex
23: Set the pointer to the first element of the distance vector for all points
24: until iterations++>i
25: return the predicted assignments
26: end procedure
the iterations performed where each iteration consists
of multiple inner iterations displayed at lines 7 – 22.
Inner iterations represents the multiple considerations
of the Election (line 8), Selection (lines 9 – 11), and
Assignment (lines 12 – 21) operations.
4 EXPERIMENTAL RESULTS
This section presents the environment, evaluation
measures, a presentation of the data sets, and the dis-
cussion of the results.
4.1 Environment
We ran the experiments on a personal computer with
Intel core i7-5500U CPU @ 2.40GHz/8 GB RAM.
For experiments, we used Python 3.7 and the Scikit
Learn Python library (Pedregosa et al., 2011) to eval-
uate the algorithm using different distance measures.
4.2 Evaluation Measures
The results which are obtained from running the
NPIR algorithm, are evaluated using the purity and
entropy measures (Aljarah and Ludwig, 2013b). High
purity and low entropy values indicate better cluster-
ing results (Qaddoura et al., 2020a).
Given L as the true labels of N points and R as the
predicted clusters of these points. The purity and en-
tropy measures can be formalize as follows (Aljarah
and Ludwig, 2013b):
Purity =
1
N
k
∑
j=1
max
i
(|L
i
∩ R
j
|) (5)
where R
j
presents all points assigned to cluster j, k
is the number of clusters, and L
i
is the labels of the
points in cluster i.
Entropy =
k
∑
j=1
(|R
j
|)
n
E(R
j
) (6)
where E(R
j
) is the individual entropy of a cluster. In-
dividual cluster entropy is calculated using Equation
Empirical Evaluation of Distance Measures for Nearest Point with Indexing Ratio Clustering Algorithm
433

7:
E(R
j
) = −
1
logk
k
∑
i=1
|R
j
∩ L
i
|
R
j
log(
|R
j
∩ L
i
|
R
j
) (7)
4.3 Data Sets
Data sets with different number of features are se-
lected to evaluate the NPIR algorithm using differ-
ent distance measures. The aim is to find a corre-
lation between the number of features and the best
distance measure, which suits the NPIR algorithm on
the selected data sets. The data sets are gathered
from UCI machine learning repository
2
(Dheeru and
Karra Taniskidou, 2017). Table 1 shows the name,
number of clusters (k), number of points (#instances),
and number of features for each data set.
4.4 Results and Discussion
To evaluate NPIR algorithm using different distance
measures, the experiments are performed for 30 in-
dependent runs for each data set. The average purity
and entropy results are listed in Tables 2 and 3, re-
spectively, for different distance measures having dif-
ferent p values for Minkowski, which are 1, 2, 4, 8,
and ∞. The p values of 1, 2, and ∞ represent the Man-
hattan, Euclidean, and Chebyshev distance measures,
respectively.
Table 2 shows that datasets with low dimensions
including Iris 2D, Iris, Diagnosis II and Seeds data
sets, having 2, 4, 6, and 7 features, respectively,
have the best average results for different distance
measures which are Euclidean, Manhattan/Euclidean,
Chebyshev, and Chebyshev, respectively. In contrast,
Manhattan distance measure is recommended to be
used for high dimensional data sets as it shows the
highest average values of purity for the remaining
high dimensional data sets. This recommendation
is consistent with the other studies in the literature
(Pandit et al., 2011; Aggarwal et al., 2001; Aggar-
wal et al., 2001; Song et al., 2017; Tolentino and
Gerardo, 2019) in which Manhattan distance mea-
sure has proven to give the best performance for high
dimensional datasets for k-means (Aggarwal et al.,
2001), Partial Least Square (PLS) and PLS discrim-
inant analysis (PLS-DA) (Song et al., 2017), and
Fuzzy C-Means (Tolentino and Gerardo, 2019) algo-
rithms. It is also observed from Table 2 that Cheby-
shev has relatively bad results for high dimensional
data sets compared to the other distance measures.
Thus, Chebyshev is not recommended to be used for
2
https://archive.ics.uci.edu/ml/
NPIR on high dimensional data sets. We can also
observe that the same purity values are achieved by
different distance measures for data sets having un-
balanced data, which include Pop failure dataset and
Unbalanced data set.
Table 3 generates similar observations given by
Table 2. It shows that Iris 2D, Iris, Diagnosis II,
and Seeds data sets, having low dimensions of val-
ues 2, 4, 6, and 7, respectively, have the best av-
erage results for different distance measures which
are Euclidean, Manhattan/Euclidean, Chebyshev, and
Chebychev, respectively. In contrast, Manhattan dis-
tance measure is recommended to be used for high
dimensional data sets and Chebyshev is not recom-
mended for such data sets. In addition, and as ob-
served from Table 2, unbalanced data set has the same
values for different distance measures.
Since more features are considered for high di-
mensional datasets than lower dimensional ones,
Manhattan distance gives better results as it calculates
the distance between two points without exaggerat-
ing the discrepancy of the features, which is found
in the other distance measures of this study. That
is, when a point is close to another one for most
features but not for few, Manhattan distance kind of
shrug the few features off and is influenced by the
distance of most features. This is not recognized for
datasets with low dimensions since the possibility of
having this discrepancy is minimal. In addition, NPIR
algorithm considers iterative correction of wrongly
clustered points with random selection of different
Elected points, which makes it suitable to Manhattan
distance for high dimensional datasets, since shrug-
ging the few features off when calculating the dis-
tance can be corrected in later iterations if the effect of
such few features is detected to be of more importance
for a different Elected and corresponding Nearest.
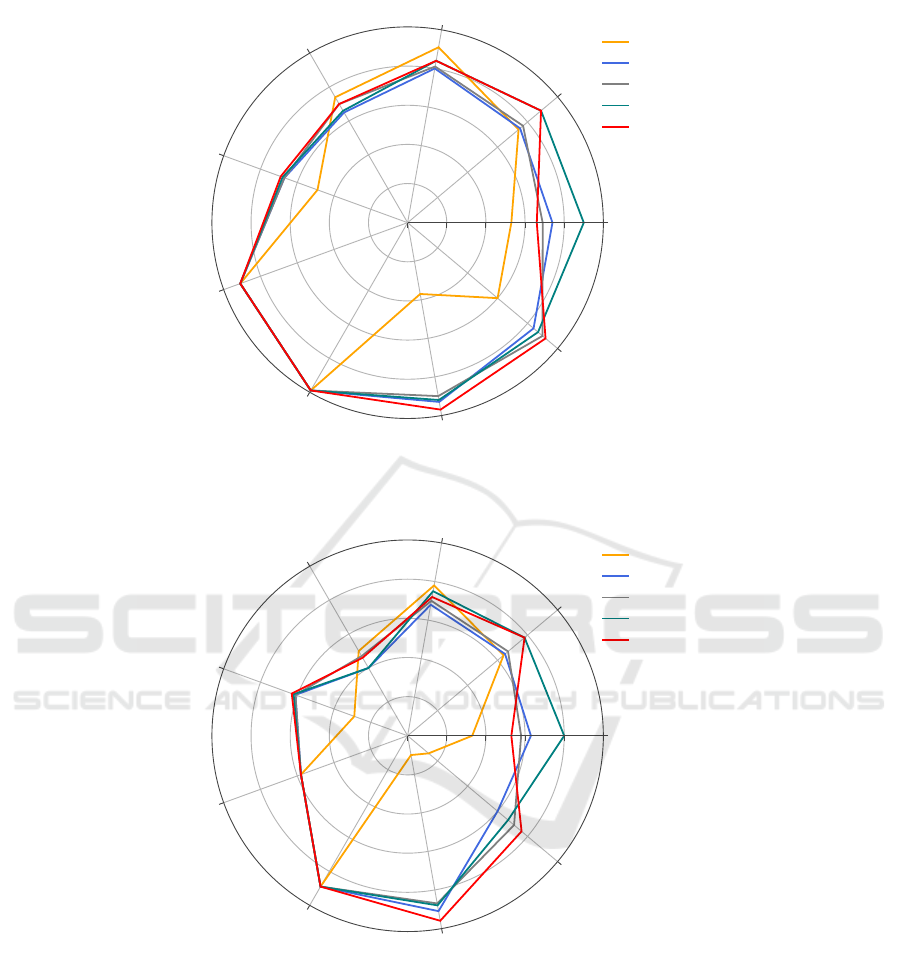
Figures 1 and 2 also represent the results obtained
from running the algorithm. The radar lines represent
the purity and entropy values for each distance mea-
sure. The range of the values starts with the center
of the radar at the worst value possible for the mea-
sure, and ends with the boundaries of the radar at the
best value possible. This means that the range of the
purity values starts at 0 and reaches 1 whereas the
range of the entropy values starts at 1 and reaches
0. It is observed from the two figures that the radar
line of the high dimensional data sets for the City
block (Manhattan) distance measure is surrounding
the other radar lines for the other measures. This in-
dicates better clustering results having high values of
purity and low values of entropy for the City block
distance measure. In contrast, the radar line of the
high dimensional data sets for the Chebyshev distance
NCTA 2020 - 12th International Conference on Neural Computation Theory and Applications
434

Table 1: Data sets properties.
Data set No. of clusters(k) No. of instances No. of features
Iris 2D 3 150 2
Iris 3 150 4
Diagnosis II 2 120 6
Seeds 3 210 7
Zoo 7 101 16
Pop failures 2 540 18
Unbalanced 2 856 32
Soybean small 4 47 35
Divorce 2 170 54
Table 2: Purity results for applying Manhattan, Euclidean, Chebyshev, and Minkowski distance measures on NPIR algorithm.
Dataset Manhattan Euclidean Minkowski (p=4) Minkowski (p=8) Chebyshev
Iris 2D 0.66 0.9 0.69 0.74 0.53
Iris 0.89 0.89 0.77 0.75 0.74
Diagnosis II 0.84 0.84 0.81 0.8 0.91
Seeds 0.7 0.66 0.7 0.65 0.74
Zoo 0.69 0.68 0.67 0.67 0.49
Pop failures 0.91 0.91 0.91 0.91 0.91
Unbalanced 0.99 0.99 0.99 0.99 0.99
Soybean-small 0.97 0.92 0.9 0.93 0.37
Divorce 0.92 0.87 0.9 0.84 0.6
Table 3: Entropy results for applying Manhattan, Euclidean, Chebyshev, and Minkowski distance measures on NPIR algo-
rithm.
Dataset Manhattan Euclidean Minkowski (p=4) Minkowski (p=8) Chebyshev
Iris 2D 0.47 0.2 0.42 0.37 0.67
Iris 0.22 0.22 0.33 0.35 0.36
Diagnosis II 0.28 0.25 0.3 0.32 0.22
Seeds 0.54 0.6 0.53 0.6 0.5
Zoo 0.37 0.38 0.39 0.39 0.71
Pop failures 0.42 0.42 0.42 0.42 0.42
Unbalanced 0.11 0.11 0.11 0.11 0.11
Soybean-small 0.04 0.12 0.13 0.09 0.9
Divorce 0.24 0.33 0.29 0.4 0.86
measure indicates worst clustering results having low
values of purity and high values of entropy. In ad-
dition, identical values of purity and entropy can be
observed for Pop failure and Unbalanced data sets.
5 CONCLUSION
Identifying the right distance measure for an algo-
rithm, which gives the best quality results for a se-
lected dataset, is a good practice in clustering. NPIR
is a recent algorithm which considers the distance be-
tween points to perform the clustering task. In this
paper, an experimental study is done using different
distance measures to find the impact of the distance
measurement method on the performance of NPIR al-
gorithm. In this paper, the distance is measured be-
tween the points in space and the corresponding near-
est neighbors for the K-dimensional tree data struc-
ture, which is used in the NPIR algorithm. The re-
sults of the experiments show that Manhattan distance
measure has the best average purity and entropy val-
ues for high dimensional data sets, whereas Cheby-
chev has the worst values for these data sets. The re-
sults also show that close and identical values of pu-
rity and entropy are achieved for low dimensional data
sets and unbalanced data sets. Manhattan distance
measure is best suited for NPIR for high dimensional
datasets for two reasons: First, Manhattan distance
measure calculates the distance between two points
without exaggerating the discrepancy of the features.
Second, the iterative correction of wrongly clustered
Empirical Evaluation of Distance Measures for Nearest Point with Indexing Ratio Clustering Algorithm
435
Iris 2D
Iris
Diagnosis II
Seeds
Zoo
Pop failures
Unbalanced
Soybean small
Divorce
0 0.2 0.4 0.6 0.8 1
Chebyshev
Minkowski (p=8)
Minkowski (p=4)
Euclidean
Cityblock
Figure 1: Radar chart for the purity values for applying City-block (Manhattan), Euclidean, Minkowski (p=4), Minkowski
(p=8), and Chebyshev distance measures on NPIR algorithm.
Iris 2D
Iris
Diagnosis II
Seeds
Zoo
Pop failures
Unbalanced
Soybean small
Divorce
1 0.8 0.6 0.4 0.2 0
Chebyshev
Minkowski (p=8)
Minkowski (p=4)
Euclidean
Cityblock
Figure 2: Radar chart for the entropy values for applying City-block (Manhattan), Euclidean, Minkowski (p=4), Minkowski
(p=8), and Chebyshev distance measures on NPIR algorithm.
points in NPIR overcomes the possible shrugging of
the few features off when calculating the Manhattan
distance if the effect of such few features is detected
to be of more importance for different Elections of
points.
For future work, different evaluation measures
can be investigated for measuring the performance of
NPIR for different distance measures. We can use
evaluation measures besides the purity and entropy
measures, which might include Homogeneity Score,
Completeness Score, V-Measure, Adjusted Rand In-
dex, and Adjusted Mutual Information, extending the
practical validity of the work. The effect of different
distance measures can also be experimented on differ-
ent algorithm than NPIR, which might include neural
network or deep learning algorithms.
NCTA 2020 - 12th International Conference on Neural Computation Theory and Applications
436

ACKNOWLEDGEMENTS
This work is supported by the Ministerio espa
˜
nol de
Econom
´
ıa y Competitividad under project TIN2017-
85727-C4-2-P (UGR-DeepBio).
REFERENCES
Aggarwal, C. C., Hinneburg, A., and Keim, D. A. (2001).
On the surprising behavior of distance metrics in high
dimensional space. In International conference on
database theory, pages 420–434. Springer.
Al-Madi, N., Aljarah, I., and Ludwig, S. A. (2014). Par-
allel glowworm swarm optimization clustering algo-
rithm based on mapreduce. In Swarm Intelligence
(SIS), 2014 IEEE Symposium on, pages 1–8. IEEE.
Aljarah, I. and Ludwig, S. A. (2012). Parallel parti-
cle swarm optimization clustering algorithm based
on mapreduce methodology. In Nature and biologi-
cally inspired computing (NaBIC), 2012 fourth world
congress on, pages 104–111. IEEE.
Aljarah, I. and Ludwig, S. A. (2013a). Mapreduce intrusion
detection system based on a particle swarm optimiza-
tion clustering algorithm. In Evolutionary Computa-
tion (CEC), 2013 IEEE Congress on, pages 955–962.
IEEE.
Aljarah, I. and Ludwig, S. A. (2013b). A new cluster-
ing approach based on glowworm swarm optimiza-
tion. In Evolutionary Computation (CEC), 2013 IEEE
Congress on, pages 2642–2649. IEEE.
Ankerst, M., Breunig, M. M., Kriegel, H.-P., and Sander, J.
(1999). Optics: Ordering points to identify the clus-
tering structure. In Proceedings of the 1999 ACM
SIGMOD International Conference on Management
of Data, SIGMOD ’99, page 49–60, New York, NY,
USA. Association for Computing Machinery.
Anton, H. (2013). Elementary Linear Algebra, Binder
Ready Version. John Wiley & Sons.
Arthur, D. and Vassilvitskii, S. (2007). k-means++: The
advantages of careful seeding. In Proceedings of the
eighteenth annual ACM-SIAM symposium on Discrete
algorithms, pages 1027–1035. Society for Industrial
and Applied Mathematics.
Bhattacharyya, S., De, S., Pan, I., and Dutta, P. (2016). In-
telligent Multidimensional Data Clustering and Anal-
ysis. IGI Global.
Black, P. E. (2006). Manhattan distance”” dictionary of
algorithms and data structures. http://xlinux. nist.
gov/dads//.
Brodi
´
c, D., Amelio, A., and Milivojevi
´
c, Z. N. (2017). Clus-
tering documents in evolving languages by image tex-
ture analysis. Applied Intelligence, 46(4):916–933.
Campello, R. J., Moulavi, D., Zimek, A., and Sander, J.
(2015). Hierarchical density estimates for data cluster-
ing, visualization, and outlier detection. ACM Trans-
actions on Knowledge Discovery from Data (TKDD),
10(1):5.
Cantrell, C. D. (2000). Modern mathematical methods
for physicists and engineers. Cambridge University
Press.
Chen, M., Li, L., Wang, B., Cheng, J., Pan, L., and Chen,
X. (2016). Effectively clustering by finding density
backbone based-on knn. Pattern Recognition, 60:486–
498.
Cheng, D., Zhu, Q., Huang, J., Wu, Q., and Yang, L. (2019).
A hierarchical clustering algorithm based on noise re-
moval. International Journal of Machine Learning
and Cybernetics, 10(7):1591–1602.
Cui, X., Zhu, P., Yang, X., Li, K., and Ji, C. (2014). Op-
timized big data k-means clustering using mapreduce.
Journal of Supercomputing, 70(3).
Dheeru, D. and Karra Taniskidou, E. (2017). UCI machine
learning repository.
Di, N. F. M. and Satari, S. Z. (2017). The effect of
different distance measures in detecting outliers us-
ing clustering-based algorithm for circular regression
model. In AIP Conference Proceedings, volume 1842,
page 030016. AIP Publishing LLC.
Ester, M., Kriegel, H.-P., Sander, J., and Xu, X. (1996).
A density-based algorithm for discovering clusters in
large spatial databases with noise. In Proceedings of
the Second International Conference on Knowledge
Discovery and Data Mining, KDD’96, page 226–231.
AAAI Press.
Fernandes, C., Mora, A. M., Merelo, J. J., Ramos, V., and
Laredo, J. L. J. (2008). Kohonants: a self-organizing
ant algorithm for clustering and pattern classification.
arXiv preprint arXiv:0803.2695.
Ferreira Cordeiro, R. L., Traina Junior, C., Machado Traina,
A. J., L
´
opez, J., Kang, U., and Faloutsos, C. (2011).
Clustering very large multi-dimensional datasets with
mapreduce. In Proceedings of the 17th ACM SIGKDD
international conference on Knowledge discovery and
data mining, pages 690–698. ACM.
Finch, H. (2005). Comparison of distance measures in clus-
ter analysis with dichotomous data. Journal of Data
Science, 3(1):85–100.
Frandsen, P. B., Calcott, B., Mayer, C., and Lanfear, R.
(2015). Automatic selection of partitioning schemes
for phylogenetic analyses using iterative k-means
clustering of site rates. BMC evolutionary biology,
15(1):13.
Grabusts, P. et al. (2011). The choice of metrics for clus-
tering algorithms. In Proceedings of the 8th Interna-
tional Scientific and Practical Conference, volume 2,
pages 70–76.
Han, J., Pei, J., and Kamber, M. (2011). Data mining: con-
cepts and techniques. Elsevier.
Hoffmann, B. S. (2010). Similarity search with set intersec-
tion as a distance measure. PhD thesis, University of
Stuttgart.
Huang, A. (2008). Similarity measures for text document
clustering. In Proceedings of the sixth new zealand
computer science research student conference (NZC-
SRSC2008), Christchurch, New Zealand, volume 4,
pages 9–56.
Jain, A. K. (2010). Data clustering: 50 years beyond k-
means. Pattern recognition letters, 31(8):651–666.
Empirical Evaluation of Distance Measures for Nearest Point with Indexing Ratio Clustering Algorithm
437

Jiang, J., Chen, Y., Hao, D., and Li, K. (2019). Dpc-lg:
Density peaks clustering based on logistic distribution
and gravitation. Physica A: Statistical Mechanics and
its Applications, 514:25–35.
Kadir, S. N., Goodman, D. F., and Harris, K. D. (2014).
High-dimensional cluster analysis with the masked
em algorithm. Neural computation.
Klawonn, F. and Keller, A. (1999). Fuzzy clustering based
on modified distance measures. In International Sym-
posium on Intelligent Data Analysis, pages 291–301.
Springer.
Kou, G., Peng, Y., and Wang, G. (2014). Evaluation of
clustering algorithms for financial risk analysis using
mcdm methods. Information Sciences, 275:1–12.
Kumar, S., Pant, M., Kumar, M., and Dutt, A. (2018).
Colour image segmentation with histogram and ho-
mogeneity histogram difference using evolutionary al-
gorithms. International Journal of Machine Learning
and Cybernetics, 9(1):163–183.
Liu, A., Su, Y., Nie, W., and Kankanhalli, M. S. (2017). Hi-
erarchical clustering multi-task learning for joint hu-
man action grouping and recognition. IEEE Trans.
Pattern Anal. Mach. Intell., 39(1):102–114.
Lu, J., Zhu, Q., and Wu, Q. (2018). A novel data cluster-
ing algorithm using heuristic rules based on k-nearest
neighbors chain. Engineering Applications of Artifi-
cial Intelligence, 72:213–227.
Maneewongvatana, S. and Mount, D. M. (1999). It’s okay
to be skinny, if your friends are fat. In Center for
Geometric Computing 4th Annual Workshop on Com-
putational Geometry, volume 2, pages 1–8.
Mei, J.-P., Wang, Y., Chen, L., and Miao, C. (2017). Large
scale document categorization with fuzzy clustering.
IEEE Transactions on Fuzzy Systems, 25(5):1239–
1251.
Orlandic, R., Lai, Y., and Yee, W. G. (2005). Clustering
high-dimensional data using an efficient and effective
data space reduction. In Proceedings of the 14th ACM
international conference on Information and knowl-
edge management, pages 201–208. ACM.
Pal, N. R., Bezdek, J. C., and Hathaway, R. J. (1996). Se-
quential competitive learning and the fuzzy c-means
clustering algorithms. Neural Networks, 9(5):787–
796.
Pandit, S., Gupta, S., et al. (2011). A comparative study
on distance measuring approaches for clustering. In-
ternational Journal of Research in Computer Science,
2(1):29–31.
Parmar, M., Wang, D., Zhang, X., Tan, A.-H., Miao, C.,
Jiang, J., and Zhou, Y. (2019). Redpc: A residual
error-based density peak clustering algorithm. Neuro-
computing, 348:82–96.
Paukkeri, M.-S., Kivim
¨
aki, I., Tirunagari, S., Oja, E., and
Honkela, T. (2011). Effect of dimensionality reduc-
tion on different distance measures in document clus-
tering. In International Conference on Neural Infor-
mation Processing, pages 167–176. Springer.
Pedregosa, F., Varoquaux, G., Gramfort, A., Michel, V.,
Thirion, B., Grisel, O., Blondel, M., Prettenhofer,
P., Weiss, R., Dubourg, V., Vanderplas, J., Passos,
A., Cournapeau, D., Brucher, M., Perrot, M., and
Duchesnay, E. (2011). Scikit-learn: Machine learning
in Python. Journal of Machine Learning Research,
12:2825–2830.
Qaddoura, R., Al Manaseer, W., Abushariah, M. A., and Al-
shraideh, M. A. (2020a). Dental radiography segmen-
tation using expectation-maximization clustering and
grasshopper optimizer. MULTIMEDIA TOOLS AND
APPLICATIONS.
Qaddoura, R., Faris, H., and Aljarah, I. (2020b). An ef-
ficient clustering algorithm based on the k-nearest
neighbors with an indexing ratio. International Jour-
nal of Machine Learning and Cybernetics, 11(3):675–
714.
Qaddoura, R., Faris, H., Aljarah, I., and Castillo, P. A.
(2020c). Evocluster: An open-source nature-inspired
optimization clustering framework in python. In In-
ternational Conference on the Applications of Evolu-
tionary Computation (Part of EvoStar), pages 20–36.
Springer.
Santos, B. O., Valenc¸a, J., and J
´
ulio, E. (2017). Detection
of cracks on concrete surfaces by hyperspectral im-
age processing. In Automated Visual Inspection and
Machine Vision II, volume 10334, page 1033407. In-
ternational Society for Optics and Photonics.
Sfetsos, A. and Siriopoulos, C. (2004). Combinatorial time
series forecasting based on clustering algorithms and
neural networks. Neural computing & applications,
13(1):56–64.
Shirkhorshidi, A. S., Aghabozorgi, S., and Wah, T. Y.
(2015). A comparison study on similarity and dissim-
ilarity measures in clustering continuous data. PloS
one, 10(12):e0144059.
Silva, S., Suresh, R., Tao, F., Votion, J., and Cao, Y. (2017).
A multi-layer k-means approach for multi-sensor data
pattern recognition in multi-target localization. arXiv
preprint arXiv:1705.10757.
Song, W., Wang, H., Maguire, P., and Nibouche, O. (2017).
Local partial least square classifier in high dimension-
ality classification. Neurocomputing, 234:126–136.
Tolentino, J. A. and Gerardo, B. D. (2019). Enhanced
manhattan-based clustering using fuzzy c-means al-
gorithm for high dimensional datasets. International
Journal on Advanced Science Engineering Informa-
tion Technology, 9:766–771.
Trivedi, N. and Kanungo, S. (2017). Performance enhance-
ment of k-means clustering algorithm for gene ex-
pression data using entropy-based centroid selection.
In Computing, Communication and Automation (IC-
CCA), 2017 International Conference on, pages 143–
148. IEEE.
Tzortzis, G. and Likas, A. (2014). The minmax k-
means clustering algorithm. Pattern Recognition,
47(7):2505–2516.
Zhang, T., Ramakrishnan, R., and Livny, M. (1996). Birch:
An efficient data clustering method for very large
databases. In Proceedings of the 1996 ACM SIGMOD
International Conference on Management of Data,
SIGMOD ’96, page 103–114, New York, NY, USA.
Association for Computing Machinery.
NCTA 2020 - 12th International Conference on Neural Computation Theory and Applications
438
