
Weak Ties Are Surprising Everywhere
Iaakov Exman, Asaf Yosef and Omer Ganon
Software Engineering Department, The Jerusalem College of Engineering – JCE - Azrieli, Jerusalem, Israel
Keywords: Weak Ties, Surprise, Relevance, Knowledge Discovery, Social Network, Automatic Luck Generation,
Keyword Clouds, Keyword Frequencies, Semantic Distance, Topology, Target Task, Customer, Followers.
Abstract: Weak ties between people have been known as surprisingly effective to successfully achieve practical goals,
such as getting a job. However, weak ties were often assumed to correlate with topological distance in virtual
social networks. The unexpected novelty of this paper is that weak ties are surprisingly everywhere,
independently of topological distance. This is shown by modelling luck with reference to a target task, as a
composition of a surprise function expressing weak ties and a target relevance function expressing strong ties
between people. The model enables an automatic luck generation software tool, to support target tasks mainly
by the surprise function. The main result is obtained by superposing the luck model upon network topological
maps of customer relationships to its followers in any chosen social network. The result is validated by
surprise Keyword Clouds of customer followers and Keyword Frequencies for diverse followers. Results are
illustrated by a variety of graphs calculated for specific customers.
1 INTRODUCTION
Two important roles of Online Social Networks are
often treated as distinct and separate: 1- as a huge
source of virtually any discipline knowledge; 2- as an
information source on the network members.
We claim that these two network roles are dual
and mutually benefit from each other. Indeed, in a
recent paper (Exman, Ganon, Yosef, 2020), network
members were modelled by functions estimating the
potential luck for successful completion of chosen
tasks, e.g. product marketing or finding people that
help one to get a job. The functions’ input was the
discipline knowledge specific to the chosen task.
A central modelling assumption was
Granovetter’s hypotheses (Granovetter, 1973). First,
the tie strength between two individuals is directly
proportional to their friendship networks overlap.
Second, weak ties to other people may be more
significant than strong ties for certain tasks.
This paper further investigates the online social
network dual roles. Network members are
characterized both by their chosen task relevant
knowledge and by their network topology. It turns out
that weak ties are a dominant factor for potential
successful completion of chosen tasks.
1.1 Weak Ties in Online Social
Networks
Our previous work (Exman, Ganon, Yosef, 2020)
defined weak ties between any pair of persons as the
amount of semantic content mismatch between the
pair of persons, relative to a given task. We called this
semantic content mismatch the Surprise.
Analogously we also defined strong ties between
any pair of persons as the amount of semantic content
match between the pair of persons, relative to a given
task. We called this semantic content match the
Relevance.
Semantic content in both previous definitions is
characterized by keyword sets for each person,
relative to a keyword set of the chosen task context.
We emphasize that the above definitions, do not
involve any notions of geographical or topological
distances between pairs of persons. In the more
formal section 3 of this paper we refer to an idea of
semantic content distance.
1.2 Automatic Generation of Luck
Informally, our definition of the potential Luck for
successful completion of a chosen task is a
composition of the Relevance with the respective
Surprise for a given pair of persons.
218
Exman, I., Yosef, A. and Ganon, O.
Weak Ties Are Surprising Everywhere.
DOI: 10.5220/0010117202180226
In Proceedings of the 12th International Joint Conference on Knowledge Discovery, Knowledge Engineering and Knowledge Management (IC3K 2020) - Volume 1: KDIR, pages 218-226
ISBN: 978-989-758-474-9
Copyright
c
2020 by SCITEPRESS – Science and Technology Publications, Lda. All rights reserved

The intuitive idea behind this definition is that
potential Luck should certainly be relevant to the
chosen task. But Relevance alone would be totally
deterministic, and probably it would not be enough,
to realistically cover the semantic content variety of
people involved in the online social network
interactions. One also needs an element of
unexpectedness, as given by a calculated Surprise.
We were inspired by a previous definition of
Interestingness (Exman, 2009).
This positive pragmatic approach to Luck – as a
systematic effort to attain successful completion of
tasks, by possibly automatic software tools – is very
different from the derogatory notion of Luck as
obtaining undeserved results, by mere chance.
1.3 Online Social Networks Topology
In this paper, overall views of online social networks
are displayed by network topological maps – i.e.
graphs with indirect, unweighted edges – standing for
any possible kind of interaction among members of
the social network, where vertices represent network
members. Network topological maps are presented in
the results Section 4.
1.4 Paper Organization
The remaining of this paper is organized as follows.
We concisely review Related Work in section 2. Luck
modelling by Surprise and Relevance, is more
formally defined in section 3. The central novelty of
the paper, viz. that weak ties are ubiquitous and the
most significant factor to generate Luck, is presented
in section 4. The design and implementation of the
Luck’o’mation software tool appears in section 5.
The Luck model is validated in section 6. We
conclude the paper with a discussion in section 7.
2 RELATED WORK
This section concisely reviews the scientific literature
on Luck, ties strength and social networks’ topology.
2.1 Systematic Luck
As already stated, our positive pragmatic view of
Luck is very different from the negative stereotype of
undeserved resources acquisition by mere chance.
The book by the late Clayton Christensen and co-
authors (Christensen et al., 2016) entitled
“Competing against Luck” is an extended example of
the negative meaning of Luck. It promotes causality
in contrast to random hit-and-miss development of
new products.
Liechti (Liechti et al., 2012) defines luck with
some similarity to our “surprise”. It is a sum of three
terms standing for an unexpected performance:
actual deviation from expected performance;
an overconfidence bias;
a look back bias (the expectation at a certain
time t minus that at a previous time).
Dowding (Dowding, 2003, 2008) focuses on
moral aspects of luck. His proposed luck measure
expresses a relationship between expected value of
outcome (EV) and an actual outcome (AV):
Luck AV EV
(1)
In a series of measurements, one expects AV to
approach EV.
2.2 Social Networks’ Ties Strength
Granovetter (Granovetter, 1973, 1983) proposed
Weak Ties as a significant notion in social networks.
He also pioneered the application of his theory
(Granovetter, 1995) in the context of “Getting a Job”.
Various studies of weak ties in social networks
supported the theory – such as (Brown, Konrad,
2001), (DeMeo et al., 2014). The book by Ferguson
(Ferguson, 2018) analyses networks in general from
an historical point of view. Its Chapter 6 explicitly
deals with weak ties. Other authors extended the
theory to different applications, – such as (Baer,
2010), (Centola, 2007) – or provided general
appraisals e.g. (Sinan, 2016).
On the other hand, there were researchers that
emphasized the importance of strong ties – such as
(Gee et al., 2017) and (Krackhardt, 2003).
Measurement of tie strength is dealt with in the paper
by (Marsden, Campbell, 1984).
Within the “Getting a Job” context, besides
Granovetter, we can mention (Gee et al., 2017) and
the paper by Tassier on “Labor Market implications
of Weak Ties” (Tassier, 2006).
2.3 Related Social Networks’ Topology
There are three kinds of information available about
online social networks:
a) Specific Grouping of Edges – e.g. triples of
vertices as opposed to transitive triangles.
b) Topological Distance Characterization –in
terms of discrete edge numbers between
vertices;
Weak Ties Are Surprising Everywhere
219

c) Functional Distance Characterization – as
a continuous function, e.g. exponential;
(Mattie et al., 2018) discusses a particular
grouping of edges, which they call “bow tie”, and
infer their tie strength.
(Tassier, 2006) as an example of the functional
distance characterization, states that weak ties in
social networks grow with distance exponentially
faster than strong ties.
3 LUCK GENERATION FROM
WEAK TIES
In this section – whose definitions are partly based
upon our previous paper (Exman, Ganon, Yosef,
2020) – we formalize the concepts of Luck, and its
two components Relevance and Surprise. Then the
respective formulas of match and mismatch are
inserted into the Relevance and Surprise, to enable
actual calculation of numerical values.
3.1 The Luck Model: Strong Ties
Relevance & Weak Ties Surprise
We start by making an assumption, based on (Tassier
2006) “functional distance characterization”. Our
liberal interpretation – justified by the results
obtained in the next section 4 and validated in the
Luck Model Validation in section 6 – is that the
functional distance is applicable to semantic distance:
Complementary Exponential Decay of Ties –
strong ties decay exponentially with semantic
distance, while weak ties increase
exponentially.
Given this “Complementary Exponential decay”
assumption, Relevance and Surprise are exponential
functions, with complementary signs.
Moreover, by the considerations in sub-section
1.1, the semantic content of Relevance is given by a
match function, while the semantic content of
Surprise is given by a mismatch function. Thus:
Re exp( )levance Match
(2)
exp( )Surprise Mismatch Match
(3)
Since Luck is a composition of Relevance and
Surprise, we finally get:
Luck =
exp( ) exp( )
M
atch Mismatch Match
(4)
The “plus” operator is the suitable composition of
Relevance and Surprise. A “multiplier” operator is
unsuitable, as it would cause undesirable exponents
addition, and Match cancellation.
In practice, one still needs to normalize the
expressions of Match and Mismatch (see the next
sub-section), to eliminate dependence on set sizes.
3.2 Keyword Sets: Match & Mismatch
We begin by defining some necessary concepts.
Context is a keyword set defining a task, e.g. “find
a job as a knowledge engineer”.
Next the two online social network member roles,
for the same social network, are defined, with their
respective notations:
Customer = C – is a person demanding the
performance of the Context task; (also its
keyword set);
Follower = F – a Customer follower in the
social network sense; (also its keyword set);
F can be a Follower of a Follower, etc. to
any network topological distance from the
Customer.
The Context keyword set is fixed before any
computation. The keyword sets of the Customer and
of each Follower are sub-sets of the Context. These
are extracted from Social Network member pages,
and subsequent calculation of their intersections with
the Context keyword set.
Match and Mismatch are keyword set operations
obtaining respectively the Relevance and Surprise
functions, by comparing Customer C keyword sets
with a Follower F keyword set.
Match calculates a similarity measure of the input
sets, i.e. the number of keywords appearing in the
intersection
of these sets:
M
atch C F
(5)
Mismatch calculates the sets’ dissimilarity, viz.
the numerical symmetric difference
between C
and F. It is the union
of the relative complements
of these sets:
()()
M
ismatch C F C F F C
(6)
KDIR 2020 - 12th International Conference on Knowledge Discovery and Information Retrieval
220

Fig.1 shows a schematic Match and Mismatch
diagram.
Figure 1: Schematic Match and Mismatch diagram – C
stands for the Customer keyword set (light blue). F is the
Follower keyword set (gray). Match is the intersection F
C. Mismatch is the union between the relative complements
C-F and F-C. (All figures are in color online).
4 WEAK TIES SURPRISE
EVERYWHERE
This central section of this paper shows the novel
significant results of this work.
As a preview, here are the results:
Weak Ties – represented by the Surprise
function – have a much more significant
contribution than Relevance, to the
numerical values of the calculated
potential Luck;
Surprise – is ubiquitous, i.e. it appears
everywhere throughout the network,
independently of the topological
distance.
So, this is a double surprise: the overwhelming
importance of weak ties and its ubiquity.
4.1 Luck vs Surprise
In this sub-section one can see the first computation
result of this paper. The social network was chosen
according to an available API. The computation
refers to the Context task “find a job as Software
Engineer”.
The Context Keyword Set used in the
computations is seen in the next text-box.
Match and Mismatch functions normalization in
equation (4) was done as follows: dividing the non-
normalized outcome by a sum of the Context and
Costumer keyword sets intersection, with the Context
and each Follower keyword sets intersection.
Fig. 2 shows a plot of Luck against Surprise for
the data-set of a certain Customer JS.
Figure 2: Plot of Luck vs. Surprise for Customer JS – The
dots (in orange colour) are computation results for this data
set. The trend-line is a very good polynomial fitting.
The plot in Fig. 2 displays the following features:
Surprise, for Weak Ties, definitely increases
when Luck increases (right-hand side of
plot);
Relevance, for Strong Ties, moderately
increases, causing a smaller Luck increase
(left-hand-side of the plot).
The graph asymmetry is very clear.
This plot is important since the same functional
behaviour has been repeatedly found for all plots of
this kind for a variety of different customers – see e.g.
fig. 4 in our previous paper (Exman, Ganon, Yosef,
2020).
4.2 Online Social Networks Topology
Maps
In this paper, online social networks topology is
represented by “maps” – which mathematically are
graphs with indirect, unweighted edges, between
vertices. The vertices stand for members of the social
Software, engineering, developer, DevOps, computers,
algorithm, TechOps, python, programmer, java, ‘computer
science’, ‘data science’, ‘data analyse’, C++, web,
framework, embedded, ‘alpha version’, API, api, app,
application, beta, version, bios, QA, automation, agile,
scrum, demo, development, device, emulator, freeware,
‘open source’, interface, ‘operating systems’, workflow
‘machine learning’, ‘deep learning’, startup,
innovation,
internet, IoT, VR, code, coding.
Weak Ties Are Surprising Everywhere
221

network, and the edges represent any possible kind of
interaction among members of the social network.
Features that may be perceived in the network
topological maps, are small clusters of the immediate
followers, or more distant, followers of followers for
any given members in the same network. Thus, one
can naturally have an idea of the proximity levels of
network members in the map.
In order to display and understand the results
obtained in this paper, we do not consider necessary
to focus on more specific structures within the
network topology map, such as vertex triples or bow-
ties as mentioned in the Related Work sub-section
2.3.
4.3 Surprise Is Everywhere in Network
Topology Maps
A partial overall view of an online social network
topology map centred on another customer LM is
seen in Fig. 3. The view is partial, in the sense that it
was limited by the number of follower levels (up to 8
levels) of the given customer.
Vertices were shown coded by three colours:
Green – the Customer;
Purple – Customer followers, whose
Surprise value is above a certain
threshold;
Blue – any other social network
members.
One perceives 1
st
level followers’ clusters in
several areas of the social network topology map.
The central result shown here is:
Customer followers with a high Surprise
value are everywhere in this network
topological map: Surprise is independent of
topological distance from the customer.
This result was consistently obtained for many
different Customers, not necessarily semantically or
topologically related, and whose followers do not
significantly overlap network followers of the other
Customers. We purposefully selected independent
Customers to demonstrate the obtained result.
Figure 3: Surprise Social Network Topology Sample Map
for Customer LM – The customer (in green) is seen in the
lowest cluster. Customer Followers with high-value
Surprise (in purple) are seen everywhere, i.e. in an
overwhelming number of clusters in the network topology
map.
5 LUCK’O’MATION DESIGN
AND IMPLEMENTATION
Luck’o’mation is a software tool designed and
implemented to run calculations of potential Luck,
Surprise and Relevance, in order to test and validate
the model proposed in this work.
It is an improved functionality and more efficient
version of the software tool described and used for
our previous work (Exman, Ganon, Yosef, 2020).
5.1 Software Design
The Luck’o’mation Sofware tool has well-designed
modules with independent roles:
1. Front-End – for text and graph input/output;
2. Command – for efficient running of common
options;
3. APIs – for interaction with any chosen social
networks;
4. Local Storage – avoiding repeated network
access, and an Inquirer to retrieve stored data;
5. Calculators – of Tie Strength and Luck.
The Luck’o’mation software architecture is seen in
Fig. 4.
KDIR 2020 - 12th International Conference on Knowledge Discovery and Information Retrieval
222
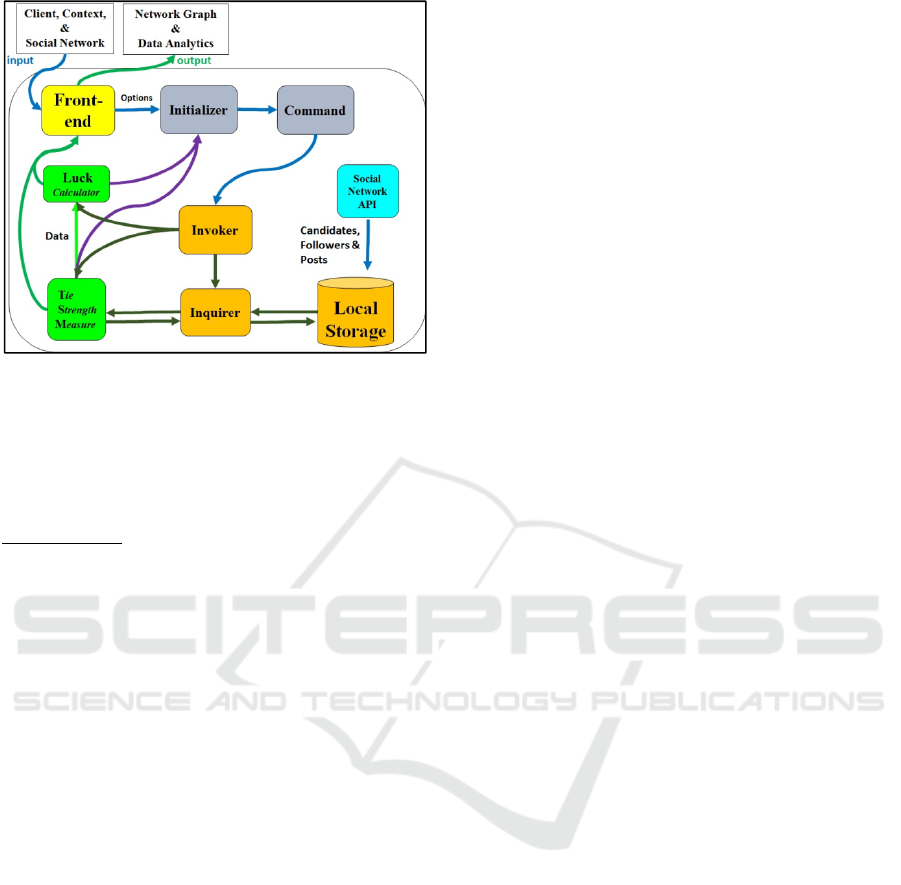
Figure 4: Luck’o’mation Software Architecture – The five
independent modules are marked by different colors: 1-
Front-End (yellow); 2- Command (purple); 3- APIs (blue);
4- Local Storage (orange); 5- Calculators (green).
5.2 Software Implementation
Luck’o’mation is programmed in the Python
language. A user interacts with the software tool by
means of a CLI (Command Line Interface) to run
different simulations and scripts to analyse data.
Upon execution, the software builds a network
map (unweighted, undirected graph) based on the
data available from the input and store it in the RAM
for data manipulation and visualization.
Libraries used in the software include:
Network API – used to collect data from
the social network;
Networkx – used to create graphs and
analyse them;
Matplotlip – used to visualize graphs;
Click, PyInquirer – used to create the CLI
for any user to be able to run simulations
and data analytics easily.
The database used is Sqlite to store the data
collected from the social network, such as posts,
network members and their connections among other
information.
6 LUCK MODEL VALIDATION
Many facets of this work can serve to validate it. In
this section we present three approaches:
a) agreement with previously published
research;
b) self-consistency of semantic content viewed
through keyword clouds;
c) randomized dilution of followers’ numbers
per customer.
6.1 Independence of Topological
Distance
The Luck model is based upon certain assumptions,
most important among them the Complementary
Exponential decay of weak and strong ties. These
assumptions of the model can be validated by
comparison of model consequences with previous
research.
An unexpected and important result of this work
is the ubiquitous and prominent availability of
Surprise, independently of network topological
distance.
The independence of network topological
distance is confirmed by results obtained by different
methods, e.g. in a paper by (Bhattacharyya, Garg, Wu
2011).
6.2 Self-Consistent Semantic Content
in Word Clouds
Self-Consistency of Results means to obtain similar
outcomes for very different Customers, Followers
and Semantic Content in online social networks.
Semantic content is here calculated as follows.
For each chosen customer in the social network, and
for all its followers in our dataset, calculate surprise
values, extracting the most frequent keywords
contributing to the customer’s surprise.
The most frequent keywords are visualized in a
Keyword Cloud, with letter sizes proportional to
keyword frequencies in the customer followers.
The conclusion of interest is that most of the high-
frequency words are common to all followers of these
customers. These are clearly observed to be: api,
version, demo, application, innovation, internet.
Therefore, the calculated surprise for all these
customers is not just the result of random disjoint
(not-intersecting) sets of keywords. It shows self-
consistent semantic content, which explains the utility
of the calculated surprise to generate luck (success)
for the chosen task.
Keyword Clouds are shown in Fig. 5, for four
different customers and totally independent
followers. The similar keyword clouds of the
customers (CD, MM, SC), can be explained by
network topology paths, linked at a given topological
distance, enabling surprising keywords exchange.
Especially interesting is the isolated LM customer,
Weak Ties Are Surprising Everywhere
223
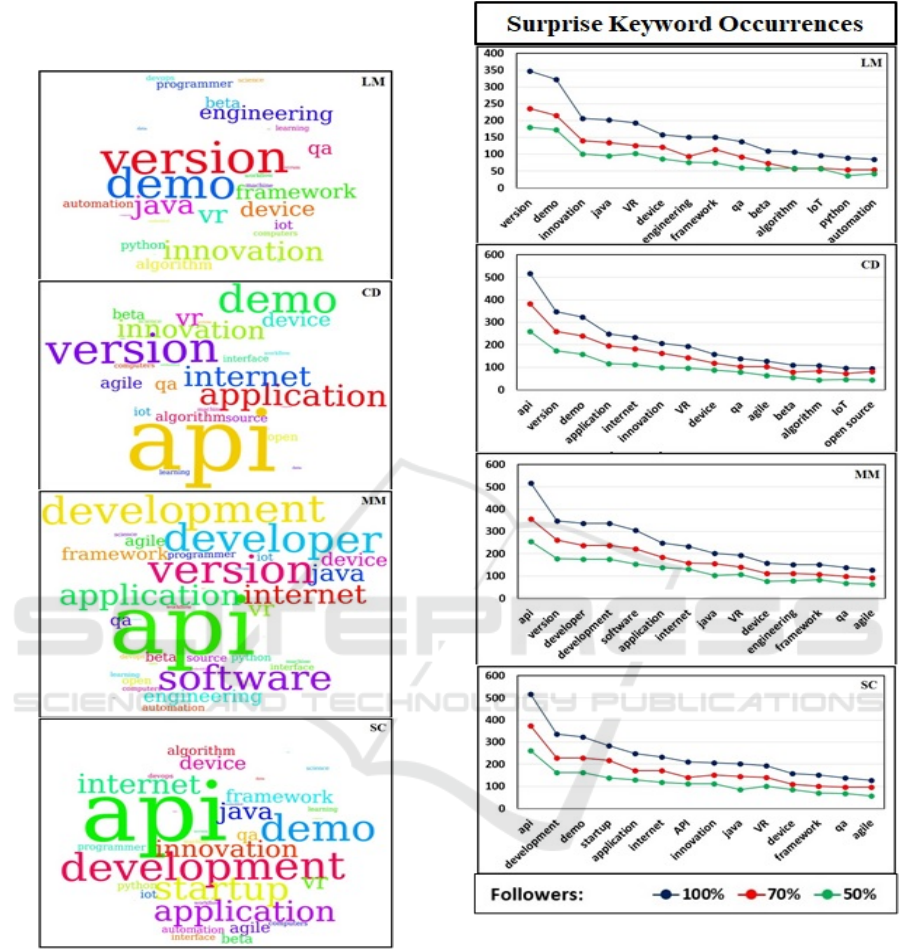
with common prominent keywords, despite different
followers and less linked paths.
Figure 5: Keyword Clouds of followers of four Customers
– Keywords’ letter sizes are proportional to the occurrence
frequency of each word in the calculated “surprise” for all
followers of each customer. The customer name initials are
seen in the upper-right corner of each cloud.
6.3 Randomized Dilution of Followers’
Number
The hypothesis for this validation approach is as
follows. If surprise is really everywhere in the
topological network, it should be independent of the
specific choice of followers of any given customer.
Figure 6: Randomized Dilution of the followers’ number
for each of the four Customers – No dilution, 100% (blue
data) fits the Keyword Clouds in Fig. 5. Diluted data are
obtained by randomized followers’ shuffling, taking the
upper 70% (red data) and upper 50% (green data) of the
respective surprise keywords for each customer.
Thus, if one performs randomized dilution of the
followers of a customer, the relative frequency
functional behaviour of the followers’ surprise
keywords should remain virtually unchanged.
The dilution experiment was performed for the
same four customers shown in Fig. 5. The followers
of each customer were randomly shuffled according
KDIR 2020 - 12th International Conference on Knowledge Discovery and Information Retrieval
224

to a uniform distribution. Then, certain percentages of
the upper followers in the list (70% and 50% in Fig.
6) were selected and their surprise keyword
occurrences were calculated.
Results, seen in the graphs of Fig. 6, show that
the relative surprise keyword frequencies, for each
customer, preserve the same overall functional
behaviour, independently of dilution, corroborating
the hypothesis.
7 DISCUSSION
This discussion focuses on the appraisal of the main
results obtained, viz. the significance and ubiquity of
Surprise in the online social network. It is concluded
by future work to be done, and main contribution.
7.1 The Weak Ties Topology Surprise
The unexpectedness of the prominence of Weak Ties
is a consequence of widely held, but misleading
perceptions. We mention three of these perceptions:
The very name of “Weak” ties, suggests less
influence than Strong ties, in contrast to
Granovetter’s hypotheses;
the apparent balance between Weak and
Strong ties as pointed out by a non-
negligible number of authors;
an initial conjecture of symmetric
exponential decay of Relevance and
Surprise.
But computed results from empirical data
extracted from actual online social networks, in
sections 4 and 6, clearly show the greater importance
and everywhere availability of weak ties.
7.2 Future Work
Future work to be done within this project, include the
following issues:
a. Extensive Data Analysis – since the datasets
accumulated in this work until now are very
large, compared to datasets of previously
published research by other authors, we still
need to invest time in a dedicated analysis;
b. Diverse Social Networks and Datasets – in
order to test the generality and robustness of
the assumptions, one needs to use it with a
few different social networks and additional
datasets, to compare their behaviours and
results;
c. Model Variations – we have used a bag-of-
words modelling approach. We should test
our hypotheses with word embedding
approaches.
7.3 Main Contribution
The main contribution of this work is the ubiquity and
importance of Surprise – standing for online social
network weak ties – as a component of systematic
generation of potential Luck towards successful
completion of chosen tasks.
REFERENCES
Adaval, R. 2006. “Culture and Cognition: the Case of
Irrational Beliefs about Luck”, Advances in Consumer
Research, Vol. 33, pp. 623-628.
Baer, M, 2010. “The Strength-of-Weak-Ties Perspective on
Creativity: A Comprehensive Examination and
Extension”, J.App.Psychology, 95, pp-592-601.
Bertrand, M. and Mullainathan, S., 2001. “Are CEOs
Rewarded for Luck? The Ones with Principals are”,
The Quarterly Journal of Economics, Vol. 116, pp. 901-
932. http://www.jstor.org/stable/2696421
Bhattacharyya, P., Garg, A. and Wu, S. F. 2011. “Analysis
of user keyword similarity in online social networks”,
Soc. Netw. Anal. Min., pp. 143-158, DOI:
https://doi.org/10.1007/s13278-010-0006-4
Brown, D. W. and Konrad, A. M., 2001. “Granovetter Was
Right: The Importance of Weak Ties to a Contemporary
Job Search”, Group & Organization Management, 26,
434-462.
Centola, D., 2007. “Complex Contagions and the Weakness
of Long Ties”, Am.J.Sociology, 113, pp. 702-734. DOI:
https://doi.org/10.1086/521848
Christensen, C. M., Hall, T., Dillon, K. and Duncan, D. S.,
2016. Competing Against Luck – The Story of
Innovation and Customer Choice, Harper Business,
New York, NY, USA.
DeMeo, P., Ferrara, E., Giumara, G. and Provetti, A.,
2014. “On Facebook, Most Ties are Weak”, Comm.
ACM, 157, pp. 78-84 https://doi.org/10.1145/2629438;
See also: arXiv:1203.0535, 2012.
Dowding, K., 2003. “Resources, Power and Systematic
Luck: A Response to Barry”, Politics, Philosophy &
Economics, pp. 305-322. DOI:
https://doi.org/10.1177/1470594X030023002
Dowding, K., 2008. “Luck and Responsibility”, in M.
Matravers and L. Meyer, (eds.) Democracy, Equality
and Justice, Routledge, London, UK.
Exman, I., 2009. “Interestingness – A Unifying Paradigm –
Bipolar Function Composition”, in Proc. KDIR Int.
Conf. on Knowledge Discovery and Information
Retrieval, pp. 196-201, DOI:
https://doi.org/10.5220/0002308401960201
Weak Ties Are Surprising Everywhere
225

Exman, I., Ganon, O. and Yosef, A. 2020. “Generating
Luck from Weak Ties in Social Networks” in Proc.
SEKE’2020, Int. Conf. on Software Engineering and
Knowledge Engineering, pp. 467-472,
DOI: https://doi.org/10.18293/SEKE2020-156
Ferguson, N., 2018. The Square and the Tower – Networks,
Hierarchies and the Struggle for Global Power”,
Penguin Books, UK.
Gee, L. K. , Jones, J. and Burke, M., 2017. “Social
Networks and Labor Markets: How Strong Ties Relate
to Job Finding On Facebook’s Social Network”,
J.Labor Economics, 35, pp. 485-518. DOI:
https://doi.org/10.1086/686225
Granovetter, M. S., 1973. “The Strength of Weak Ties”,
Am.J.Sociology, 78, pp. 1360-1380.
Granovetter, M. S., 1983. “The Strength of Weak Ties: A
Network Theory Revisited”, Sociological Theory, 1,
pp. 201-233.
Granovetter, M. S., 1995. Getting a Job: A Study of
Contacts and Careers, 2
nd
ed. University of Chicago
Press, Chicago , IL, USA.
Krackhardt, D., 2003. “The Strength of Strong Ties: The
Importance of Philos in Organizations”, in Networks in
the Knowledge Economy, Oxford Univ. Press.
Liechti, D., Loderer, C. and Peyer, U., 2012 “Luck and
Entrepreneurial Success”, Political Science,
Psychology, Economics. DOI:10.2139/ssrn.1954560
Marsden, P.V. and Campbell, K.E., 1984. “Measuring Tie
Strength”, Ann. Meeting Am. Sociological Assoc., pp.
482-499.
Mattie, H., Engo-Monsen, K., Ling, R. and Onnela, J-K.
2018. “Understanding tie strength in social networks
using a local ‘bow tie’ framework”, Scientific Reports,
8:9349, DOI: 10.1038/s41598-018-27290-8.
Sinan, A., 2016. “The Future of Weak Ties”,
Am.J.Sociology, 121. pp. 1931-1939. DOI:
http://dx.doi.org/10.1086/686293
Tassier, T., 2006. “Labor Market Implications of Weak
Ties”, Southern Econ. J., 72, pp. 704-719. DOI:
10.2307/20111842.
KDIR 2020 - 12th International Conference on Knowledge Discovery and Information Retrieval
226
