
A Curious Case of Meme Detection: An Investigative Study
Chhavi Sharma and Viswanath Pulabaigari
Department of Computer Science Engineering, Indian Institute of Information Technology, Sri City, India
Keywords:
Meme, Dataset, Multi-modality.
Abstract:
In recent times internet ”memes” have led the social media-based communications from the front. Specifi-
cally, the more viral memes tend to be, higher is the likelihood of them leading to a social movement, that has
significant polarizing potential. Online hate-speeches are typically studied from a textual perspective, whereas
memes being a combination of images and texts have been a very recent challenge that is beginning to be
acknowledged. Our paper primarily focuses on the meme vs. non-meme classification, to address the crucial
primary step towards studying memes. To characterize a meme, metric based empirical analysis is performed,
and a system is built for classifying images as meme/non-meme using visual and textual features. An exhaus-
tive set of experimentation to evaluate conventional image processing techniques towards extracting low-level
descriptors from an image is performed, which suggests the effectiveness of Haar wavelet transform based
feature extraction. Further study establishes the importance of both graphic and linguistic content within a
meme, towards their characterization and detection. Along-with the deduction of an optimal F-1 score for
meme/non-meme classification, we also highlight the efficiency induced by our proposed approach, in com-
parison with other popular techniques. The insights gained in understanding the nature of memes through
our systematic approach, could possibly help detect memes and flag the ones that are potentially disruptive in
nature.
1 INTRODUCTION
Until few years ago, the most prevalent form of in-
formation exchange over the social media used to be
either descriptive textual content or separate visual
content, along-with additional necessary contextual
information. Such communications were typically
used to convey some indicative opinions about var-
ious societal, political or even generic aspects. In-
fact, the interaction induced by such information ex-
change could often be attributed to some form of so-
cial movements that keep stirring from time to time.
A majority section of the millennials including normy
teenagers and young adults have in the recent times
started to indulge in what has now become and pop-
ularly called as meme culture. Meme, one of the
popular English words [(Sonnad, 2018)], originated
from a Greek word m
¯
im ¯ema which means “imitated
thing”. Often it is of satirical nature, which is encoded
in the meme content using either graphic content, or
textual messages, or even both. A lot of memes are
designed to imply sarcasm, using an effective combi-
nation of image and text. Sometimes such commu-
nication entails direct or indirect association with the
particular culture or community. Identification of a
meme and the extent to which their diffusion may oc-
cur, is crucial for the regulatory authorities from the
government and social media organizations. Hence,
there are sufficient reasons to believe in the impor-
tance of addressing the problem of meme identifica-
tion, from a research point of view, within the domain
of computational social sciences. This paper attempts
to address the inherent challenges towards detecting
a meme, and presents certain approaches that are ob-
served to be helpful towards establishing the distin-
guishing framework for the required task.
The last decade has seen significant research
works dealing with the multimodal data, with prob-
lems ranging from scene description (Chen et al.,
2015), (Krishna et al., 2016), (Young et al., 2014),
(Gurari et al., 2020), (Sidorov et al., 2020) to vi-
sual question answering systems (Wang and Liu,
2017), (Hudson and Manning, 2019), (Singh et al.,
2019).
Besides being challenging in nature, multi-modal
tasks are inherently interesting as well, due to the fact
that they are mostly rooted within the natural phe-
nomena like the cognitive mechanism of human be-
ings that leverages vastly disparate sources of infor-
mation, towards building perception and understand-
Sharma, C. and Pulabaigari, V.
A Curious Case of Meme Detection: An Investigative Study.
DOI: 10.5220/0010110203270338
In Proceedings of the 16th International Conference on Web Information Systems and Technologies (WEBIST 2020), pages 327-338
ISBN: 978-989-758-478-7
Copyright
c
2020 by SCITEPRESS – Science and Technology Publications, Lda. All rights reserved
327
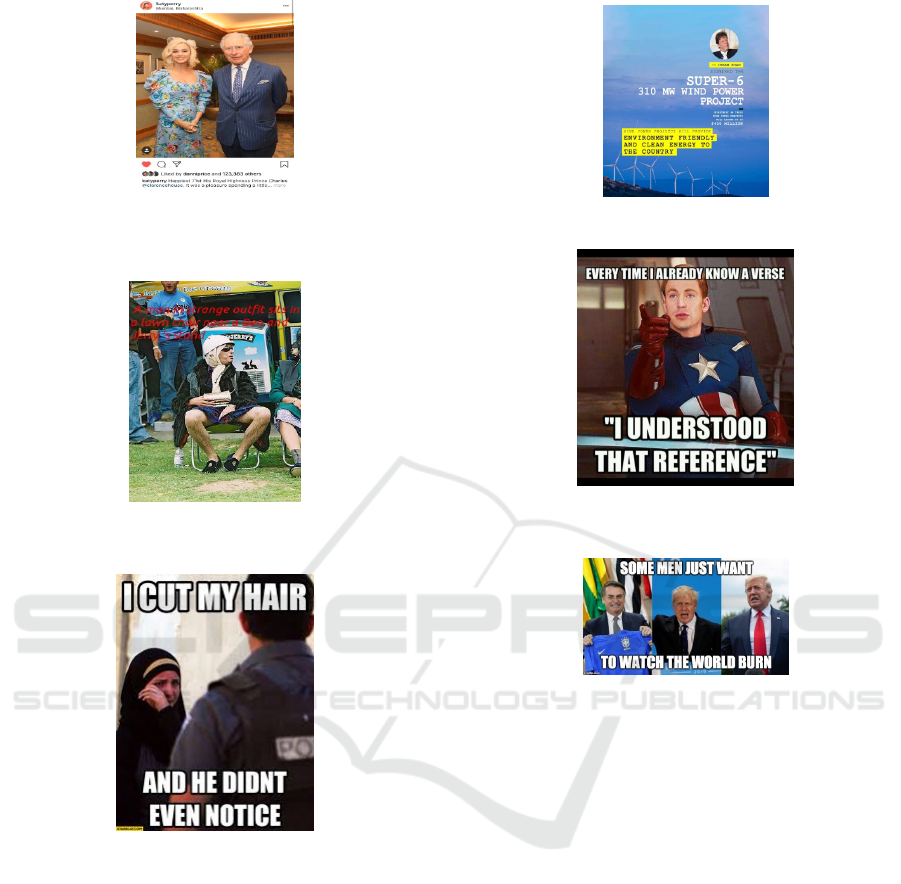
Figure 1: President putin with a girl,Category of image
where text is in the lower half of the image (Type-1 A Non-
Meme).
Figure 3: A Flickr8k dataset image, where caption is im-
posed on an image (Type3 Non Meme).
Figure 5: An offensive Meme on woman dressed in Hijab.
It is difficult to label this as offensive until one makes the
correlation between the biased emotion towards a particular
religion (A Meme).
ing the world around them. As for the web content,
multi-modality exists as the very core of the informa-
tion exchange that connects people across the geogra-
phies. Many practitioners believe that multi-modality
holds the key to problems as varied as natural lan-
guage understanding (Xuelin et al., 2019), computer
vision evaluation (Geman et al., 2015), and embodied
AI (Savva et al., 2019). Multi-modal content makes
the automatic detection of memes both challenging
and relevant in the present day scenario, where it’s
volume on social media is rapidly increasing.
To acknowledge the overall complexity involved
in the identification of memes from non-memes, few
Figure 2: Poster on wind project (Type2 Non- Meme).
Figure 4: A image from Movie ”captain America” where it
shows anger.(A Meme).
Figure 6: A image depicting a sarcastic and funny comment
on the three famous personality (A Meme).
samples are depicted in Fig. 4, 5 and 6. Memes can
be contrasted with non-memes (normal images) hav-
ing some embedded text as shown in Fig. 1, 2 and 3,
where some inherent direct association between the
visual cues and the textual information can be estab-
lished. Therefore, Memes need to be analyzed and
processed as per the requirement by leveraging differ-
ent modalities it has to offer, to infer insights about
the actual message intended. Few researchers have
tried to automate the meme generation process (Peir-
son et al., 2018), while others have tried to extract
their inherent sentiment (French, 2017) in the recent
past. Some other work on use of multi-modal data
over social media channels include (Wang and Liu,
2017). To overcome the problem of missing modal-
ity i.e. absence of the crucial multi-modal data (Bal-
trusaitis et al., 2017), authors of (Fortin and Chaib-
draa, 2019) have provided the solution by developing
multi-modal multitask emotion recognition.
The paper is organised as follows. The data set
collected and used for this study is described in Sec-
tion 2. Section 3 shows how image processing tech-
WEBIST 2020 - 16th International Conference on Web Information Systems and Technologies
328
niques and deep learning techniques perform while
considering image as input in classifying image as
meme or non-meme. A new method is proposed in
Section 3.4 which detects memes. Section 3.5 tells
about the basic system developed for detecting image
on twitter data while Section 3.5.1 tells why the de-
veloped system is not efficient towards classifying a
meme. Section 4 presents the empirical analysis con-
ducted towards characterization of Memes in contrast
with the Non-meme content. Our proposed approach
towards the main task of Meme/non-meme classifica-
tion considering both image and text is described in
detail in Section 5. The results are reported as part
of Section 6. Finally, we summarise our work by
highlighting the insights derived along-with the fur-
ther scope and open ended pointers in Section 7 and
8.
2 DATA-SET
The meme data-set is created by downloading pub-
licly available images of different categories, such
as Trump, Modi, Hillary, animated characters, etc
using third-party tools and packages like Tweepy
and Fatkun image batch downloader. Additionally,
flickr8k (Thomee et al., 2015) data-set is also utilised
towards creating the required data-set. To avoid
class imbalance problems, balanced category-wise
data distribution is ensured. No. of samples per cate-
gory are shown in the Table 1. In this section, we de-
scribe preprocessing and annotation steps performed
towards meme classification task.
Table 1: Data Distribution: Shows a distribution of web im-
ages in data-set used for this study where Non-Meme Type
1, Type 2 and Type 3 refers to Figure 1, 2 and 3 respectively.
Category # samples
Meme 7,000
Non-Meme (Type1) 2,250
Non-Meme (Type2) 2,250
Non-Meme (Type3) 2,500
Total 14,000
2.1 Preprocessing
The images having been collected from disparate
sources, are of various types such as only graphic con-
tent or even images with embedded text from differ-
ent languages other than english. Whereas, a majority
of the images collected from google and twitter are
found to have memes with both image and text con-
tent. Thus to maintain the consistency of the data-set
towards establishing a baseline setup, we have prepro-
cessed the data with the following constraints:
• Creation of a part of non-meme data by embed-
ding the text provided corresponding to the given
images from Flickr8k(Thomee et al., 2015) data-
set. This renders the content which is similar to a
meme in terms of composition, but created with-
out any intention of disseminating it online as in
case with memes, hence forms a contrastive sam-
ple.
• All the images were resized to 224X224.
• Consideration of only those images which have
embedded text strictly in english language.
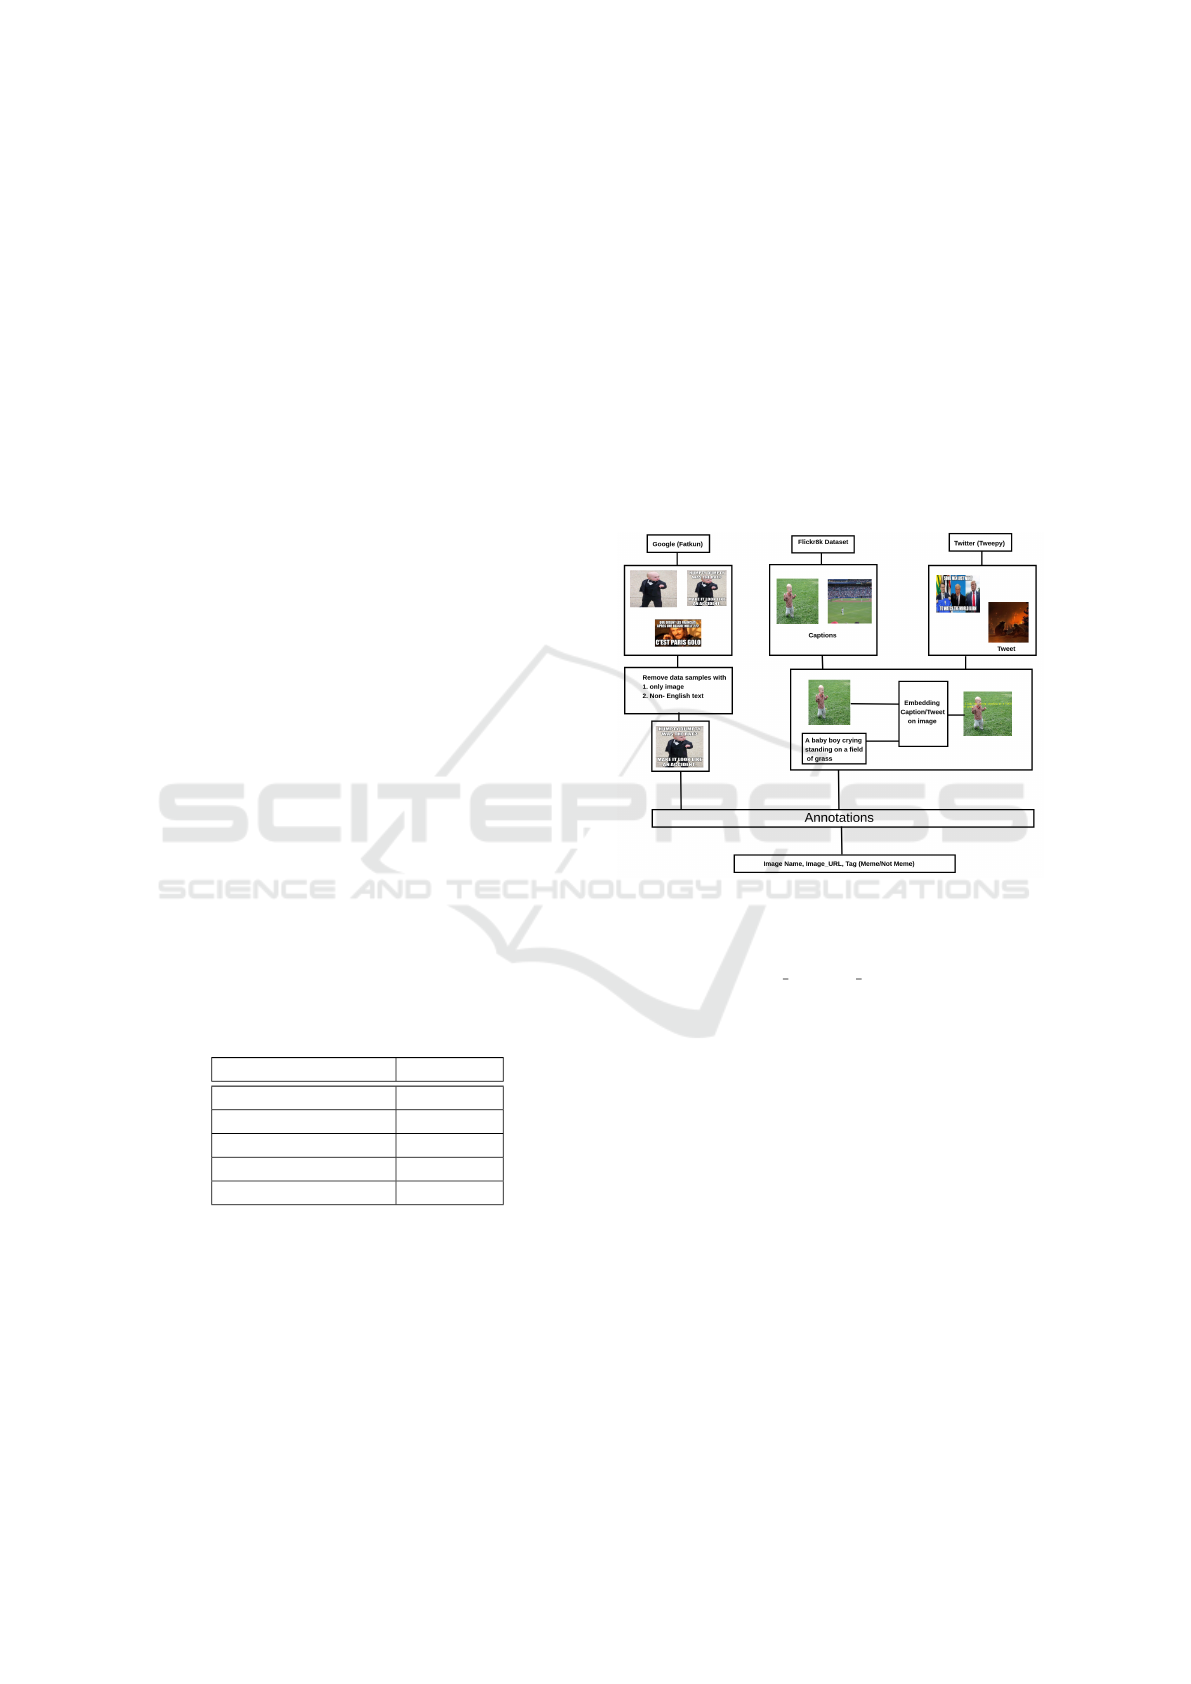
Figure 7: This shows the process of data-set creation where
data samples are collected from 3 sources and pre-processed
according to the defined rules. Further the images were
given to AMT workers for annotation that resulted in data-
set that contains image id, image URL and Tag.
2.2 Annotations
For getting the data-set annotated, we rely on people
to perform manual checks for every picture present in
our data-set. This is accomplished by utilizing anno-
tations provided by the workers on Amazon Mechani-
cal Turk (AMT), an online platform on which one can
set up undertakings for workers to complete the anno-
tation tasks and get paid for it. AMT is actively used
by researchers, for eg. for getting vision related data-
sets annotations (Sorokin and Forsyth, 2008). With a
global client base, AMT is especially appropriate for
huge scale data labeling.
As part of the annotation process, the work-
ers are requested to provide annotation only if the
background context of the image (meme) content is
known. Crucial requirement for the background in-
formation is demonstrated in comprehending the in-
formation from memes shown in Fig. 4 and 5.
A Curious Case of Meme Detection: An Investigative Study
329
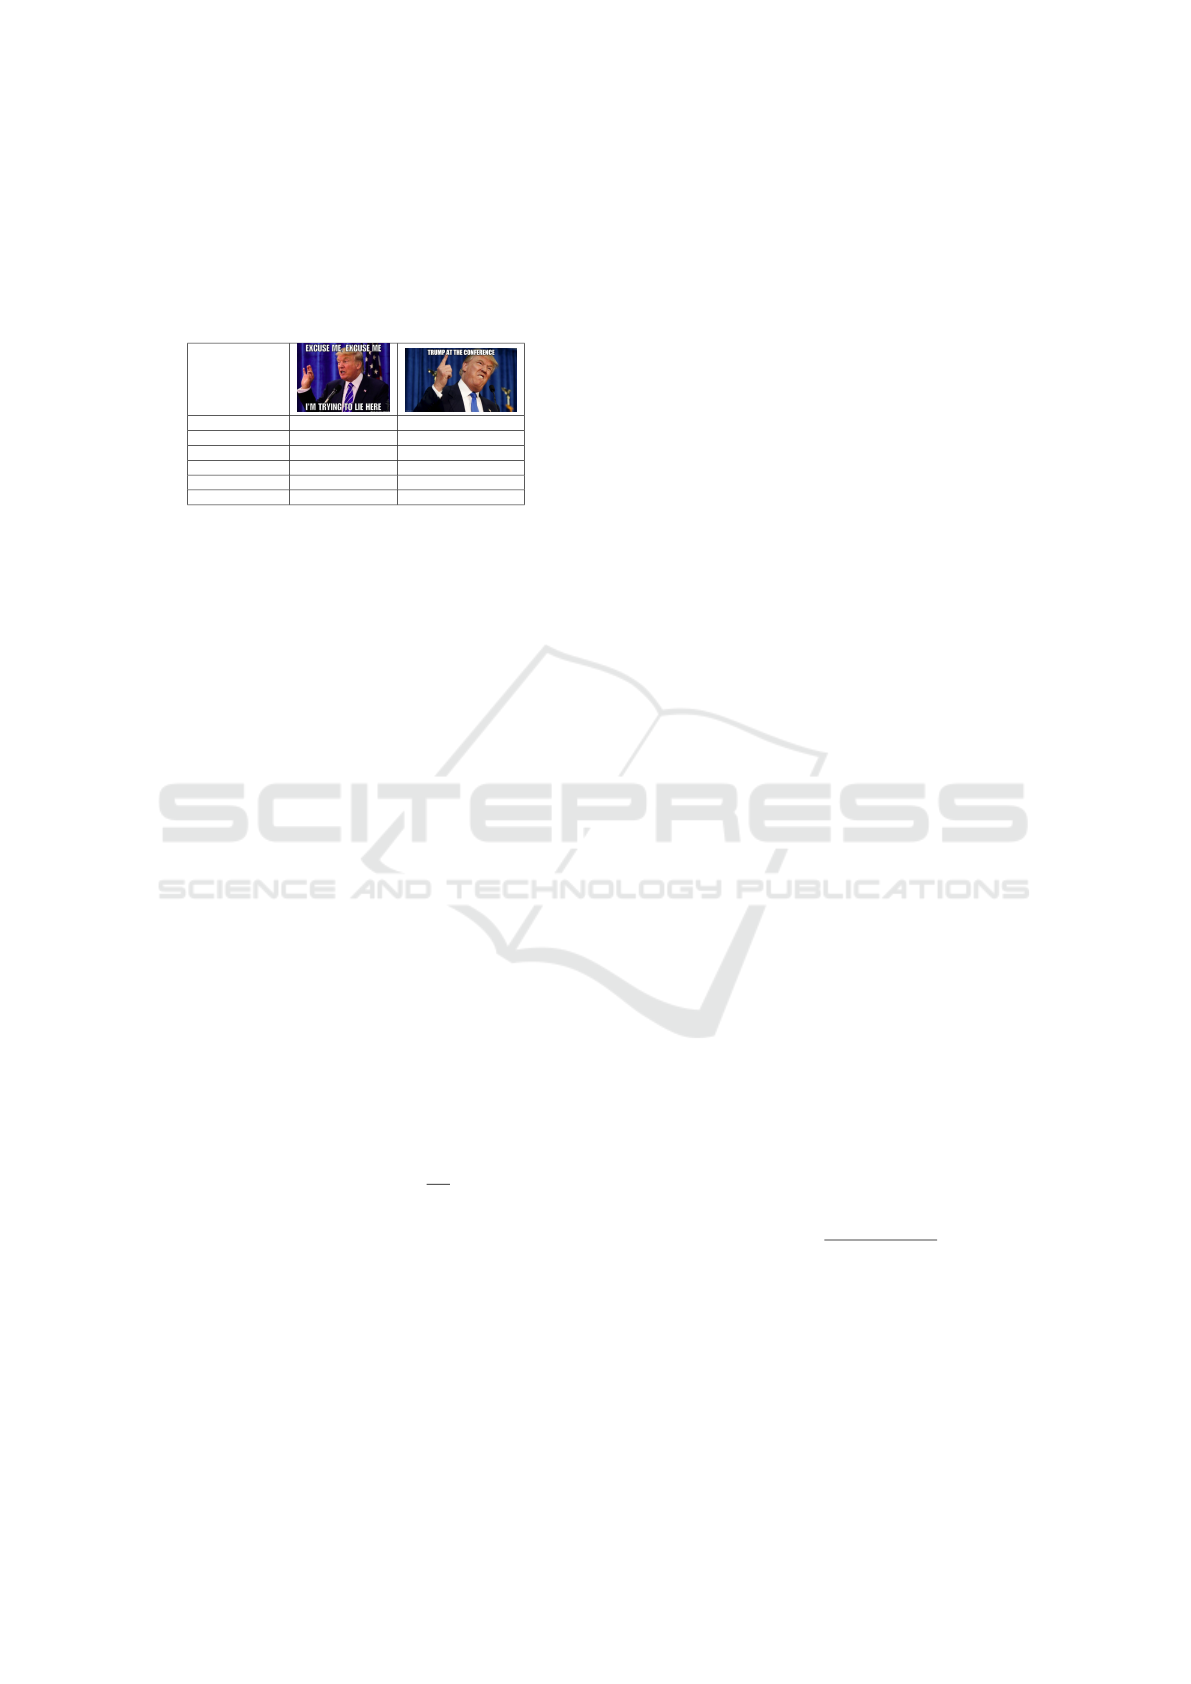
Table 2: Is a given image a MEME? A table that shows how
annotation proceeded for each image considering the per-
ception of each annotator towards an image. Response of 5
users is captured for 2 images and shows a confidence score.
Here the left image is considered as MEME due to the high
confidence score obtained as 0.8 from majority votes as Y
for MEME.
User1 Y N
User2 Y Y
User3 Y N
User4 N Y
User5 Y N
Confidence score 0.8 0.4
Although, workers are told to make an apt judg-
ment for the response, we needed to set up a quality
control framework to rely on the precision observed.
With respect to this, there are two issues to be con-
sidered. Firstly, errors rate for human judgement is
significantly high and not all workers adhere strictly
to the guidelines. Secondly, workers don’t generally
concur with one another, particularly for subtle cases.
Table 2 shows how user’s judgment differs for label-
ing the images.
One possible solution towards these issues is to
have various workers freely annotate a common data
sample. A given picture is considered as positive only
if it gets majority vote amongst the annotators. It is
observed that various categories require various de-
grees of agreement among workers. For eg. in our
scenario, while 5 workers may be more than enough
for a typical “Trump” meme Table 2, 2
nd
column,
whereas at least 5 are necessary for getting a reliable
agreement on “distorted Trump reaction” picture (a
non-meme) Table 2, 3
rd
column. We calculated the
confidence score of each class for every data sample,
which is a score for the conviction with a picture was
considered to be a meme by the annotators. A con-
fidence score of 0.6 or above formed the basis for
correct label. The confidence score for a given data
sample, and a category is computed using the relation
below,
Con f idenceScore :
N
Y
N
(1)
where, N
Y
is the count of Yes’s allocated for a given
image, for whether it is a Meme or not, and N is set
to 5 for our study. A pictorial representation of the
data-set creation is shown in Fig. 7 while Fig. 5, 3
etc represents the type of data sample present in our
data-set.
3 MEME ANALYSIS
Creating a meme involves creativity in terms of rep-
resenting an emotion, phenomena or an idea, which
is why it is designed to have a deeper impact on the
audience, which could potentially be healthy or even
dangerous. What makes it interesting from a research
point of view, is that the graphic content and the text,
have peculiar roles to play towards the overall impact
a meme can have. Affect related information from
the images has been studied by authors in (Bourlai
and Herring, 2014), in which they have analysed that
image also plays crucial role for tasks like sentiment
analysis and emotion detection. Textual content has
been studied extensively towards such tasks in the re-
search community, and are established feature sets.
In our work, we begin our investigation by exploring
various feature extraction and learning techniques, to-
wards analyzing memes using only graphic content
(image processing). Different approaches studied are
described in the subsequent sections.
3.1 Image Processing Techniques
To examine various visual characteristics like edge
representation, color distribution and associated tex-
ture, following image processing techniques are ex-
plored where the classifier used is SVM.
• HOG Features. Histogram of oriented gradients
(HOG) (Dittimi and Suen, 2018) is a feature de-
scriptor that focuses on the structure or the shape
of an object. In addition to detecting the edges,
it also derives the edge direction by extracting the
gradient and orientation at the semantic edges in
an image. Locallized sub-regions contribute to
these orientations, i.e., an image is processed in
divide and conquer manner, wherein features are
computed for each localised region. As an output,
a histogram is generated that shows the frequency
distribution of a set of continuous data. The mag-
nitude G
m
and orientation (direction of edge) G
d
are calculated on the basis of change of magnitude
in X and Y directions.
G
m
=
q
(G
x
)
2
+ (G
y
)
2
(2)
G
d
= tan(φ) = G
x
/G
y
(3)
where G
x
and G
y
are change in X and Y direc-
tions respectively and φ is direction of a particular
pixel.
To get the information of the edges and the cor-
ners with respect to change in intensity, we have
WEBIST 2020 - 16th International Conference on Web Information Systems and Technologies
330
implemented HOG technique to extract the rel-
evant features which resulted in a 2304 dimen-
sion feature vector. These descriptors performed
with a decent F1 score of 0.8 when evaluated for
meme/non-meme classification problem.
• Color Histogram. Red, green and blue are con-
sidered as primary colors and contribute towards
the 3D channel configuration of a colored image.
Color Histogram (Singh et al., 2012) is used to
represent the color distribution of an image con-
sidering these primary channels. Initially, it splits
the image w.r.t three channels and compute the
histogram for each. Finally all the obtained his-
tograms are concatenated into what is called as
flattened histogram.
We use RGB color histogram of 8 bins to get the
distribution of colors in an image resulting in a
256 dimensional feature vector. It is observed
from our experimentation that color histograms
do not lead to a reliable meme/non-meme clas-
sification, resulting in an F1 score of 0.56. The
reason for this performance could be attributed
to the possibility of non-unique color distribution
present in comparison of data-points (meme/non-
meme set), which is one of the commonly known
limitation of this technique.
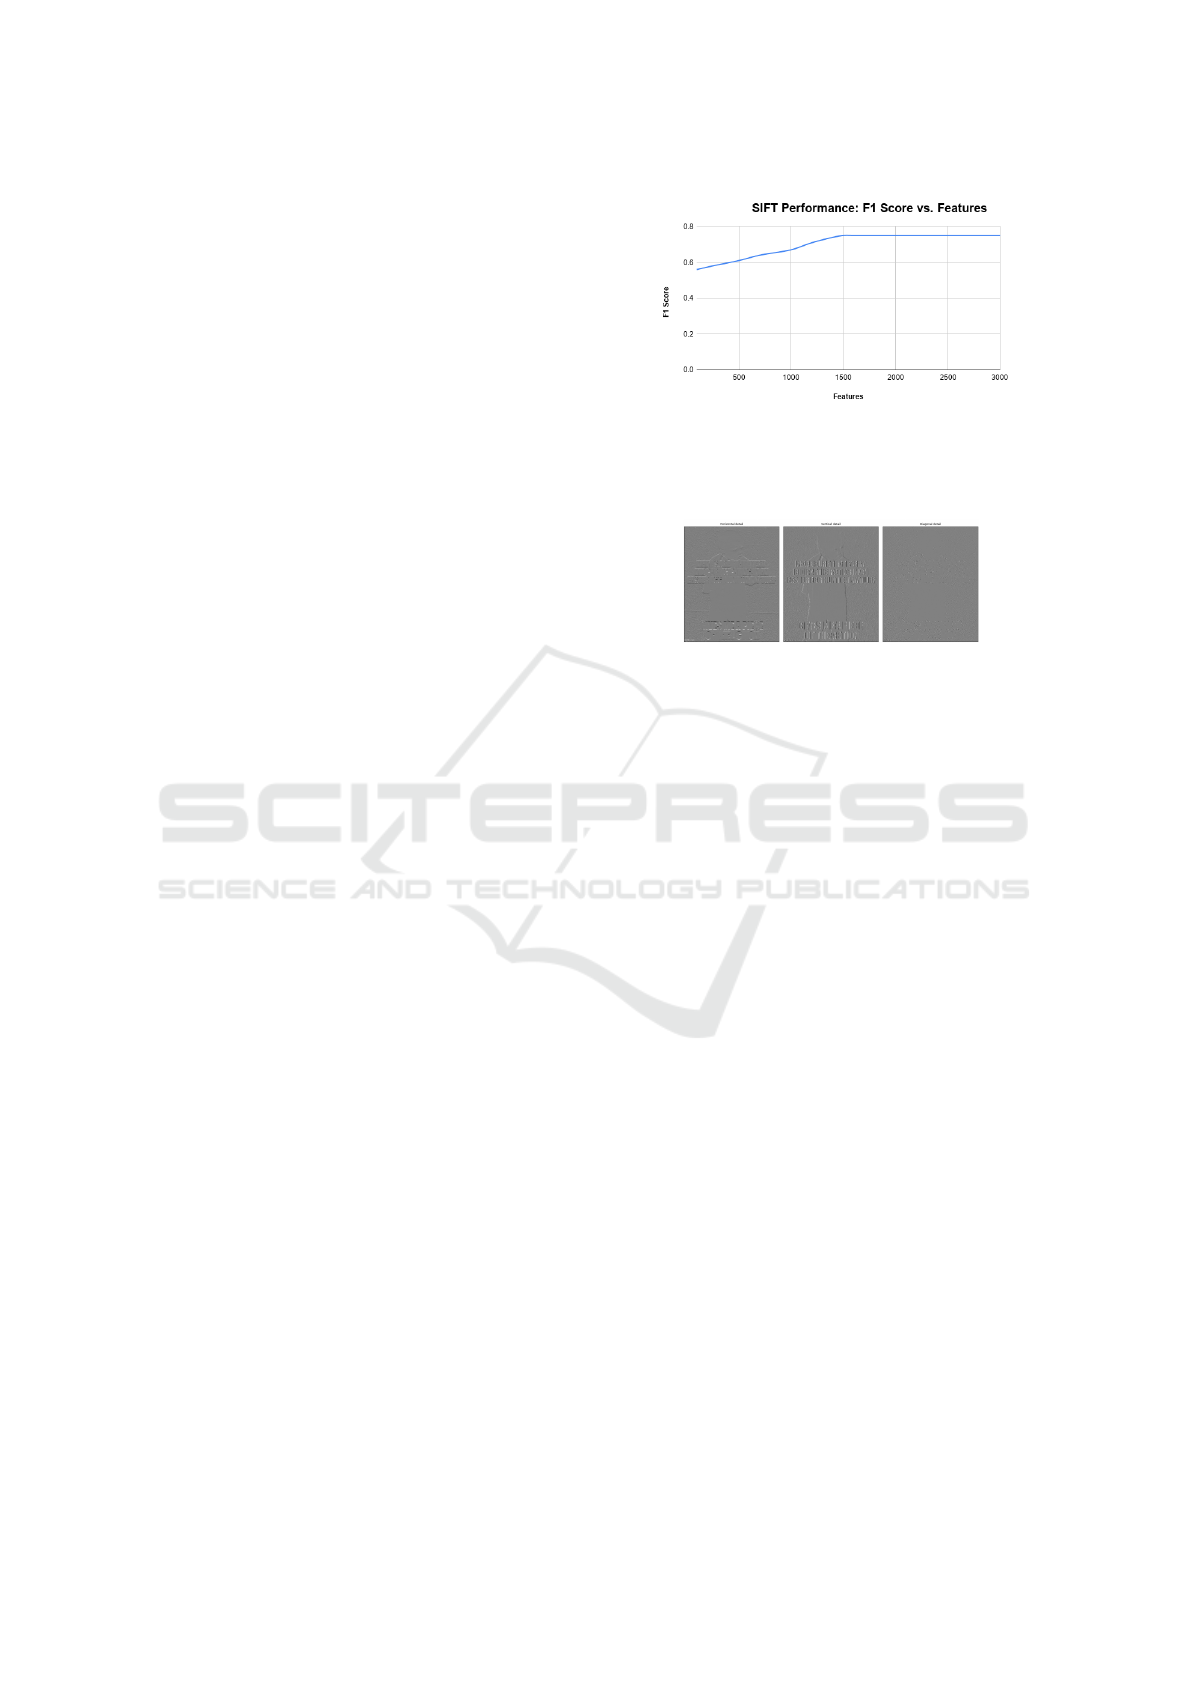
• SIFT. (Yuvaraju et al., 2015) Scale Invariant Fea-
ture Transform is primarily used to detect and de-
scribe the localized features in an image. It locates
certain points of interest within an image, aug-
ments them with parametric knowledge called as
descriptor. The entire procedure is divided into 4
sections namely: constructing a scale space, key-
point localisation, orientation assignment and key
point descriptors. In case of meme, SIFT works
by comparing the local features of two images
from the empirical analysis of different number
of match-point selection obtained from SIFT with
SVM, we found the system performance gets con-
verged to the F1 score of 0.75 after the considera-
tion of 1500 features shown is Fig. 8.
• LBP-Histogram. LBP (Local Binary Pat-
tern) (Mu et al., 2008) is used to find the tex-
ture of an image, in which the pixel values of an
image are labeled by thresholding the neighbour-
hood of corresponding pixel and considers the re-
sult as binary outcome. We have combined it with
histogram that helps in detecting the face within
images. For meme classification, we have taken
768 dimension feature vectors obtained from his-
togram and it resulted in F1 Score of 0.49.
• Haar Wavelet. (Porwik and Lisowska, 2004) is
used to remove noise from an image by dividing
Figure 8: Shows the variation in result with varying count
of features used to detect MEME. It can be observed from
the graph that consideration of 1500 features is performing
well and gets converged.
Figure 9: Shows different coefficient value obtained by ap-
plying HAAR Wavelet on an image.
it into different sub images and then followed by
performing DWT (Discrete Wavelet Transform)
using a discrete set of wavelet scales and trans-
lations obeying some defined rules to get the pixel
distribution in horizontal, vertical and diagonal di-
rection. Fig. 9 shows the pixel distribution of an
image, after performing Haar wavelet transform.
For meme classification task, this technique is ob-
served to outperform all the other image process-
ing techniques with an F1 score of 0.91, due to
its effective noise removal characteristic using low
pass and high pass filtering.
3.2 Deep Learning Techniques
Despite low computational power, classical image
feature extraction methods have limitations. For e.g.
extracting specific features with limited parameters
for a technique like LBP concentrates on local bi-
nary patterns and loses the edge corner information.
To overcome this problem, we have performed dif-
ferent experiments for image feature extraction using
various pre-trained deep learning models like VGG-
16 (Simonyan and Zisserman, 2014), Resnet-10, and
AlexNet. In spite of the effectiveness of these mod-
els for different yet closely overlapping tasks, VGG-
16 is observed to have outperformed as compared to
other two deep learning models, due to the use of rel-
atively smaller receptive fields, i.e. (3x3 with a stride
of 1) which can capture fuzzy interconnected pixel
information unlike other models. Based on this per-
A Curious Case of Meme Detection: An Investigative Study
331

formance, we re-trained VGG-16 with our data-set,
and it is observed to outperform it’s own pre-trained
version. This is also tabluated in the system perfor-
mance summary Table 10. This advocates the need of
training a CNN freshly on a data-set, where the objec-
tive entails higher order information/feature learning,
like meme/non-meme classification. Besides evalu-
ating a purely VGG-16 based architecture, we per-
formed several other experiments utilizing LSTM,
BiLSTM and self attention based mechanism which
is inspired from (Nagda and Eswaran, 2019), in that
a hybrid approach comprising of CNN and LSTM, is
implemented towards the task of image classification,
wherein the architecture provides both semantic and
sequential meaning of the information embedded in
the input.
3.3 Takeaway from Image Processing
and Deep Learning Techniques
Results shown in Table 4 signify that Haar based ap-
proach performed well in classifying an image as a
meme prominently due to its noise removing property,
i.e. non-salient parts of an image, or other objects that
are not of significant importance by calculating hori-
zontal, vertical and diagonal coefficients followed by
application of low pass filter that results into approxi-
mate coefficients of the sub-image.
HOG also yields decent performance with an F1
score of 0.8, but it is not observed to generalize well
the way Haar based model does. Also, since HOG
captures edge related information where there is a
change in intensity value, which might not provide
distinctive characteristics towards modeling the class
specific non-linearity.
SIFT is observed to be of relatively inferior per-
formance because of its characteristics that does not
lead to better classification.
LBP followed by a histogram and color histogram
also show poor performance, since an image cannot
be classified on the basis of the distribution of colors
as well as texture of an image, as images with same
color and texture can be used as a meme or non-meme
depending upon the context and additional informa-
tion.
To better understand the information contained in
an image, we concatenated features obtained from
various techniques. Results obtained indicate that the
collective information of edge, corners, and removal
of noise from an image obtained from HOG and Haar
features performed significantly better in comparison
to fusion of other features evaluated.
VGG-16 pretrained on imagnet data-set did not
perform well because of the difference in nature of
data-set, in terms of the passive nature of the visual
content, as against particularly indicative of affect re-
lated aspects of real word ideas, in our data-set. To
address this problem, we have trained VGG-16 on our
data-set, which is observed to perform significantly
better as compared to approaches involving different
combination of deep learning techniques i.e., LSTM,
BiLSTM, self-attention.
3.4 Proposed Method
Observed from the above section, every technique has
its own advantage and disadvantage in terms of ex-
tracting various kinds of features. Like, HOG and
LBP both attempts to use the same kind of informa-
tion that is gradients around a pixel. The key differ-
ence between HOG and LBP is how to get the gradi-
ent information. The power of LBP stems from the
fact that it uses all 8 directions for each pixel, com-
pared to HOG which only uses 2 direction for each
pixel. However, due to the coarseness of the binning
employed by LBP makes it lose information com-
pared to HOG. It is well known that HOG is great
at capturing edges and corners in images unlike LBP
that captures the local patterns, which makes them
complimentary to each other. Similarly, SIFT works
based on identifying interest points in an image. So,
no sliding windows are needed to scan all regions
of an image, whereas HOG uses the sliding window.
These are the 2 main differences in various feature
extractors. They either work based on interest point
detection or rely on dense sampling techniques like
sliding windows. Most importantly, the desired qual-
ities in an feature extractor are:
• Rotation Invariance - should be able to identify
the object, irrespective of its orientation.
• Translation invariance - Even if the object is
moved to a different location, it should be de-
tected.
• Illumination invariance - should work even if
there is change in brightness and contrast in the
image.
• Scale invariance - should work even if the image
is zoomed in or out.
Indeed, features extracted from various techniques
can be fused to get the in depth information embedded
in an image. This motivated us to combine the vari-
ous features in a form of horizontal stack followed by
the application of different deep learning techniques
with a combination of softmax as decision function
as shown in Fig. 10. The classical feature embedding
is configured in 3 different ways with a 5 X 255, 3
X 1000, and 4 X 768 dimensionality. Application of
WEBIST 2020 - 16th International Conference on Web Information Systems and Technologies
332
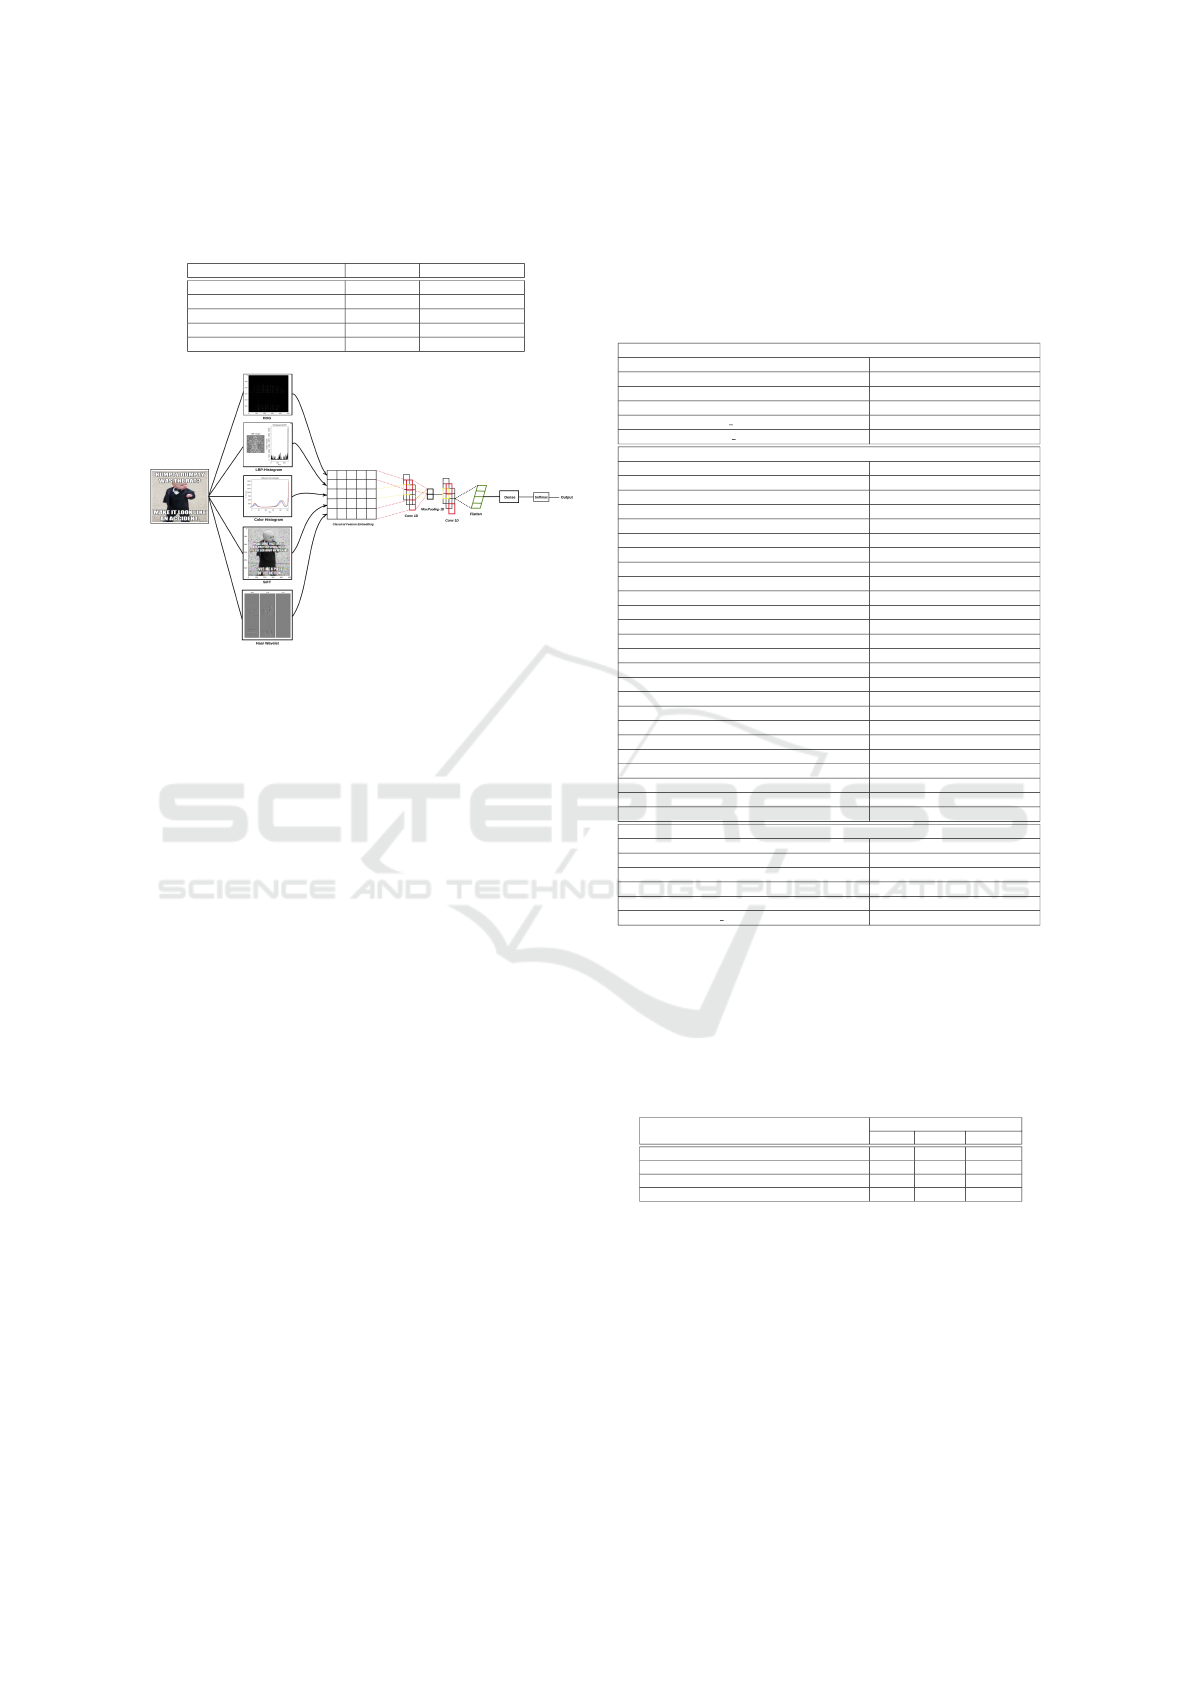
Table 3: Comparison of VGG-16 and proposed method on
different factors that shows irrespective of VGG-16 per-
forming well, proposed method is having an upper hand.
Comparison Factor VGG-16 Proposed Method
No. of Parameters at FC layer 4,097,000 102
Total Number of Parameters 138,423,208 36,767
No of convolution Layers 16 2
Total Number of Epochs 5 20
Training Time 4 hours 10 Minutes
Figure 10: Shows the newly proposed method for MEME-
non-meme detection that creates a classical features embed-
ding obtained from HOG, Haar, SIFT, LBP and Color His-
togram(CH )followed by the application of Deep Learning
Techniques.
convolution layer on a 5 X 255 dimension embedding
performed with a highest F1 score of 92.1 as it com-
prises of all the basic features while the least perfor-
mance is shown by the implementation of convolution
and LSTM on 4 X 768 feature embedding.
3.4.1 VGG-16 vs Proposed Method
Although the performance of proposed method is low
in comparison to VGG-16, but considering computa-
tion, configuration and no. of parameters, proposed
method has an upper hand which can be seen in Table
3. The combination of other techniques like LSTM,
BiLSTM and attention with convolution performed
well in our method in comparision to VGG-16.
3.5 Analysis on Twitter Data and a Real
Time System
The performance of different techniques and methods
used in the prior section to classify image as meme or
non-meme has performed significant enough on our
data-set which is shown in Table 10. This made us
to predict the posted content from social network for
real-time analysis. For this we considered twitter plat-
form as it provides free API to download data for re-
search purpose. We have collected 1200 tweets that
consist of images and asked the annotators to annotate
Table 4: Shows result of different image processing tech-
niques like HOG( Histogram of gradient),SIFT(Scale In-
variant feature transform),LBP Histogram etc and the result
obtained from concatenating the classical features while
other section shows the results obtained from Deep Learn-
ing Techniques like Convolution, BiLSTM and self atten-
tion.
Image Processing Techniques
Features + SVM Accuracy (F1 Score)
HOG 0.8
Haar Wavelet 0.91
SIFT 0.75
LBP histogram 0.49
Color histogram 0.56
Concatenation of features obtained from different Image Processing Technique
Feature Combination Accuracy (F1 Score)
haar, lbp,hog,colorhist, sift 0.5
haar , lbp, hog, colorhist 0.5
haar, lbp, hog, sift 0.49
haar, lbp, colorhist, sift 0.5
hog, lbp, sift, colorhist 0.49
hog, lbp, sift 0.49
hog, lbp, colorhist 0.5
hog, lbp, haar 0.49
hog, sift, colorhist 0.5
hog, sift, haar 0.8
hog, colorhist, haar 0.5
lbp, haar, colorhist 0.49
lbp, haar, sift 0.49
haar, sift, colorhist 0.49
haar, hog 0.88
haar, sift 0.79
haar, colorhist 0.49
haar, lbp 0.48
lbp, hog 0.49
lbp, colorhist 0.49
lbp,sift 0.49
hog, colorhist 0.49
hog, sift 0.73
sift, colorhist 0.5
Deep Learning Techniques
Architecture Details Accuracy (F1 Score)
VGG-16 (Pretrained) + softmax 0.68
VGG-16 (trained with our data-set) +Softmax 0.94
Vgg-16 + lstm 0.61
Vgg-16 +bilstm 0.65
Vgg-16 Bilstm+attention 0.65
Table 5: Results obtained by the newly proposed method
where 5X255 corresponds to the consideration of the fea-
tures obtained from all the techniques while 3X1000 cor-
responds to the consideration of Haar, HOG and SIFT fea-
tures only. It clearly shows that combination of features
obtained from all the techniques provides best result and
outperformed the other existing classical techniques.
Architecture Details
Classical Feature Dimension
5X255 3X1000 4X768
convolution layers 0.92 0.88 0.88
convolution+lstm 0.82 0.8 0.79
convolution+bilstm 0.82 0.87 0.88
convolution+bilstm+self attention(mul,addtive) 0.85 0.81 0.80
them as meme and non-meme as explained in Sec-
tion 2. We predicted the image considering only those
techniques which performed well on our data-set.
Out of all techniques it can be observed that Haar
has performed well which is shown in Table 6. We
further analysed the data-set and the techniques per-
formance in predicting different types of memes and
non-memes, details are shown in Table 7. The infer-
ence from the error analysis table shows that classical
method is unable to perform good to detect Type 2
A Curious Case of Meme Detection: An Investigative Study
333
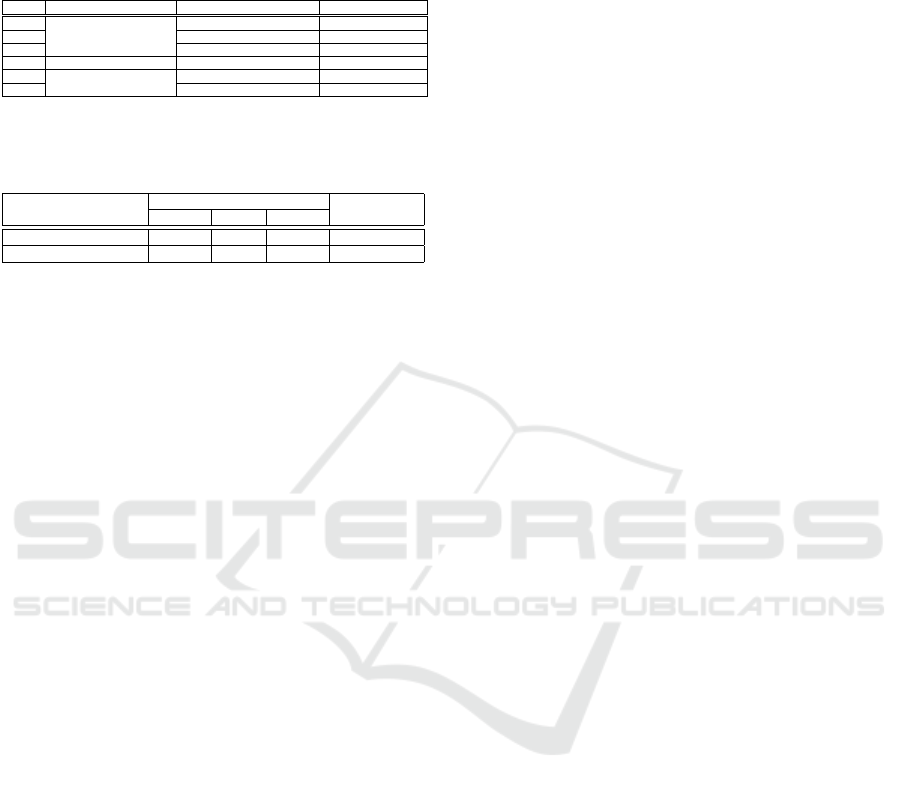
Table 6: Performance of the system on real time data of 30
samples taken from twitter. Scores obtained from different
techniques that shows HAAR model classified the data ap-
propriately in comparison to other techniques.
S. No. Models Description Features F1 score(Accuracy)
1 Haar 0.85
2 Hog 0.78
3
Image Features+Svm
Sift 0.75
4 Image Embedding +Conv image embedding 0.68
5 vgg-16 0.56
6
Deep Learning Model
vgg-16+bilstm+selfattention 0.67
Table 7: Shows the Error Analysis considering different
types of MEME and non-meme and the performance of the
different techniques in classifying the image.
Techniques
Not a MEME (600)
MEME (600)
Type1 Type2 Type3
Classical method 140/200 20/200 160/200 396/600
Deep Learning Method 80/200 80/200 20/200 400/600
non-meme while Deep Learning techniques did not
performed well in detecting Type 3 non-meme.
We developed a basic system that detects meme
from the real time tweets of a particular topic such as
#Modi, #Trump, #covid etc. From the result of the
system we have observed that it has failed to identify
different meme and non-meme categories. The details
of inference is explained in Section 3.5.1.
3.5.1 Why It’s Not Working on Real Time Data
There are some noteworthy points that could be a rea-
son why the system is not working on real time data:
• Same image with different tweets results in meme
or non-meme. This can be clearly observed from
image of trump in Table 2 as if we tweet as ”trump
at a conference” then it will be considered as non-
meme while if tweet is ”Excuse me ! Excuse me!
I am telling a Lie” then it falls in the category of
memes.
• The context or background knowledge of visual
and textual information of the multimodal data
should be known.
• It can be observed from Fig. [5,6,4] that in the ma-
jority of the cases, visual and textual cues provide
different emotions and information embedded in
an image in case of memes.
Authors in (Bourlai and Herring, 2014) have ana-
lyzed corpus of tumblr post for sentiment analysis and
have shown that images convey more emotions than
plain text. It follows that analyzing images along with
text in multimodal environments should improve the
performance and result in greater accuracy of emotion
analysis. Considering this, we will further analyse the
data sample considering both image and text for de-
tection of memes.
4 EMPIRICAL
CHARACTERIZATION OF
MEMES
To analyse the difference between meme and non-
meme, we have performed different experiments
considering various associativity measures, between
original textual information extracted using OCR
(text
ocr
) and output of the scene description network
(scene
text
). The scene description network (Vinyals
et al., 2015) VGG-16 (Simonyan and Zisserman,
2014) pre-trained on imagenet dataset (Russakovsky
et al., 2014), is used to generate the caption or scene
description from an image, whereas to extract the tex-
tual content from meme we have used off the shelf
optical character recognition (OCR) API. Different
metrics towards this are computed and considered to-
wards examining the association between visual and
textual content, represented by scene
text
and text
ocr
features respectively. Observations are depicted in Ta-
ble 8 with multi modal images (Meme/Non-meme),
their type, OCR extracted content X and generated
text Y as different details, whereas analysis of associ-
ation metric values (Semantic similarity, Cosine simi-
larity, Pearson correlation and Euclidean Distance) is
tabulated in Table 9.
• Textual Content: we have performed OCR ex-
traction on the dataset using google vision API to
get the text embedded over an image that was not
wholly correct. Therefore, AMT workers were
asked to provide the correct text against the OCR
extracted text.
• Visual Content: We have used image captioning
model VGG-16 (Simonyan and Zisserman, 2014)
pre-trained on imagenet dataset(Russakovsky
et al., 2014) to generate the caption or scene de-
scription from an image.
For analyzing various images to distinguish meme
from a non-meme, similarity and distances that are
demonstrated below calculated on the sentence em-
bedding of the OCR extracted text and the generated
text as scene description:
• Semantic Similarity. It is defined as the inner
product of the encodings, obtained from text that
gives a contextual relation between the two em-
beddings.
• Pearson Correlation. It is used to find the depen-
dency of one text over other.
• Cosine Similarity. It is used to depict how similar
is one text with other.
• Euclidean Distance. It is used to define how the
two texts are distinct.
WEBIST 2020 - 16th International Conference on Web Information Systems and Technologies
334
From Fig. 8 and 9 it can be shown that non-memes
depicted in S.No. [1,3] have high semantic similar-
ity scores with less euclidean distance and high pear-
son correlation between generated text and OCR text.
Similarly, images that are memes with S.No. [2,4,5]
have low semantic similarity scores, with high eu-
clidean distance and low pearson correlation between
generated text and OCR text and can be verified from
Table 9. For analysing the similarities in two text for
a specific image, heatmaps are generated as shown in
Fig. 11 and 12. This analysis shows that a meme and
non-meme are opposite in nature as there is almost no
relation between the textual and visual content in case
of meme unlike non-meme. An additional interesting
point can be observed from Table 8, that items with
S.No. [4 and 6], S.No. [3 and 5] are similar i.e. with
same scene description but vary when text is induced
on it. This attempts to rationalise the above mentioned
point that a non-meme image consists of a correlation
between image and the embedded text.
Analysis of meme is very different from other ac-
tive areas involving interactions of image and text
based modalities like image captioning (Aneja et al.,
2017) and scene description (Vinyals et al., 2015). In
these tasks, there is high correlation between visual
and textual content (Klein et al., 2015), which is dif-
ferent in case of meme analysis. On closely observ-
ing Fig. [5,6,4] , various forms in which a meme can
be expressed are clearly demonstrated, with very lit-
tle or even no semantic relation between what is being
shown and what is superimposed as text unlike in case
of non-meme images shown in Fig. [1,2,3].
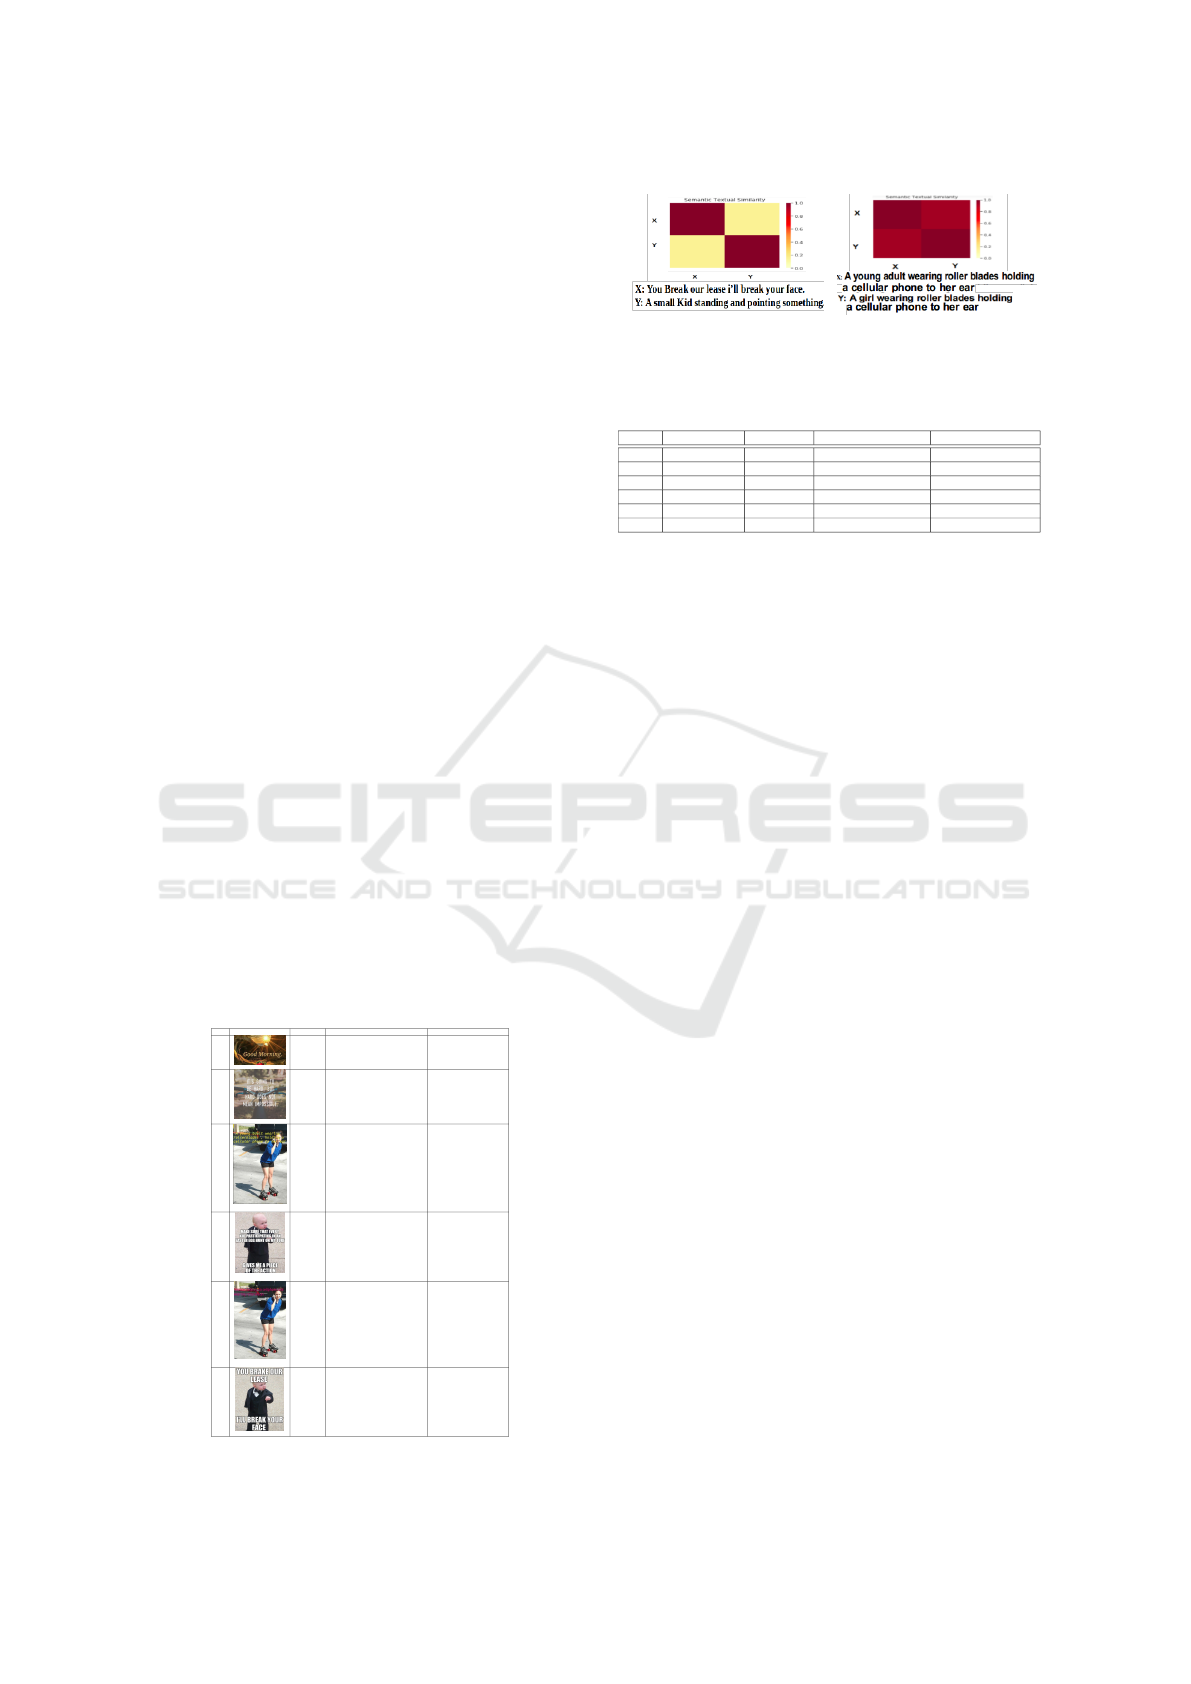
Table 8: Depiction of differences in Memes and Non-
memes, with highly similar OCR and captioned texts for
Non-memes, as against total dissimilarity for Memes.
S.no Image/Meme Type OCR Extracted Text Genrated Text
1 Non-Meme X: Good morning
Y: Sunshine with river
flowers and mountains
2 Meme
X: It’s going to be hard but hard
doesn’t mean impossible
Y: Handle of a Cycle
3 Non-Meme
X: A young adult wearing roller blades
holding a cellular phone to her ear
Y: A girl wearing roller blades
holding a cellular phone to
her ear
4 Meme
X:Make Sure that every kid
participating in an easter egg hunt on
my turf gives me a piece of the action
Y: A small kid standing and
pointing something.
5 Non-Meme
X:Woman talking on cell phone and
wearing roller skates
Y: A girl wearing roller blades
holding a cellular phone to
her ear.
6 Meme
X:You Break our Lease I’ll
Break your face
Y: A small kid standing and
pointing something.
Figure 11: S.no 6. Figure 12: S.no 3.
Table 9: Observations from association evaluation, using
Semantic, Cosine similarities, Pearson coefficient and Eu-
clidean distance.
S. No. Semantic sim Cosine sim Pearson Correlation Euclidean distance
1 0.40 0.29 0.29 1.1
2 0.0 0.14 0.14 1.3
3 1.0 0.94 0.94 0.33
4 0.20 0.21 0.21 1.25
5 0.76 0.76 0.76 0.27
6 0.2 0.14 0.14 1.3
5 MEME APPROACH
To detect a MEME, we have performed experiments
considering image, text and both as input. For the
task, we have taken 80% of the data-set for training
and remaining 20% for testing. The methods used for
extracting the visual and textual features are demon-
strated in the subsequent sections.
5.1 Visual Feature Extraction (m1)
Visual features are extracted using a pre-trained CNN
like VGG-16 (Simonyan and Zisserman, 2014). After
evaluating and assessing the performance of alterna-
tives like ResNet-50 (He et al., 2015) and AlexNet
(Krizhevsky et al., 2012) for feature extraction from
an image, it was established that VGG-16 can learn
better features at both abstract and fine-grained level
(Russakovsky et al., 2014).
Towards this, following steps are involved in the
process of feature extraction:
• Step 1: To maintain uniformity in image dimen-
sions, we have resized them into 224×224×3
from a given original image I, the resized image
X
i
is fed into VGG-16 as input for feature extrac-
tion.
• Step 2: Extracted feature Y
i
from VGG-16 for the
given image is then flattened.
• Step 3: Flattened output Y
i
0
is fed to a fully con-
nected network using a dense layer and finally sig-
moid based activation is used to compute the out-
put Y
out
. The network is optimized using binary
cross entropy BCE loss, which is defined as,
BCE = −(y log(p) + (1 − y)log(1 − p)) (4)
where y is ground truth and p is predicted output
of the input data.
A Curious Case of Meme Detection: An Investigative Study
335

Figure 13: Meme Classification.
5.2 Textual Feature Extraction (m2)
To understand the text associated with an image and to
get the insights of the contextual relation between the
different words used in the textual content, we have
used 100-Dim Glove word embeddings (Pennington
et al., 2014) embeddings(text), and vocab matrix of
size 50 ×100 is obtained from such processing. Tex-
tual embeddings x
i
are then given as input to CNN
having 64 filters of size 1×5, and Relu as activation
function, to extract the required textual features.
x
i
= embeddings(text) (5)
y
i,k, j
=
∑
i,k, j
w
i, j,k
(x
i+i
0
, j+ j
0
) (6)
To reduce the dimension size of the features generated
by CNN layer, we have used maxpooling of size 2X2
y
i
0
,k
0
j
0
. The output from this is given as input to LSTM
where we get a semantic feature vector s
t
.
y
0
i,k, j
= max {0,y
i,k, j
} (7)
y
i
0
,k
0
, j
0
= maxpool(y
0
i,k, j
) (8)
h
t
,s
t
= LST M(h
t−1
,s
t−1
,y
i
0
,k
0
, j
0
) (9)
5.3 Emotion Feature
To get the emotion feature from OCR extracted text
t
ocr
. We have used NRC emotion dictionary devel-
oped by (Mohammad, 2018) to understand the influ-
encing capacity of each word towards different emo-
tions, using values from 0 to 1. If the score for a word
is close to 1, it is more likely to contribute towards the
emotion associated with the text via various implied
affects like anger, joy, trustworthy emotions etc. Sim-
ilarly, if the score of word is 0, the word is less likely
to influence overall emotions defined. We call the fea-
tures computed as intensity vector emotion
vector
.
Finally we concatenate semantic feature vector s
t
obtained from Section 5.2 and emotion feature vector
emotion
vector
, which carries encoded information of
emotion content. This results in text
vector
for given
image.
Table 10: Performance of web image classification : Model
M3 performs well due to the addition of emotion and rela-
tion embedding.
Modal Precision Recall F1 Score
m1:Image 0.94 0.96 0.94
m2:Text 0.81 0.79 0.80
m3:Image+Text+emotion+relation embedding 0.99 0.98 0.98
5.4 Relation Embedding
From Section 4 we have seen that correlation ex-
ists between the image and text in the case of non-
meme. Whereas in the case of meme, this correlation
decreases. In relation embedding, parameters like
semantic similarity, cosine similarity, euclidean dis-
tance, and pearson correlation are computed, between
the text generated via scene description network and
the one extracted using OCR. We call this represen-
tation as relation vector relation
vector
of dimension
1 × 4.
5.4.1 Classifier (m3)
Finally to build a classifier with a hybrid structure as
shown in Fig. 13, we concatenate all the feature vec-
tors extracted from sub networks i.e. Image
vector
from
Section 5.1, text
vector
, relation
vector
and pass this con-
catenated vector to a sigmoid layer. The loss function
employed for optimization uses binary cross entropy.
This is how we built a classifier that classifies a given
multi-modal web image as a meme/non-meme.
6 RESULTS
As shown in Table 10, we have developed three dif-
ferent models out of which model m3 has performed
well, compared to the other 2 models. Out of three,
we can acknowledge that model m2 has not per-
formed as good as others because it was unable to cap-
ture the emotional feature due to the indifference to-
wards the inherent user perspective. The requirement
is reinforced by the fact that the perception of emo-
tional state varies from person to person. This results
in information loss in text classifier m2 i.e. the model
isn’t able to learn relevant features when trained over
text. The performance of m3 is enhanced compared to
model m2 due to the addition of emotion and relation
feature, which are generated by calculating semantic
similarity, cosine similarity, pearson correlation, and
euclidean distance.
WEBIST 2020 - 16th International Conference on Web Information Systems and Technologies
336

7 DISCUSSION
The data-set we present in this paper, is created con-
sidering the requirement of establishing a fundamen-
tal baseline system. Since there is dearth of reliable
data-set resources for meme content analysis, we have
ensured that any assumption made during the creation
of the data-set or conducting the study, conforms to
the norms as defined by the problem itself. The clas-
sification performances of different systems involving
the usage of hand-crafted features and deep learning
approaches presented insightful observations. Haar
wavelet transform based features are observed to yield
most optimal performance amongst different image
processing techniques evaluated. Although the mod-
eling of texture related information is decently done
by this technique, but it is not as good as is learned by
the initial convolutional layers. A novel method for
identification of meme considering only image is pro-
posed in Section 3.4 where a feature embedding us-
ing classical approaches is derived to embed varying
structural and semantic information associated with
an image. Although, VGG-16 trained on our data-set
resulted in the best F1 score of 0.94, it has few notable
limitations when compared to proposed method. The
enhancements shown in Section 3.4.1, are significant
w.r.t the difference in the performance observed. The
performance of different techniques motivated us to
analyse the real time data which was obtained from
Twitter. Since Haar performed well for real time data
that led us to develop a basic system that predicts
the posted content on twitter as meme or non-meme,
downloaded at a particular instant. Few limitations
observed in this setup could be attributed to the fact
that textual context provided in the memes isn’t con-
sidered for this system. Section 4 shows empirical
characterization of memes considering one of the key
points obtained in Section 3.5.1. Besides establish-
ing the efficacious of different techniques towards the
task of Meme classification, we have also attempted
to elucidate the existing correlation between visual
and textual information in case of a non-meme unlike
a meme. Finally, a baseline system is described that
combines visual, textual and associated emotion re-
lated features with relation embedding obtained from
Section 4, which resulted in 0.98 F1 score.
8 CONCLUSION AND FUTURE
WORK
This paper reports an investigative study on the role
of graphical content in an image, towards understand-
ing a meme. The study builds on by applying dif-
ferent classical image processing and deep learning
techniques, to evaluate their efficacious towards clas-
sifying meme vs non-meme. Due to the limitations
observed in case of individual techniques, we pro-
pose an approach that represents an image by com-
bining all the features obtained from different im-
age processing techniques evaluated in a stack, along-
with deep learning based additional feature learning
scheme. It is observed that the application of con-
volution operation for model training performs best
with F1 score of 0.92. Our real time evaluation of
the classification system shows that image (graphic
content) alone is not sufficient to detect a meme on
social media. Therefore we performed meme/non-
meme characterization by analyzing different associ-
ation metrics and deduced that in case of meme there
is almost no semantic correlation between visual and
textual content, yet both the modalities play a signifi-
cant role in defining the higher order phenomena that
the meme intends to convey. Finally a basic system
is designed that detects meme and non-meme consid-
ering the combination of image, text and the emotion
features which yields F1 score of 0.98. In the future,
this work can be extended to:
• Understand the relationship type that exists be-
tween text and image with greater depth, which
helps us generate or suggest/recommend a meme
to the user.
• Understanding the meme-emotion diffusion in so-
cial networks and support social media platforms
to provide the red flags for the inappropriate
memes, which can potentially affect someone’s
mental state.
REFERENCES
Aneja, J., Deshpande, A., and Schwing, A. (2017). Convo-
lutional image captioning.
Baltrusaitis, T., Ahuja, C., and Morency, L.-P. (2017). Mul-
timodal machine learning: A survey and taxonomy.
IEEE Transactions on Pattern Analysis and Machine
Intelligence, PP.
Bourlai, E. and Herring, S. C. (2014). Multimodal com-
munication on tumblr: “i have so many feels!”. In
Proceedings of the 2014 ACM Conference on Web
Science, WebSci ’14, page 171–175, New York, NY,
USA. Association for Computing Machinery.
Chen, X., Fang, H., Lin, T., Vedantam, R., Gupta, S., Doll
´
ar,
P., and Zitnick, C. L. (2015). Microsoft COCO cap-
tions: Data collection and evaluation server. CoRR,
abs/1504.00325.
Dittimi, T. and Suen, C. (2018). Modified hog descriptor-
based banknote recognition system. Advances in Sci-
ence, Technology and Engineering Systems Journal,
3.
A Curious Case of Meme Detection: An Investigative Study
337

Fortin, M. and Chaib-draa, B. (2019). Multimodal multi-
task emotion recognition using images, texts and tags.
pages 3–10.
French, J. H. (2017). Image-based memes as sentiment pre-
dictors. In 2017 International Conference on Infor-
mation Society (i-Society), pages 80–85. IEEE.
Geman, D., Geman, S., Hallonquist, N., and Younes, L.
(2015). Visual turing test for computer vision systems.
Proceedings of the National Academy of Sciences of
the United States of America, 112.
Gurari, D., Zhao, Y., Zhang, M., and Bhattacharya, N.
(2020). Captioning images taken by people who are
blind.
He, K., Zhang, X., Ren, S., and Sun, J. (2015). Deep
residual learning for image recognition. CoRR,
abs/1512.03385.
Hudson, D. A. and Manning, C. D. (2019). Gqa: A new
dataset for real-world visual reasoning and composi-
tional question answering.
Klein, B., Lev, G., Sadeh, G., and Wolf, L. (2015). Associ-
ating neural word embeddings with deep image repre-
sentations using fisher vectors. pages 4437–4446.
Krishna, R., Zhu, Y., Groth, O., Johnson, J., Hata, K.,
Kravitz, J., Chen, S., Kalantidis, Y., Li, L., Shamma,
D. A., Bernstein, M. S., and Li, F. (2016). Vi-
sual genome: Connecting language and vision us-
ing crowdsourced dense image annotations. CoRR,
abs/1602.07332.
Krizhevsky, A., Sutskever, I., and Hinton, G. E. (2012).
Imagenet classification with deep convolutional neu-
ral networks. In Pereira, F., Burges, C. J. C., Bottou,
L., and Weinberger, K. Q., editors, Advances in Neu-
ral Information Processing Systems 25, pages 1097–
1105. Curran Associates, Inc.
Mohammad, S. M. (2018). Word affect intensities. In
Proceedings of the 11th Edition of the Language
Resources and Evaluation Conference (LREC-2018),
Miyazaki, Japan.
Mu, Y., Yan, S., Liu, Y., Huang, T., and Zhou, B. (2008).
Discriminative local binary patterns for human detec-
tion in personal album.
Nagda, M. and Eswaran, P. (2019). Image classification
using a hybrid lstm-cnn deep neural network. 8.
Peirson, V., Abel, L., and Tolunay, E. M. (2018). Dank
learning: Generating memes using deep neural net-
works. arXiv preprint arXiv:1806.04510.
Pennington, J., Socher, R., and Manning, C. (2014). Glove:
Global vectors for word representation. volume 14,
pages 1532–1543.
Porwik, P. and Lisowska, A. (2004). The haar-wavelet
transform in digital image processing: its status and
achievements. 13.
Russakovsky, O., Deng, J., Su, H., Krause, J., Satheesh, S.,
Ma, S., Huang, Z., Karpathy, A., Khosla, A., Bern-
stein, M. S., Berg, A. C., and Li, F. (2014). Ima-
genet large scale visual recognition challenge. CoRR,
abs/1409.0575.
Savva, M., Kadian, A., Maksymets, O., Zhao, Y., Wijmans,
E., Jain, B., Straub, J., Liu, J., Koltun, V., Malik, J.,
Parikh, D., and Batra, D. (2019). Habitat: A platform
for embodied ai research.
Sidorov, O., Hu, R., Rohrbach, M., and Singh, A. (2020).
Textcaps: a dataset for image captioning with reading
comprehension.
Simonyan, K. and Zisserman, A. (2014). Very deep con-
volutional networks for large-scale image recognition.
arXiv 1409.1556.
Singh, A., Natarajan, V., Shah, M., Jiang, Y., Chen, X., Ba-
tra, D., Parikh, D., and Rohrbach, M. (2019). Towards
vqa models that can read.
Singh, N., Singh, K., and Sinha, A. (2012). A novel ap-
proach for content based image retrieval. Procedia
Technology, 4:245–250.
Sonnad, N. (2018). The world’s biggest meme is the word
“meme” itself.
Sorokin, A. and Forsyth, D. (2008). Utility data annotation
with amazon mechanical turk. In 2008 IEEE Com-
puter Society Conference on Computer Vision and
Pattern Recognition Workshops, pages 1–8.
Thomee, B., Shamma, D. A., Friedland, G., Elizalde, B.,
Ni, K., Poland, D., Borth, D., and Li, L. (2015). The
new data and new challenges in multimedia research.
CoRR, abs/1503.01817.
Vinyals, O., Toshev, A., Bengio, S., and Erhan, D. (2015).
Show and tell: A neural image caption generator.
pages 3156–3164.
Wang, Y. and Liu, Q. (2017). Visual and textual sentiment
analysis using deep fusion convolutional neural net-
works.
Xuelin, Z., Cao, B., Xu, S., Liu, B., and Cao, J. (2019). Joint
Visual-Textual Sentiment Analysis Based on Cross-
Modality Attention Mechanism: MMM 2019, pages
264–276.
Young, P., Lai, A., Hodosh, M., and Hockenmaier, J.
(2014). From image descriptions to visual denota-
tions: New similarity metrics for semantic inference
over event descriptions. Transactions of ACL, 2.
Yuvaraju, M., Sheela, K., and Sobana Rani, S. (2015). Fea-
ture extraction of real-time image using sift algorithm.
IJEEE, 3:1–7.
WEBIST 2020 - 16th International Conference on Web Information Systems and Technologies
338
