
Tracing the Evolution of Approaches to Semantic Similarity Analysis
Weronika T. Adrian
a
, Sebastian Skocze
´
n
b
, Szymon Majkut,
Krzysztof Kluza
c
and Antoni Lig˛eza
d
AGH University of Science and Technology, al. A. Mickiewicza 30, 30-059 Krakow, Poland
Keywords:
Knowledge Representation, Knowledge Metrics, Semantic Similarity, Knowledge Graphs, Literature Review,
Knowledge Engineering, Knowledge Visualization.
Abstract:
Capturing the essence of semantic similarity of words or concepts in order to quantify it and measure has been
an inspiring challenge for the last decades. From corpus-based statistics to metrics based on structured knowl-
edge bases, a plethora of methods has been proposed in several branches of Artificial Intelligence. Recently,
with the advent of knowledge graphs, a renewed interest in similarity metrics can be observed. Choosing
appropriate metrics that will work best in a given situation is not a trivial task. To help navigate through the
semantic similarity algorithms and understand the characteristics of them, we have analyzed the fundamental
proposals in this domain and the evolution of them over the years. In this paper, we present a review of the
approaches to measuring semantic similarity of entities in knowledge bases. We organize the findings into a
taxonomy and analyze the relations between and within the identified categories. To complement the research
with a practical solution, we present a new tool that supports the literature review process with graph-based
and temporal visualizations.
1 INTRODUCTION
We live in an information society, where such an ab-
stract concept as knowledge may have bigger value
than any physical resource. Not only we became
information-driven and information-oriented, but also
a general tendency towards automatization of infor-
mation processing can be observed. Knowledge bases
such as WordNet, Sensus, Gene Ontology or Gener-
alized Upper Model are visible examples of increas-
ing need for a databases that contain, along the infor-
mation, also its meaning. Ability to process complex
data in an intelligent way opens up new possibilities in
pattern discovery, recognition and analysis, and there-
fore leads to take the full advantage of the gargantuan
amount of data that is produced every second.
Recently, various knowledge-rich resources gain
increasing attention, offering flexibility of the data
and knowledge representation and allowing to rep-
resent complex relations that better reflect the reality
around us. Knowledge graphs, not only encyclopedic-
like, such as Wikipedia, DBPedia, Wikidata or Ba-
a
https://orcid.org/0000-0002-1860-6989
b
https://orcid.org/0000-0003-0242-2373
c
https://orcid.org/0000-0003-1876-9603
d
https://orcid.org/0000-0002-6573-4246
belNet, but also lexical such as WordNet, or taxo-
nomical such as domain ontologies, are invaluable re-
sources for comprehending the meaning of words and
phrases, and also real world objects and categories.
Exploiting these knowledge bases lead to results that
are not only universal, but also interpretable.
Semantic similarity analysis has been considered
for many years, and the graph-based knowledge rep-
resentation has always played an important role in it.
Similarity may be considered at different levels: from
word senses, through words, phrases, sentences up to
whole documents. For each of these levels, numerous
methods have been proposed over the years and still
new metrics appear every year. The reason for that
is two-fold: on the one hand we have new resources,
machine learning methods and application areas that
come with new datasets and input formats; on the
other hand, the methods are still not satisfactory on
more challenging and domain-specific cases. Thus,
we state the following research questions:
1. How to measure semantic similarity of entities
about which we have some (taxonomical, statis-
tical or graph-based) knowledge?
2. What base methods are there, how have they in-
fluenced one another and in which domains have
they been used?
Adrian, W., Skocze
´
n, S., Majkut, S., Kluza, K. and Lig˛eza, A.
Tracing the Evolution of Approaches to Semantic Similarity Analysis.
DOI: 10.5220/0010108401570164
In Proceedings of the 12th International Joint Conference on Knowledge Discovery, Knowledge Engineering and Knowledge Management (IC3K 2020) - Volume 2: KEOD, pages 157-164
ISBN: 978-989-758-474-9
Copyright
c
2020 by SCITEPRESS – Science and Technology Publications, Lda. All rights reserved
157

3. What methods gain attention recently and why?
To address the questions listed above, we have
conducted a literature review of the semantic simi-
larity metrics and analyzed their characteristics and
inter-dependencies. Then we used methods from the
knowledge engineering domain to better internalize
and capture the findings. In particular, we have de-
veloped an ontology of semantic similarity metrics
that organizes them into classes and captures other
attributes (such as application domain) and relations
among them (such as influence). To support the anal-
ysis of our findings, we have developed a simple tool
that provides useful visualizations based on graph-
based knowledge representation. Thus, the paper con-
tributes in the following ways:
• we provide a review of semantic similarity metrics
for concepts, objects and words that use different
aspects of knowledge about the entities;
• we present a classification and analysis of the rela-
tions between different similarity metrics that can
guide those who are starting their journey with the
semantic world, and we enhance it with biblio-
graphic analysis of their citations over the years;
• we propose a graph-based tool supporting litera-
ture review process and we demonstrate its usage
on the case of semantic similarity metrics.
The rest of the paper is organized as follows: We
put forward our motivation and give some context in
Section 2. Then we present the review of the ap-
proaches to semantic similarity illustrating their rela-
tions with a simple taxonomy and temporal and func-
tional dependencies in Section 3. In Section 4, we
present our tool that proved useful when analyzing the
state-of-the-art, we explain its design and implemen-
tation together with some directions for usage also be-
yond this work. We conclude our paper in Section 5
outlining the future development of our research.
2 CONTEXT AND MOTIVATION
Assessing similarity has multiple practical applica-
tions and the metrics provided for some domains may
prove useful in another one. Whether in recommen-
dation engines that propose similar objects based on
the ones liked by a user or natural language transla-
tors that suggest synonyms, assessing (semantic) sim-
ilarity is a crucial phase. Because of a rich mathe-
matical and lexical background of knowledge graphs
and ontologies, there are multiple applications that
exploit their characteristics, from measuring semantic
similarity (Agirre et al., 2010) or relatedness (Agirre
et al., 2015) between the abstract concepts, up to
more sophisticated problems that build on the previ-
ously mentioned tasks, such as named entity disam-
biguation (Zhu and Iglesias, 2018), entity set expan-
sion (Adrian and Manna, 2018) or case-based reason-
ing (Zbroja and Lig˛eza, 2001).
Semantic similarity methods may be also useful
for determining similarity between graph-based mod-
els, such as e.g. business process models. As compa-
nies usually own many business processes and store
their models in several versions, it may cause mis-
understandings, errors and delays, especially when
two departments that work together use similar, but
not identical models. Thanks to the comparing al-
gorithms, it is possible to find similar processes and
standardize the procedures in a company. There ex-
ist many algorithms for comparing business process
models, mostly based on element labels, syntax (el-
ement types and model structure), and model be-
haviour (Dumas et al., 2009). However, in practice,
it is hard to compare and evaluate them, because each
algorithm has its specific context of application, and
they may give different results depending on the fea-
tures of the models (Cayoglu U. et al., 2014; Antunes
G. et al., 2015).
The main objective of this paper is to give an
overview of fundamental semantic similarity metrics
and additionally grasp their influence on each other,
providing an extended perspective on their principles.
We believe that it is a firm starting point that can lead
to a better understanding of different interpretations
of semantic similarity, the resulting metrics and what
each of this methods “brings to the table”.
3 EVOLUTION AND ANALYSIS
OF SIMILARITY METRICS
By definition, similarity is a state of being almost the
same, what leads to a variety of possible interpreta-
tions – and therefore becomes a concept very hard
to standardize by any single measure (see Table 1).
In this section, we outline the directions in which the
metrics have been developed and analyze the relations
among them.
3.1 Evolution of Approaches
Apart from purely experimental attempts to discover
the universal notion of similarity, the works such as
“Dimensions of Similarity” (Attneave, 1950) began
the period of associating similarity with a geometri-
cal representation of the concepts characteristics, us-
ing the mathematical distance measuring methods to
KEOD 2020 - 12th International Conference on Knowledge Engineering and Ontology Development
158

quantify the result. On the other hand, in 1977 Tver-
sky published an article that can be considered as
one of the first contributions to the modern discussion
about the similarity metrics, starting a feature-based
class of methods (Tversky, 1977). The paper ques-
tioned the geometric approach towards similarity, and
presented a novel “Contrast Model” method of assess-
ing similarity based on the features of two concepts,
treating them as simple sets, taking into consideration
both their common attributes and their differences.
A different approach to this problem was then pre-
sented in 1989, when the semantic similarity was de-
fined as the aggregate of the interconnections between
the concepts (Rada et al., 1989). The paper introduced
an edge-based method leveraging the tree structure of
the graphs. Six years later, one of the most significant
works in this fields was published by Philip Resnik,
who presented a novel approach that used “Informa-
tion Content” to calculate the similarity between two
concepts (Resnik, 1995). That seminal paper started
a node-based group of methods that uses a text cor-
pus to calculate the IC metric (estimating probability
of a term’s occurrence) and influenced later on both
edge-based and hybrid approaches.
A hybrid class of methods attempts to combine
advantages of both node- and edge-based approach,
for example incorporating knowledge from a particu-
lar domain while calculating similarity (Knappe et al.,
2003). This class of methods has been intensively
developed especially in 2007 and 2008 and was also
inspired by the edge-based similarity measures (e.g.
Jiang and Conrath method influenced the Othman et
al. measure) and the node-based ones (e.g. Zhou et
al. similarity measure was inspired by the Wu and
Palmer’s work) (Jiang and Conrath, 1997; Othman
et al., 2008; Zhou et al., 2008; Wu and Palmer, 1994).
Ultimately, a new category of semantic-based
measures emerged in 2016 along with the Fähndrich
et al. work (Fähndrich et al., 2016). They described
the similarity methodology that decomposes the con-
cepts into semantic “primes” and then applies marker
passing, counting the activations that occurs and nor-
malising them by the number of initial activation to
obtain the semantic distance.
Nowadays, the concepts from different ap-
proaches are being mixed, such as in one of the
newest feature-based metrics, the Sigmoid similar-
ity (Likavec et al., 2019) that can take into account
the underlying structure of the ontology describing
the analyzed concepts.
3.2 Ontological View of the Approaches
The metrics can be thus organized into categories de-
fined by which characteristics of the description of
the considered entities are taken into consideration:
in graph-based knowledge bases the entities are de-
scribed by attributes and relations with other enti-
ties, and thus we call the metrics either Node or Edge
Based (see Figure 1). Node Based is a class including
metrics based on node analysis, which use internal is-
sues (such as link density, number of children, etc.)
and external ones such as shared annotations or infor-
mation content measuring how specific and informa-
tive a particular term is. Edge Based metrics include
those focusing on relationship analysis and often use
structural measures such as shared path or distance.
Metrics that are based on both node-specific infor-
mation and edge-based measures are called Hybrid.
Moreover, Feature Based and Semantic methods are
considered separately.
Each method classified in our ontology has its at-
tributes, such as the year in which it was developed
or an application domain for which it was proposed,
and relations with other methods on which it builds.
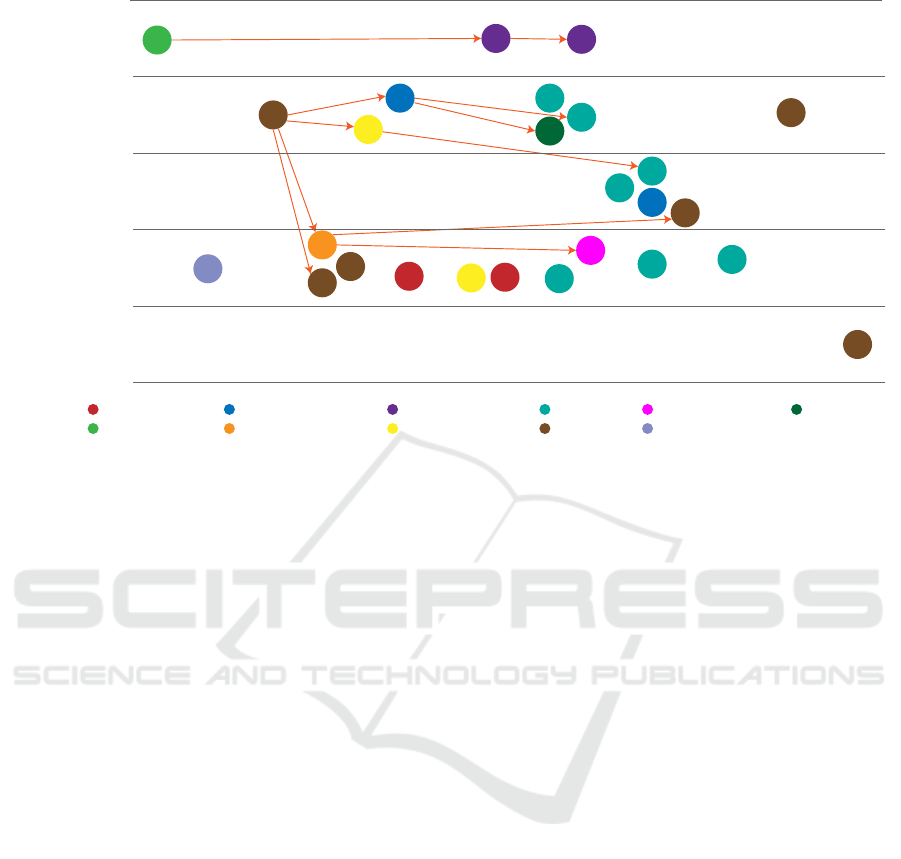
These different aspects can be represented visually as
we can see in Fig. 1. Multiple aspects of the research
landscape of semantic similarity analysis contain:
• on the timeline, we can see when certain methods
were developed;
• the classes of methods are represented by swim-
lanes;
• the methods’ influences on each other are repre-
sented by arrows, and
• the domain that the method was developed for
(note that this does not necessarily limit the us-
age of the method to this domain) are marked with
different colours and referenced below the graph.
Some methods demonstrate unique characteris-
tics, such as the one in (Rodríguez and Egenhofer,
2003), where the feature-based model allows to com-
pare terms across different ontologies. Three years
later, the X-Similarity metric, that was built upon
it, improved the correlation with the human notion
of similarity reaching 84% which can be considered
quite high score for this class (Petrakis et al., 2006).
The closest to human guess of similarity from all
the metrics compared in this article was reached by
a semantic-based MP metric with the correlation of
88.2% (Fähndrich et al., 2016). Another approach
called Align, Disambiguate and Walk or ADW for
short, presented in 2013, is until now considered to
present a state-of-the-art performance in textual, word
and sense similarity (Pilehvar et al., 2013). Some of
Tracing the Evolution of Approaches to Semantic Similarity Analysis
159
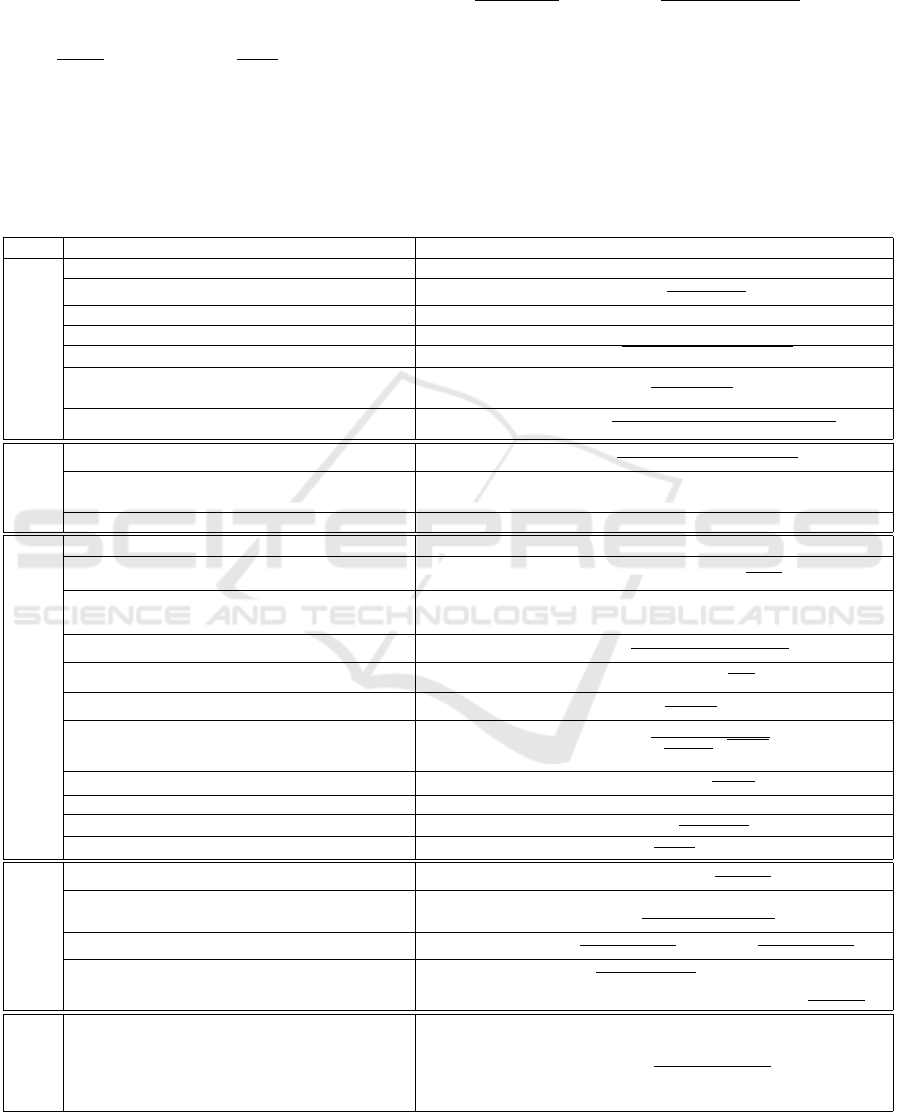
Table 1: Various approaches to measuring similarity grouped in classes. The concepts used in the above formulas:
c
1
,c
2
– compared concepts; IC = −logp(c) – Information Content; C
MICA
– most informative common ancestor; p(C
A
) –
probability of c occurring in a specific corpus, estimated by frequency of annotation; CDA – Common disjunctive ances-
tor; W
k1
,W
k2
– fuzzy membership matrix of graph G; Pr[c
k
] =
∑
t
j
∈C
(W
k j
·|t
j
|)
|U |
; Pr[c
i
|c
k
] =
∑
t
j
∈C
(min(W
i j
,W
k j
)·|t
j
|)
∑
t
j
∈C
(W
k j
·|t
j
|)
; r
j
i
– denote
the rank of sense s
i
∈ S in signature j; α – variable representing possible asymmetric similarity relation; S
neighb
(c
1
,c
2
) =
max
i∈R
|c
1i
∩c
2i
|
|c
1i
∪c
2i
|
; S
descr
(c
1
,c
2
) =
|c
1
∩c
2
|
|c
1
∪c
2
|
; S
w
,S
u
,S
z
are respectively the measure of the similarity between synonym sets, fea-
tures and semantic neighbourhoods among classes c
1
of ontology p and classes c
2
of ontology q; SP – shortest path relating
concepts;
~
P – vector representation of measured concepts; δ(a, b) – number of edges on the shortest path between a and b. l –
shortest path between concepts;; h – depth of the subsumer in the hierarchy; α,β – parameters scaling the contribution of l and
h; Depth – the depth of the taxonomy; C,k – constants derived throughout experiments; d – the number of changes of direction
in the path that relates c
1
and c
2
; N1,N2 – the distances that separates c1 and c2 from the root node; N – the distance between
closest common ancestor of C1 and c2 from the root node; PF(c
1
,c
2
) = (1 −λ)(Min(N1, N2) −N) + λ(|N1 −N2|+ 1)
−1
and λ is a boolean coefficient; SV (c) =
∑
t∈T
c
S
c
(t); Ans(C1), Ans(C2) – description sets of terms C1 and C2 respectively.
Class Method Formula
Node Based
1. Resnik (Resnik, 1995) Sim
Res
(c
1
,c
2
) = IC(c
M I CA
)
2. Lin (Lin et al., 1998) Sim
L
(c
1
,c
2
) =
2·IC(c
MICA
)
IC(c
1
)+IC(c
2
)
3. Jiang (Jiang and Conrath, 1997) Sim
JC
(c
1
,c
2
) = 1 −IC(c
1
) + IC(c2) −2 ·IC(c
M I CA
)
4. Schlicker (Schlicker et al., 2006) Sim
Rel
(c
1
,c
2
) = Sim
L
(c
1
,c
2
) ·(1 − p(c
A
))
5. GraSM (Couto et al., 2005) Sim
G
(c
1
,c
2
) = {IC(a)|a ∈CDA(c
1
,c
2
)}
6. ADW (Pilehvar et al., 2013) Sim
ADW
=
∑
|S|
i=1
(r
1
i
+r
2
i
)
−1
∑
|S|
i=1
(2i)
−1
7. Maguitman (Maguitman et al., 2005) Sim
M
(c
1
,c
2
) = max
k
2·min(W
k1
,W
k2
)·logPr[c
k
]
log(Pr[c
1
|c
k
]·Pr[c
k
])+log(Pr[c
2
|c
k
]·Pr[c
k
])
Feature
8. Tversky (Tversky, 1977) Sim
T
(c
1
,c
2
) =
|c
1
∩c
2
|
|c
1
∩c
2
|+α|c
1
−c
2
|+(α−1)|c
2
−c
1
|
9. X-similarity (Petrakis et al., 2006) Sim
x
(c
1
,c
2
) =
1 if S
syns
> 0
maxS
neig
(c
1
,c
2
),S
desc
(c
1
,c
2
) if S
syns
= 0
10. Rodriguez (Rodríguez and Egenhofer, 2003) Sim
R
(c
p
1
,c
q
2
) = W
w
S
w
(c
p
1
,c
q
2
) +W
u
S
u
(c
p
1
,c
q
2
) +W
n
S
n
(c
p
1
,c
q
2
)
Edge Based
11. Rada (Rada et al., 1989) Sim
SP
(c
1
,c
2
) = 2 ·Max(c
1
,c
2
) −SP
12. Pozo (Del Pozo et al., 2008) Sim(GO
i
,GO
j
) = cos(
~
P
i
,
~
P
j
) =
~
P
i
∗
~
P
j
|
~
P
i
||
~
P
j
|
13. Wu et al. (Wu and Palmer, 1994) Sim
WU
(L
s
,L
t
) = max
L
s
∈V
s
,L
t
∈V
t
the number of common
terms betweenL
s
andL
t
14. Pekar (Pekar and Staab, 2002) Sim
PS
(c
1
,c
2
) =
δ(c
a
,root)
δ(c
a
,root)+δ(c
1
,c
a
)+δ(c
2
,c
a
)
15. Richardson (Richardson et al., 1994) Sim
Rich
(c
1
,c
2
) = max
c
i
log
1
P(c
i
)
16. Li et al. (Li et al., 2003) Sim
Li
(c
1
,c
2
) = e
−αl
e
βh
−e
−βh
e
βh
+e
−βh
i f c
1
6= c
2
17. IntelliGO (Benabderrahmane et al., 2010) Sim
Int
(c
1
,c
2
) =
~
(c
1
)∗
~
(c
2
)
q
~
(c
1
)∗
~
(c
1
)
√
~
(c
2
)∗
~
(c
2
)
18. Leacock (Leacock, 1994) Sim
L&C
(c
1
,c
2
) = −log
SP
2·Depth
19. HSO (Hirst et al., 1998) Sim
HSO
(c
1
,c
2
) = C −SP −k ·d
20. Wu (Wu et al., 2005) Sim
wup
(c
1
,c
2
) =
2·N
N1+N2+2·N
21. TBK (Slimani et al., 2006) Sim
T BK
(c
1
,c
2
) =
2·N
N1+N2
·PF(c
1
,c
2
)
Hybrid
22. Othman (Othman et al., 2008) Sim
O
(c
1
,c
2
) = 1 −min{1,
dist(c
1
,c
2
)
maxIC(c)
}
23. Wang (Wang et al., 2007) Sim
W
(c
1
,c
2
) =
∑
t∈T
c
1
∩T
c
2
(S
c
1
(t)+S
c
2
(t))
SV (c
1
)+SV (c
2
)
24. Knappe (Knappe et al., 2003) Sim
K
(c
1
,c
2
) = p ·
|Ans(c
1
)∩Ans(c
2
)|
|Ans(c
1
)|
+ (1 −p) ·
|Ans(c
1
)∩Ans(c
2
)|
|Ans(c
2
)|
25. Zhou (Zhou et al., 2008)
Sim
Z
(c
1
,c
2
) = 1 −k(
ln(len(c
1
,c
2
)+1
ln(2·(deep
max
−1))
)
−(1 −k) ·((IC(c
1
) + IC(c
2
) −2 ·IC(
lso(c
1
,c
2
))
2
)
Semantic
26. MP (Fähndrich et al., 2016) Sim
M P
(c
1
,c
2
) =
t
max
∑
t=0
∑
x∈V
φ( ˆa
∗
t
(x),c
1
,c
2
)
∑
∀w∈V
a
0
(w)
KEOD 2020 - 12th International Conference on Knowledge Engineering and Ontology Development
160
NLP
GO AI
Document RankingAutomatic Translation
Information RetrievalUniversal
Psychology Word Net
Word Similarity Web Search
8
Feature Based
Node Based
Edge Based
Hybrid
Semantic
1977 1989 1993 1994 1998 2003 2006 2013 20162008 2010
9
10
26
6
11
1
3
2
13
15
18
19
14
16
20
21
12
17
25
24
23
22
4
5
7
Figure 1: Evolution and influence relations among the classified methods.
the methods however perform well only in ideal con-
ditions where quality of data is very good – an exam-
ple of such a method is the one presented in (Schlicker
et al., 2006) – or by definition contain a significant
bias of symmetry. A good example of such bias is the
Li et al. measure where the asymmetric nature of the
similarity relation is consciously not considered (Li
et al., 2003). Such features should be thus taken into
consideration when selecting a method.
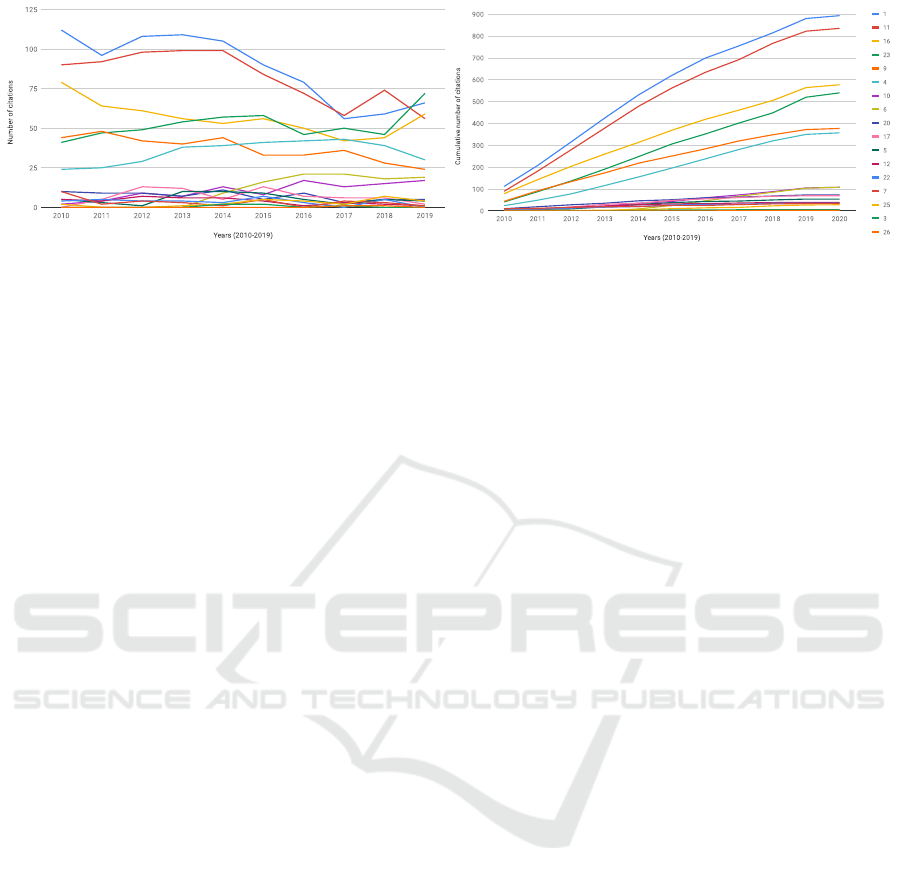
3.3 Bibliometric Analysis
For the works analyzed in this paper, based on the
data from the Scopus bibliometric database, in Fig-
ure 2, we present two charts with the distribution of
citations to these works. It is easy to notice that two
works (Wang et al., 2007; Li et al., 2003) have been
recently increasingly cited. They fall into the cat-
egories of edge-based and hybrid approaches. On
the other hand, from the cumulative citation chart
one can observe that apart from the two mentioned
works there are other pairs of highly cited papers –
the classic edge-based (Rada et al., 1989) and node-
based (Resnik, 1995) approaches from 90’, which still
gain attention as the base for the newly developed
methods, as well as the feature-based (Rodríguez and
Egenhofer, 2003) and node-based (Schlicker et al.,
2006) methods, which provided foundations for mod-
ern semantic similarity measures.
4 AN INTERACTIVE
HISTORICAL ATLAS FOR
RESEARCH METHODS
To facilitate the literature review, we propose to use
a simple tool based on a concept of a historical at-
las. Management and visualization of historical data
that concern multiple actors, events and references is
a specific problem that can be used to alleviate the
acquisition of large collections of knowledge. One
of the main intentions of the tool is to keep the data
model general enough to be analyzed from different
points of views and used for different visualizations
(e.g., chronology, spatial map or dependency graph).
We adopted an assumption that the tool should be in-
tuitive even for a non-technical researcher and the per-
formance should allow real-time work with data. Al-
though the architecture of the tool uses a web browser,
the tool can also work offline.
4.1 Representation of the Methods as
Historical Literature
Similarity methods and papers about them can be con-
sidered as a part of literature history which could be
easily visualized with interactive historical atlas de-
scribed earlier. Methods, articles and authors have
been modelled as part of a historical atlas data model
where methods and authors are recognized as specific
Tracing the Evolution of Approaches to Semantic Similarity Analysis
161
(a) in each year
OLD Authors 2010 2011 2012 2013 2014 2015 2016 2017 2018 2019 2020
[24] 1 Resnik P. 112 208 316 425 530 620 699 755 814 880 893
[23] 11
Rada R., Mili H., Bicknell E., Blettner M.
90 182 280 379 478 562 634 692 766 822 835
[16] 16
Li Y., Bandar Z.A., McLean D.
79 143 204 260 313 369 419 461 505 564 577
[30] 23
Wang J.Z., Du Z., Payattakool R., Yu P.S., Chen C.-F.
41 88 137 191 248 306 352 402 448 520 540
[26] 9
Rodriguez M.A., Egenhofer M.J.
44 92 134 174 218 251 284 320 348 372 377
[27] 4
Schlicker A., Domingues F.S., Rahnenfuhrer J., Lengauer T.
24 49 78 116 155 196 238 281 320 350 357
[21] 10
Petrakis E.G.M., Varelas G., Hliaoutakis A., Raftopoulou P.
2 6 15 22 35 43 60 73 88 105 108
[22] 6
Pilehvar M.T., Jurgens D., Navigli R.
0 0 0 0 9 25 46 67 85 104 108
[31] 20
Wu H., Su Z., Mao F., Olman V., Xu Y.
10 19 28 35 46 51 60 63 68 73 73
[6] 17
Benabderrahmane S., Smail-Tabbone M., Poch O., Napoli A., Devignes M.
0 5 18 30 35 48 55 61 67 69 69
[8] 5
Couto F.M., Silva M.J., Coutinho P.M.
5 8 9 19 29 38 43 45 50 54 54
[9] 12
del Pozo A., Pazos F., Valencia A.
5 9 16 22 28 32 33 36 38 39 39
[19] 22
Othman R.M., Deris S., Illias R.M.
4 9 13 17 20 27 30 30 35 35 35
[18] 7
Maguitman A.G., Menczer F., Erdinc F., Roinestad H., Vespignani A.
10 12 16 19 20 25 25 29 32 33 33
[34] 25
Zhou Z., Wang Y., Gu J.
2 2 2 3 5 10 14 16 23 27 28
[13] 3
Jiang J., Conrath D.
0 0 0 0 2 4 4 5 5 5 5
[11] 26
Fahndrich J., Weber S., Ahrndt S.
0 0 0 0 0 0 0 1 2 2 2
(b) cummulative
Figure 2: Number of citations of the state-of-the-art papers in the field (based on the data from the Scopus database).
types of the same general “event” concept and articles
are “references” for methods. This approach allows to
connect methods through influence relationship and
attach a number of papers to methods and authors.
Data prepared according to this model can be then
visualized in our application. The front-end of the
tool uses data from back-end endpoint provided by
user in online mode or from uploaded file with data
encoded in JSON format. For our research, we have
prepared data instances describing the analyzed meth-
ods (the data is available on the tool website). Below
we present a snippet with Node Based – Information
Content method and example of influence relation-
ship with indeterminate “test” method.
{ "nodes": [{
"label": "Author",
"name": "Philip Resnik",
"id": "author-resnik"
},{
"label": "Method",
"name": "Node-based -
Information Content",
"description": "The method uses
shared information content...",
"id": "method-IC"
},{
"label": "Reference",
"title": "Semantic Similarity in a
Taxonomy: An...",
"id": "resnik1999semantic"
},
"edges": [{
"from": "author-resnik",
"to": "method-IC",
"label": "AUTHOR"
},{
"from": "method-IC",
"to": "method-test",
"label": "INFLUENCED"
}]}
For chronology view, all the method’s details and
the related articles’ titles should be stored in one array,
and the information about the authors can be omit-
ted. Below the same example method encoded with
additional start and end dates of method, where the
start date is the year of publication and the end date
is the year of the publication of the latest influenced
method.
{ "events": [{
"id": "method-IC",
"content": "Node-based
- Information Content",
"start": "1990-01-01",
"end": "2006-01-01",
"description": "The method
uses shared information...",
"references" : ["Semantic
Similarity in a Taxonomy..."]
}]}
4.2 Implementation of the Atlas
The front-end of the application has been developed
as an interactive website with scripts implemented
in JavaScript. The project uses two third-party li-
braries: vis-network and vis-timeline, dual licensed
under The Apache 2.0 and MIT License. For depen-
dency management npm Software Registry was used.
The source code of the application and the sample
data is available at: https://anonymous.4open.science/
r/95f844e7-afb8-4876-b27e-1e48d56907a6/.
The application allows users to upload files with
data encoded in format presented earlier or use an on-
line mode in which it is possible to set the already de-
ployed endpoint with data and then receive it from the
server. Navigating to graph or chronology page, the
user can see the data in a selected view (see Fig. 3, 4).
As the natural relationships between papers, au-
thors and methods can be modelled and visualized as
a graph or using a simplified chronology, we believe
that the proposed tool can be useful for researchers
in various domains. The flexible model, based on an
“event” entity easily captures any phenomena occur-
ring in time and the interactive visualizations help in
analysis of the state-of-the-art.
KEOD 2020 - 12th International Conference on Knowledge Engineering and Ontology Development
162
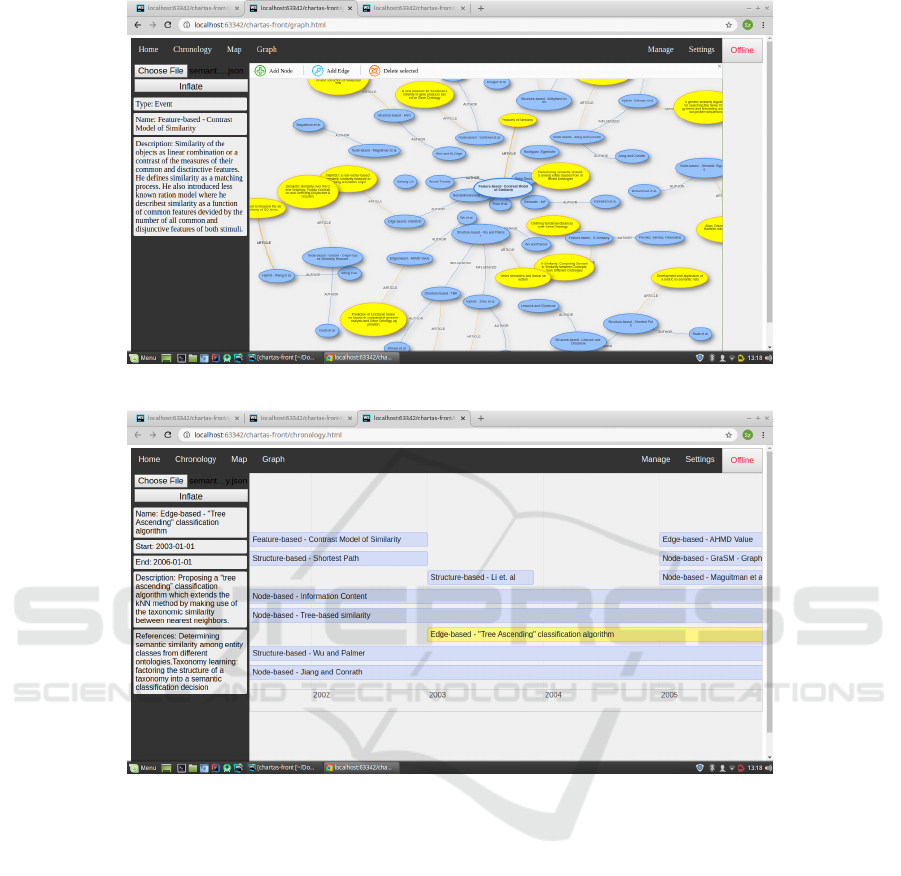
Figure 3: Screenshot of semantic similarity methods graph visualization.
Figure 4: Screenshot of semantic similarity methods chronology visualization.
5 CONCLUSION
Semantic similarity of concepts, objects or words,
described with some degree of formalization can be
quantified in different ways. The semantics itself may
be defined based on features or geometrical properties
of the underlying knowledge base. In this paper, we
have reviewed existing approaches to semantic simi-
larity analysis and presented different metrics within
a simple ontology. We have analyzed how the ap-
proaches evolved in time and in which application do-
mains they have been used. We formalized their inter-
relatedness with a graph-based model, and provided a
tool that can facilitate literature review of any topic.
For future, we plan to further enrich the methods’ on-
tology with new instance and possibly relations, and
extend the tool with more analytical capabilities.
REFERENCES
Adrian, W. T. and Manna, M. (2018). Navigating online
semantic resources for entity set expansion. In Cal-
imeri, F., Hamlen, K., and Leone, N., editors, Prac-
tical Aspects of Declarative Languages, pages 170–
185, Cham. Springer International Publishing.
Agirre, E., Barrena, A., and Soroa, A. (2015). Studying the
wikipedia hyperlink graph for relatedness and disam-
biguation. arXiv preprint arXiv:1503.01655.
Agirre, E., Cuadros, M., Rigau, G., and Soroa, A. (2010).
Exploring knowledge bases for similarity. In LREC.
Antunes G. et al. (2015). The process model matching con-
test 2015. In Proc. of the 6th Intl. Workshop on En-
terprise Modelling and Information Systems Architec-
tures, September 3-4, 2015 Innsbruck, Austria, vol-
ume 248, pages 127–155, Bonn.
Attneave, F. (1950). Dimensions of similarity. The Ameri-
can journal of psychology, 63(4):516–556.
Tracing the Evolution of Approaches to Semantic Similarity Analysis
163

Benabderrahmane, S., Smail-Tabbone, M., Poch, O.,
Napoli, A., and Devignes, M.-D. (2010). Intel-
ligo: a new vector-based semantic similarity mea-
sure including annotation origin. BMC bioinformat-
ics, 11(1):588.
Cayoglu U. et al. (2014). Report: The process model
matching contest 2013. In Lohmann, N., Song, M.,
and Wohed, P., editors, Business Process Management
Workshops, pages 442–463, Cham. Springer Interna-
tional Publishing.
Couto, F. M., Silva, M. J., and Coutinho, P. M. (2005). Se-
mantic similarity over the gene ontology: family cor-
relation and selecting disjunctive ancestors. In Proc.
of the 14th ACM int. conf. on Information and knowl-
edge management, pages 343–344.
Del Pozo, A., Pazos, F., and Valencia, A. (2008). Defining
functional distances over gene ontology. BMC bioin-
formatics, 9(1):50.
Dumas, M., García-Bañuelos, L., and Dijkman, R. M.
(2009). Similarity search of business process models.
IEEE Data Eng. Bull., 32(3):23–28.
Fähndrich, J., Weber, S., and Ahrndt, S. (2016). Design and
use of a semantic similarity measure for interoperabil-
ity among agents. In German Conference on Multia-
gent System Technologies, pages 41–57. Springer.
Hirst, G., St-Onge, D., et al. (1998). Lexical chains as rep-
resentations of context for the detection and correc-
tion of malapropisms. WordNet: An electronic lexical
database, 305:305–332.
Jiang, J. J. and Conrath, D. W. (1997). Semantic similarity
based on corpus statistics and lexical taxonomy. arXiv
preprint cmp-lg/9709008.
Knappe, R., Bulskov, H., Andreasen, T., and Kaynak, O.
(2003). On similarity measures for content-based
querying. In 10th International Fuzzy Systems Associ-
ation World Congress, IFSA, pages 400–403. Citeseer.
Leacock, C. (1994). Filling in a sparse training space for
word sense identification. Ph. D. thesis, Macquarie
University.
Li, Y., Bandar, Z. A., and McLean, D. (2003). An approach
for measuring semantic similarity between words us-
ing multiple information sources. IEEE Transactions
on knowledge and data engineering, 15(4):871–882.
Likavec, S., Lombardi, I., and Cena, F. (2019). Sigmoid
similarity-a new feature-based similarity measure. In-
formation Sciences, 481:203–218.
Lin, D. et al. (1998). An information-theoretic definition of
similarity. In Icml, volume 98, pages 296–304.
Maguitman, A. G., Menczer, F., Roinestad, H., and Vespig-
nani, A. (2005). Algorithmic detection of semantic
similarity. In Proceedings of the 14th international
conference on World Wide Web, pages 107–116.
Othman, R. M., Deris, S., and Illias, R. M. (2008).
A genetic similarity algorithm for searching the
gene ontology terms and annotating anonymous pro-
tein sequences. Journal of biomedical informatics,
41(1):65–81.
Pekar, V. and Staab, S. (2002). Taxonomy learning-
factoring the structure of a taxonomy into a semantic
classification decision. In COLING 2002: The 19th
Int. Conference on Computational Linguistics.
Petrakis, E. G., Varelas, G., Hliaoutakis, A., and
Raftopoulou, P. (2006). X-similarity: Computing se-
mantic similarity between concepts from different on-
tologies. Journal of Digital Information Management,
4(4).
Pilehvar, M. T., Jurgens, D., and Navigli, R. (2013). Align,
disambiguate and walk: A unified approach for mea-
suring semantic similarity. In Proc. of the 51st An-
nual Meeting of the Association for Computational
Linguistics (Vol. 1), pages 1341–1351.
Rada, R., Mili, H., Bicknell, E., and Blettner, M. (1989).
Development and application of a metric on semantic
nets. IEEE transactions on systems, man, and cyber-
netics, 19(1):17–30.
Resnik, P. (1995). Using information content to evaluate se-
mantic similarity in a taxonomy. arXiv preprint cmp-
lg/9511007.
Richardson, R., Smeaton, A., and Murphy, J. (1994). Using
wordnet as a knowledge base for measuring semantic
similarity between words.
Rodríguez, M. A. and Egenhofer, M. J. (2003). Determining
semantic similarity among entity classes from differ-
ent ontologies. IEEE transactions on knowledge and
data engineering, 15(2):442–456.
Schlicker, A., Domingues, F. S., Rahnenführer, J., and
Lengauer, T. (2006). A new measure for functional
similarity of gene products based on gene ontology.
BMC bioinformatics, 7(1):302.
Slimani, T., Yaghlane, B. B., and Mellouli, K. (2006). A
new similarity measure based on edge counting. Pro-
ceedings of the World Academy of Science, Engineer-
ing and Technology, 17:3.
Tversky, A. (1977). Features of similarity. Psychological
review, 84(4):327.
Wang, J. Z., Du, Z., Payattakool, R., Yu, P. S., and Chen,
C.-F. (2007). A new method to measure the semantic
similarity of go terms. Bioinformatics, 23(10):1274–
1281.
Wu, H., Su, Z., Mao, F., Olman, V., and Xu, Y. (2005).
Prediction of functional modules based on compara-
tive genome analysis and gene ontology application.
Nucleic acids research, 33(9):2822–2837.
Wu, Z. and Palmer, M. (1994). Verbs semantics and lexical
selection. In Proceedings of the 32nd annual meeting
on Association for Computational Linguistics, pages
133–138. Association for Computational Linguistics.
Zbroja, S. and Lig˛eza, A. (2001). Case-based reasoning
within tabular systems. extended structural data rep-
resentation and partial matching. In Flexible Query
Answering Systems, pages 230–239. Springer.
Zhou, Z., Wang, Y., and Gu, J. (2008). New model of se-
mantic similarity measuring in wordnet. In 2008 3rd
Int. Conference on Intelligent System and Knowledge
Engineering, volume 1, pages 256–261. IEEE.
Zhu, G. and Iglesias, C. A. (2018). Exploiting semantic
similarity for named entity disambiguation in knowl-
edge graphs. Expert Systems with Applications,
101:8–24.
KEOD 2020 - 12th International Conference on Knowledge Engineering and Ontology Development
164
