
Diverse Group Formation based on Multiple Demographic Features
Mohammed Alqahtani, Susan Gauch, Omar Salman, Mohammed Ibrahim and Reem Al-Saffar
Department of Computer Science, University of Arkansas, Fayetteville, AR, U.S.A
Keywords: Information Retrieval, Team Formation, Diversity Team Formation.
Abstract: The goal of group formation is to build a team to accomplish a specific task. Algorithms are employed to
improve the effectiveness of the team so formed and the efficiency of the group selection process. However,
there is concern that team formation algorithms could be biased against minorities due to the algorithms
themselves or the data on which they are trained. Hence, it is essential to build fair team formation systems
that incorporate demographic information into the process of building the group. Although there has been
extensive work on modeling individuals’ expertise for expert recommendation and/or team formation, there
has been relatively little prior work on modeling demographics and incorporating demographics into the group
formation process.
We propose a novel method to represent experts’ demographic profiles based on multidimensional
demographic features. Moreover, we introduce two diversity ranking algorithms that form a group by
considering demographic features along with the minimum required skills. Unlike many ranking algorithms
that consider one Boolean demographic feature (e.g., gender or race), our diversity ranking algorithms
consider multiple multivalued demographic attributes simultaneously. We evaluate our proposed algorithms
using a real dataset based on members of a computer science program committee. The result shows that our
algorithms form a program committee that is more diverse with an acceptable loss in utility.
1 INTRODUCTION
Different research areas have investigated the process
of team formation with the goal of forming an
innovative team. One key to a successful team is
having qualified and collaborative team members
who work as a team to achieve all tasks (Brocco,
Hauptmann, & Andergassen-Soelva, 2011) (Lappas,
Liu, & Terzi, 2009). Other systems build the team
based on the social network in which they claimed
that the quality of relationship could influence the
success of the team (Lappas, Liu, & Terzi, 2009).
Most of those systems focused on the expertise and
the strength of the experts’ relationship. In addition,
there are several algorithms try to automate the
process of recommending members to join the group,
however, these methods can involve bias (Feldman,
Friedler, Moeller, Scheidegger, &
Venkatasubramanian, 2015) (Kamishima, Akaho, &
Sakuma, 2011) (Zehlike, et al., 2017).
The issue of bias has been discovered in different
areas in everyday life, industry, and academia. In
academia, different studies investigated this issue and
presented several features that considered as potential
sources of bias. Those features are gender
(Bornmann & Daniel, 2005) (Lerback & Hanson,
2017), ethnicity (Gabriel, 2017), geolocation
(Murray, et al., 2019), career stage (Holman, Stuart-
Fox, & Hauser, 2018) (Lerback & Hanson, 2017), and
institution impact (Bornmann & Daniel, 2005).
These biases can affect peer review, tenure and
promotion, and career advancement. Some work has
been done to address in the issue of bias by
developing fair algorithms based on a single feature
at a time, either gender or ethnicity (Zehlike, et al.,
2017). However, in our study, we evaluate algorithms
that incorporate multiple demographic features
(gender, ethnicity, geolocation, career stage, and
institution impact), that believed to be the main
source of bias in academia.
In our research, we focus on the issue of bias in
conference program committee (PC) formation.
Because of its importance in career advancement,
there have been several efforts to make the peer
review process more transparent and less susceptible
to various types of bias. One recommendation to
reduce unfairness is to introduce diversity (Hunt,
Layton, & Prince, 2015) amongst the reviewers that,
Alqahtani, M., Gauch, S., Salman, O., Ibrahim, M. and Al-Saffar, R.
Diverse Group Formation based on Multiple Demographic Features.
DOI: 10.5220/0010106301690178
In Proceedings of the 12th International Joint Conference on Knowledge Discovery, Knowledge Engineering and Knowledge Management (IC3K 2020) - Volume 1: KDIR, pages 169-178
ISBN: 978-989-758-474-9
Copyright
c
2020 by SCITEPRESS – Science and Technology Publications, Lda. All rights reserved
169

in the case of a conference, begins with increasing the
diversity of the PC. Increasing diversity can also
enhance the work outcomes and produces a positive
influence on scientific performance (AlShebli,
Rahwan, & Woon, 2018).
It is clear that there is a lack of diversity within
Computer Science as a whole. For example, fewer
than 27% CS professionals are female and whites
dominate more than 65% of CS professionals (Khan,
Robbins, & Okrent, 2020). This lack of diversity is
reflected in participation in conferences (Holman,
Stuart-Fox, & Hauser, 2018) and in the members of
the program committees that govern academic
conferences in Computer Science (Lerback &
Hanson, 2017). Addressing this, SIGCHI, one of the
highest impact ACM conferences, announced an
explicit goal to increase the diversity of their PC in
2020 (SIGCHI, 2019).
To this end, we study the problem of introducing
diversity in the process of algorithmically forming a
group. We introduce a demographic profile for the
candidate experts based on the multiple features
(gender, ethnicity, geolocation, career stage, and
institution impact). Although our algorithms should
be applicable to any team formation domain, we
currently focus on conference program committee
formation. We introduce and assess two approaches
to selecting candidates to join a PC based on their
demographic features, considering candidates whose
paper has been accepted by the conference in
previous years to have the minimum expertise
necessary to join the PC. The main contributions of
this paper are:
Develop expert demographic profiles that
consist of multiple features.
Develop and assess algorithms to form a group
based on diversity.
2 RELATED WORK
We begin by reviewing previous work in
demographic user modeling and group formation
approaches and then discuss several aspects related to
the issue of bias.
2.1 Demographic Information
User profiles are an integral part of all work into
personalization (Gauch, et al., 2007); one can't create
frameworks that adjust to an individual without
having an accurate model of the user’s abilities and
needs. Numerous investigations have demonstrated
the importance of incorporating demographic
features when developing automated frameworks to
select choices for individuals (Khalid, Salim, Loke, &
Khalid, 2011). However, online profiles ordinarily
choose to not collect this data since clients are
frequently worried about how such data might be
utilized. Thus, in order to utilize demographic
information to ensure fairness and anti-discrimination
in their algorithms, organizations often, infer features
such as gender, nationality, and ethnicity based on the
user’s name (Chandrasekaran, Gauch, Lakkaraju, &
Luong, 2008).
The determination of which demographic features
to include varies from one environment to another. In
academia, for instance, demographic profiling
typically considers features such as ethnicity, age,
gender, race, and socioeconomic background
(Cochran-Smith & Zeichner, 2009). There have been
several approaches to extract demographic
information, specifically gender and ethnicity (Dias
& Borges, 2017) (Michael, 2007). However, in our
research, we use an NamSor API used by Jain et al
(Jain & Minni, 2017) to extract gender based on the
user’s names. This tool covers more than 142
languages and the overall gender precision and recall
of this tool are respectively 98.41% and 99.28%
(blog, NamSor, 2018).
2.2 Group Formation
One key to a successful organization is having a good
leader and collaborative group who work as a team to
achieve all tasks (Wi, Oh, Mun, & Jung, 2009). Based
on this insight, several automatic team formation
methods have been proposed to form groups based on
a social network (Lappas, Liu, & Terzi, 2009)
(Owens, Mannix, & Neale, 1998). (Juang, Huang, &
Huang, 2013) (Wi, Oh, Mun, & Jung, 2009) (Brocco,
Hauptmann, & Andergassen-Soelva, 2011).
However, considering social network relationships
may result in bias. To address this, Chen et al. (Chen,
Fan, Ma, & Zeng, 2011) proposed a genetic grouping
algorithm to automatically construct a group of
reviewers that balances inclusion based on age,
region, or professional title. We take a similar
approach in our study; however, we form a group of
candidates with respect to five demographic features
simultaneously.
Several projects on group formation have focused
specifically on academia. For instance, Wang et al.
(Wang, Lin, & Sun, 2007) introduced DIANA
algorithms that consider several parameters to build a
group of students. Tabo et al. (Tobar & de Freitas,
2007) proposed a method to create a team for
KDIR 2020 - 12th International Conference on Knowledge Discovery and Information Retrieval
170

academic duties within a class. Although these
methods automate the procedure of recommending a
candidate to be a member of the team, because they
do not specifically incorporate demographic
modeling, those approaches may lead to bias.
2.3 Fairness
Fairness necessitates that underrepresented groups
should have the same access to opportunities as the
population as a whole (Zehlike, et al., 2017). Hence,
(Feldman, Friedler, Moeller, Scheidegger, &
Venkatasubramanian, 2015) investigated the problem
of unintentional bias and how it impacts various
populations that should be treated similarly.
Fairness in Machine Learning. With the increased
use of machine learning in many aspects of everyday
life, there is increasing concern that these systems
make decisions in an unbiased way (Asudeh,
Jagadish, Stoyanovich, & Das, 2019) (Feldman,
Friedler, Moeller, Scheidegger, &
Venkatasubramanian, 2015). Several investigations
have demonstrated that, although classifiers
themselves are generally not biased, the outcome of
those classifiers may be affected by the bias in the
training data (Feldman, Friedler, Moeller,
Scheidegger, & Venkatasubramanian, 2015)
(Kamishima, Akaho, & Sakuma, 2011) (Asudeh,
Jagadish, Stoyanovich, & Das, 2019). In response,
(Zemel, Wu, Swersky, Pitassi, & Dwork, 2013)
derived a learning algorithm for fair classification by
providing suitable data representation and at the same
time obfuscating any data about membership in a
protected group.
Bias in Academia. The issue of bias in academia has
been well studied. Gabriel (Gabriel, 2017) presents a
study that demonstrates that ethnicity discrimination
still exists in British academia. As an example, black
professors represent only 0.1% of all professors in the
UK although they constitute up to 1.45% of the UK
population. Bornmann et al (Bornmann & Daniel,
2005) investigated the impact of bias on the process
of selecting doctoral and post-doctoral members.
They found evidence of bias based on gender, area of
research, and affiliation, but not nationality.
Bias in Peer Review. The peer review process is one
of the most-studied areas of research into bias in
academia. Lee et al. (Lee, Sugimoto, Zhang, &
Cronin, 2013) studied different kinds of bias in peer
review and how it impacts the review process of
accepting or rejecting submitted articles. (Holman,
Stuart-Fox, & Hauser, 2018) and (Lerback & Hanson,
2017) provided evidence that females are persistently
underrepresented in publications from computer
science, math, physics, and surgery. This was further
confirmed by (Murray, et al., 2019) They found
evidence that a reviewer is more likely to accept
publications by authors of the same gender and from
the same country as themselves. Hence, many
publications and conferences have adopted a double-
blind review to avoid this type of bias. However,
several studies show that 25–40% of the time,
reviewers can recognize authors (Baggs, Broome,
Dougherty, Freda, & Kearney, 2008) (Justice, Cho,
Winker, & Berlin, 1998), which can lead to bias. Lane
(Lane D. , 2008) suggest that within specific fields,
these numbers could be higher.
In order to address the issue of bias in academia,
Yin et al. (Yin, Cui, & Huang, 2011) studied the
relationships between bias and three features: the
reviewer’s reputation, the co-authorship connection,
and the coverage. They suggested that to avoid biased
results, one should ensure diversity in the peer review
committee itself. Other studies by (Wang, et al.,
2016) (Lane T. , 2018) (Chen, Fan, Ma, & Zeng,
2011) suggested that increasing the diversity in a peer
review committee will enhance the review process
and lead to better outcomes.
To summarize, bias exists within academia even
though the research community has taken strides to
avoid it. Several studies indicate that increasing
diversity when forming a group can enhance its
quality of work and produce fairer results. Most
current approaches concentrate on a single protected
feature at a time, e.g., gender or race. However, in our
research, we contribute to this research area by
developing algorithms that consider multiple features
simultaneously.
3 DEMOGRAPHIC PROFILE
MODELING
In this section, we present how we collect our
demographic data collection process (3.1). Then, we
describe how we determine the protected groups and
the procedure of mapping our demographic data to
Boolean weighted features (3.2).
3.1 Data Collection
Our demographic profile consists of five features that
have been identified as potential sources of bias in
academia, to whit Gender, Ethnicity, Geolocation,
University Rank, and Career Stage. For each
researcher in our pool of PC candidates we use
publicly accessible information to collect their
Diverse Group Formation based on Multiple Demographic Features
171

demographic data. We collected this information
using web-scraping scripts that we developed to
automate the process. The following explains our
method of collecting each of the demographic feature
values: Gender: We determine the gender of each
scholar using NamSor (NamSor, 2020), a tool that
predicts gender based on an individual’s full name. It
also returns the degree of confidence in the prediction
in a range between 0 and 1 NamSor gender API has
an overall 98.41% precision and 99.28% recall (blog,
NamSor, 2018). Additionally, the NamSor inventor
used official directory of the European union (Union,
European, 2020) to assess the NamSor API gender for
European names. The gender error rate was only less
than 1%. Ethnicity: We determine the ethnicity of
each scholar using NamSor (NamSor, 2020), a tool
used to extract the ethnicity of an individual based on
that individual’s full name. For each name, they
return the most likely ethnicity from a set of 5
possibilities, e.g., W_NL (for White), or B_NL (for
Black). NamSor is widely used to predict ethnicity
and gender in other studies Geolocation: The location
is obtained using a scholar profile in Google Scholar
(Google Scholar, 2020). We extract the university
name at which each scholar works. Then, we use that
information to locate the university’s home page and,
from that, determine the country in which they work.
Additionally, for those in the United States, we also
extract the state in which they work. University
Rank: Using the university name extracted above, we
use the Times Higher Education (Education, Times
Higher, 2020) to determine the university’s rank. This
site produces ranks for each institution between 1 to
1400, so we use the value 1401 for unranked
universities. Career Stage: We extract the academic
position of each scholar using their profile in Google
Scholar (Google Scholar, 2020). H-index: We also
collect the h-index from the scholar’s Google Scholar
profile (Google Scholar, 2020) and use this feature to
measure the utility of the various PCs. Note:
Candidate PC members without a Google Scholar
profile, and those without academic positions, are
omitted from our dataset.
3.2 Mapping Boolean Weights
Factors such as culture and environment may affect
the definition of protected groups, (Feldman, Friedler,
Moeller, Scheidegger, & Venkatasubramanian,
2015). However, our definition of protected groups is
based on which group is underrepresented in the
population being studied, i.e., researchers in
Computer Science. Each feature in a scholar’s profile
is represented using a Boolean weight, typically 1 if
the scholar is a member of the protected
(underrepresented) group and 0 otherwise. The
following illustrates how we determine the values of
each feature:
Gender. Females make up 27% of professionals in
Computer Science in 2017 (Khan, Robbins, &
Okrent, 2020), so they are the protected group.
Ethnicity: In computer science and engineering,
whites make up the majority of professionals at 65%
(Khan, Robbins, & Okrent, 2020), so non-white
ethnicities other ethnicities are considered the
protected group.
Geolocation: In this feature, we utilize the GDP
(Gross Domestic Production) retrieved from World
Development Indicators database (Worldbank, 2018)
to divide the countries into developing or developed.
We compute the average world GDP and then employ
this to partition the values of this feature into a
developing country for those who below the average
and developed country otherwise. The developing
country is our protected group. For those who live in
the United States, we use the Established Program to
Stimulate Competitive Research (EPSCoR)
designation (Foundation, National Science, 2019)
developed by the NSF (National Science
Foundation). EPSCoR states, those with less federal
grant funding, are the protected group.
University Rank: Based on the rankings provided by
(Education, Times Higher, 2020), we use the mean to
partition university ranks into low-ranked and high-
ranked groups and use low-ranked universities
(higher values) as the protected group.
Career Stage: We consider tenured faculty, those
who are associated professor or higher as senior;
otherwise they are considered junior and consider.,
junior researchers as our protected group.
Algorithm 1: Univariate Greedy.
1. priority_queue ← Initialize an empty queue
2. For each profile:
3. Diversity score ← compute profile score
4. Add profile to priority_queue using
diversity score as priority order
5. candidates ← Select N profiles from top of
priority_queue
In summary, each demographic profile consists of
five features (gender, ethnicity, geolocation,
university rank, and career stage) associated with a
Boolean weight that represents whether or not the
candidate is a member of the protected group for that
feature. We also collect each researcher’s h-index
from their Google Scholar profile that we use to
evaluate the utility of each PC in our evaluation.
KDIR 2020 - 12th International Conference on Knowledge Discovery and Information Retrieval
172

4 METHODOLOGY
In this section, we begin to introduce our fair group
formation algorithms.
4.1 Univariate Greedy Algorithm
In section (3), we described our demographic profiles
and the process of mapping all values to Boolean
weights. Based on that, we can compute each
candidate’s diversity score (
𝑆𝑐𝑜𝑟𝑒
) by summing the
weights for each demographic feature 𝑑
as shown in
equation (1).
𝑆𝑐𝑜𝑟𝑒
𝑑
(1)
Once we obtain the diversity score for each
candidate, we apply our Univariate Greedy Algorithm
(UGA) that selects candidates to join the group. To
accomplish this process, we place the candidates into
a priority queue based on their diversity score. Then,
we iteratively remove the top candidate from the
priority queue until the targeted group size achieved.
For instance, when forming a program committee for
a conference, the desired PC size is set to the size of
the current, actual PC for that conference. If two or
more candidates have the same diversity score, we
select one of those candidates randomly.
4.2 Multivariate Greedy Algorithm
The previous method maximizes the diversity score
of the resulting group, but it does not guarantee
multidimensional diversity among the resulting group
members. It could result in a high diversity score by
selecting an entirely female group, for example, while
accidentally excluding any members from ethnic
minority groups. Thus, we developed a Multivariate
Greedy Algorithm (MGA) to address this issue by
creating one priority queue per demographic feature
and using a round robin algorithm to select a member
from each queue until the group size is achieved. In
particular, we build five priority queues, one per
feature in our current demographic profile, each of
which contains a list of all candidates sorted based on
that feature. Round robin selection is used to select
the highest-ranked unselected candidate from each
queue in turn. Once a candidate is selected, it is
removed from all queues to avoid choosing the same
researcher repeatedly. This process continues
iteratively until the group is formed. Note: currently
the weights for the features are just 1 or 0; in the case
of a tie, one candidate is selected randomly. In future,
we will implement and evaluate non-Boolean feature
weights.
Table 1: Composition of our datasets.
Dataset PC Members Authors Total
SIGCHI17 213 436 649
SIGMOD17 130 290 420
SIGCOMM17 23 125 148
5 EXPERIMENT AND RESULT
We now introduce our dataset and describe the
process of evaluating our algorithms.
5.1 Datasets
For our driving problem, we want to focus on the PC
members for high impact computer science
conference. Thus, we are building a dataset based on
ACM conferences and we select a conference based
on several criteria: 1) the conferences should have
high impact; 2) the conferences should have little or
no overlap in topics; 3) the conferences should have
a reasonably large number of PC members and
accepted papers. Based on these criteria, we selected
SIGCHI (The ACM Conference on Human Factors in
Computing Systems), SIGMOD (Symposium on
Principles of Database Systems), and SIGCOMM
(The ACM Conference on Data Communication. We
evaluate our diverse group formation algorithms
using subsets of datasets that consists of the PC and
authors of all accepted papers of the three selected
conferences. We exclude candidates who: 1) do not
have a Google Scholar profile; 2) are missing at least
one feature’s value; 3) primarily worked in the
industry. Based on these criteria, we create a pool for
each conference that contains both PC members and
authors of accepted papers (see Table 1). The
demographic distribution of those PC’s is
summarized in Figures 1 and 2. These clearly
illustrate that all of the three PC’s had a low
participation rate from all protected groups. As an
example, SIGCOMM 2017 had only 8.7% female PC
members and, SIGMOD 2017’s PC was only 17.7%
female. Similarly, whites dominate with 78.40% of
SIGCHI 2017 PC, 55.38% of SIGMOD 2017 PC, and
69.56% of SIGCOMM 2017 PC.
Diverse Group Formation based on Multiple Demographic Features
173
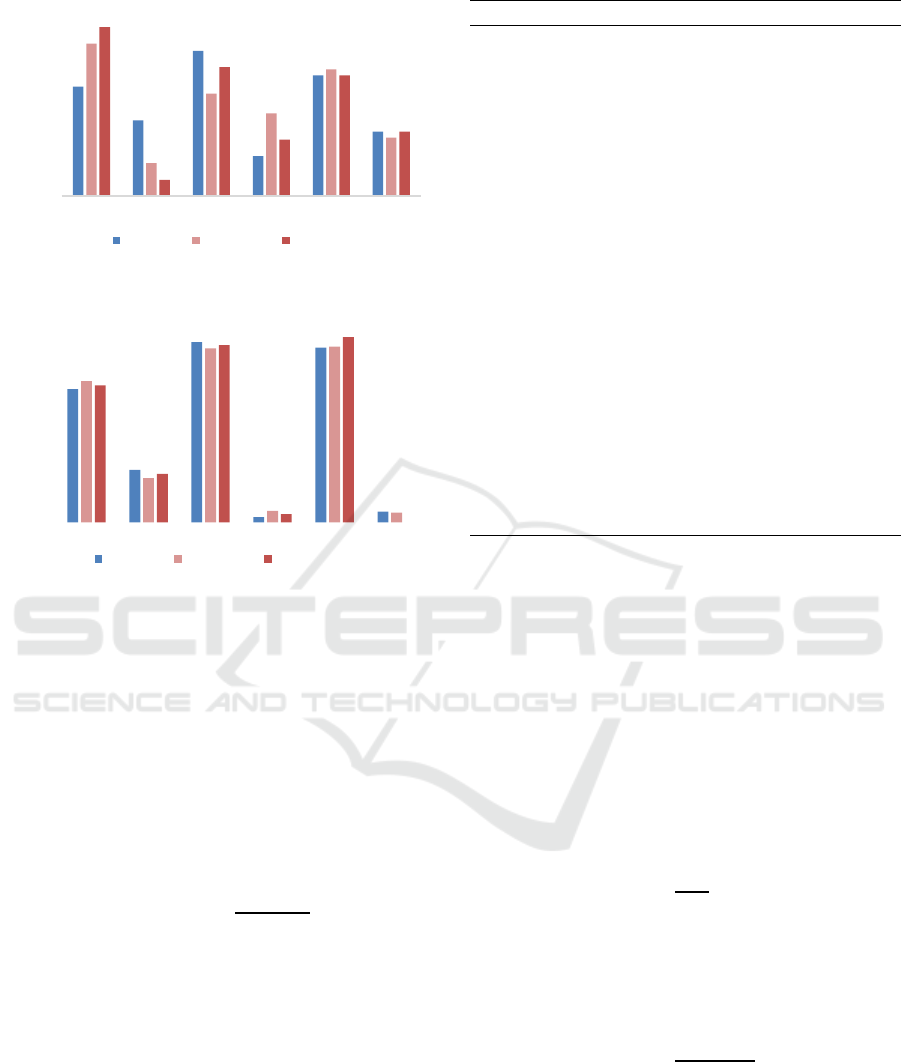
Figure 1: Data Distribution of the three current PC’s for
Gender, Race, and Career Stage Features.
Figure 2: Data Distribution of the three current PC’s for
Affiliation Impact, and Geolocation Features.
5.2 Baseline and Metrics
Baseline. Our baseline is a Random Selection
Algorithm (RSA) that randomly selects candidates to
form the group without considering diversity.
Metrics. Our algorithms attempt to generate a more
diverse PC. We evaluate their effectiveness using
Diversity Gain (𝐷
) of our proposed PCs versus the
baseline:
𝐷
MIN 100,
∑
𝜌
𝑛
(2)
where 𝜌
is the relative percentage gain for each
feature versus the baseline, divided by the total
number of features n. Each feature’s diversity gain is
capped at a maximum value of 100 to prevent a large
gain in a single feature dominating the value.
Algorithm 2: Multivariate Greedy.
1. feature_names ← List of all queue names, one per
features
2. For each feature in feature_names:
3. priority_queue[feature] ← Initialize an
empty queue
4. For each profile:
5. For each feature in feature_names:
6. score[feature] ← compute profile
score for each feature
7. Add profile to [feature] using
score[feature] as priority order
8. candidates ← empty list
9. While number of candidates < N:
10. feature ← feature_names[0]
11. Repeat:
12. candidate ← Get and remove
profile from priority_queue[feature]
13. Until candidate is not in candidates
Add candidate to candidates
14. Rotate feature to end of
feature_names.
15. Now we have N candidates selected.
By choosing to maximize diversity, it is likely that
the expertise of the resulting PC will have slightly
lower expertise. To measure this drop in utility, we
use the average h-index of the PC members and
compute the utility loss (𝑈𝐿
) for each proposed PC
using the following formula:
𝑈𝐿
𝑈
– 𝑈
(3)
where 𝑈
is the utility of PCi and 𝑈
is the utility of
the baseline. We then compute the utility savings (Υ
)
of PCi relative to the baseline as follows:
Υ
𝑈𝐿
𝑈
(4)
Finally, we compute the F measure (Jardine, 1971) to
examine the ability of our algorithms to balance
diversity gain and utility savings:
F2∗
𝐷
∗
Υ
𝐷
Υ
(5)
0
20
40
60
80
100
M F White Non‐White Senior Junior
# of candidates by percent
SIGCHI17 SIGMOD17 SIGCOMM17
0
20
40
60
80
100
HighRanked
U
LowRankedU Developed Developing Non‐EPSCoR EPSCoR
# of candidates by percent
SIGCHI17 SIGMOD17 SIGCOMM17
KDIR 2020 - 12th International Conference on Knowledge Discovery and Information Retrieval
174
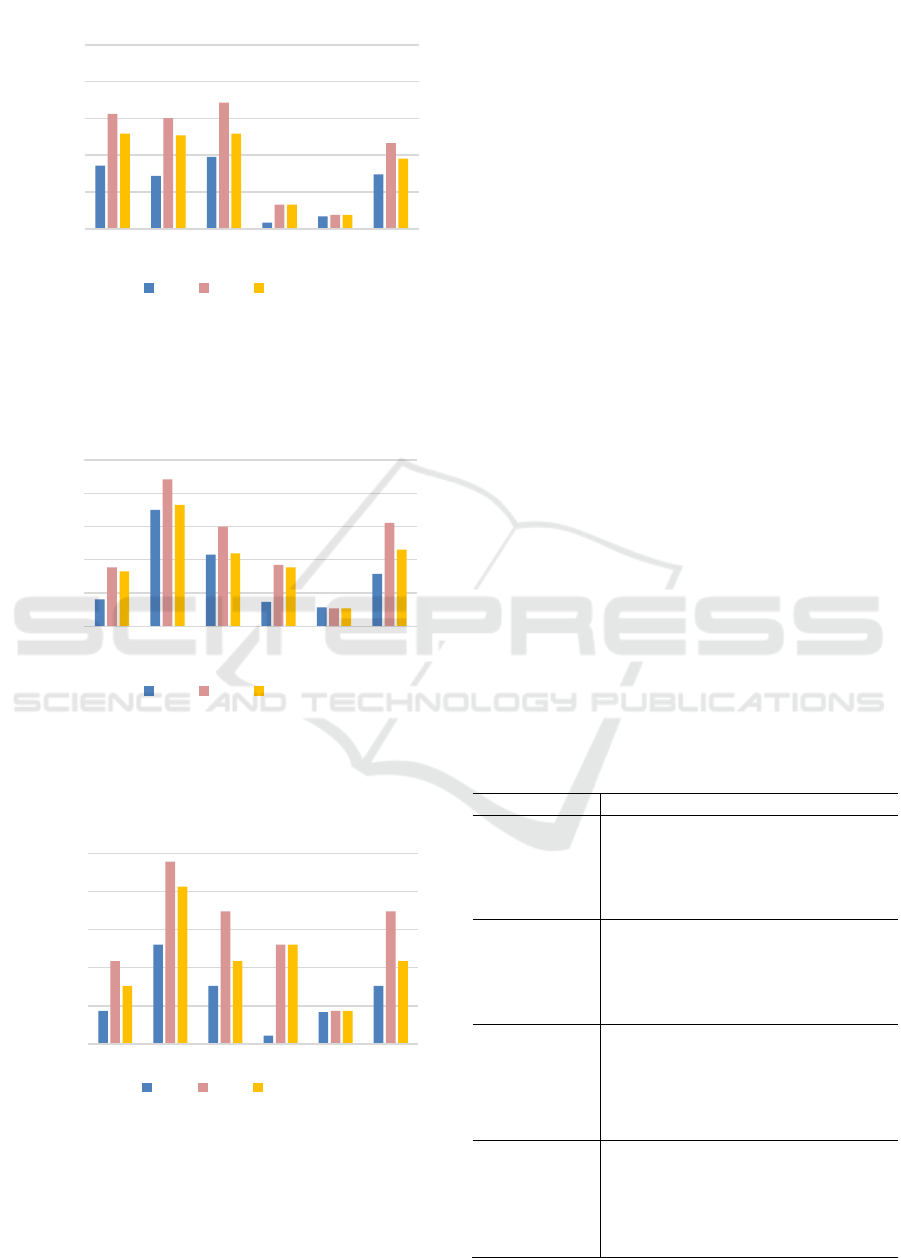
Figure 3: Comparison of the protected groups improvement
between the baseline PC produced by the baseline and
proposed PCs of SIGCHI 2017 produced by our UGA and
MGA.
Figure 4: Comparison of the protected groups improvement
between the PC produced by the baseline and proposed PCs
of SIGMOD 2017 produced by our UGA and MGA.
Figure 5: Comparison of the protected groups improvement
between the PC produced by the baseline and proposed PCs
of SIGCOMM 2017 produced by our UGA and MGA.
5.3 Results
Comparison with the baseline. Our algorithms
produce ranked list(s) from which we select to form
the PCs with the overarching goal of increasing the
diversity in the program committee. Hence, we report
the differences between the PC produced by the
baseline, random selection (RSA), and the PCs
proposed by the algorithms described in Section 4.
Looking at Figures 3, 4, and 5, we can see that both
algorithms succeeded in increasing the diversity in
the recommended PCs in all demographic groups
except EPSCoR. In some cases, the UGA
overcorrects and, in its efforts to select diverse
members, we end up with a demographically biased
PC in favor of some protected groups, e.g., female.
We must also compare the effect of the algorithms
with respect to the expertise of the resulting PC. Table
5 summarizes the diversity gain (DG), utility loss
(UL), utility Savings (
Υ
), and F scores for the PCs
proposed by each algorithm. The MGA and UGA
obtained diversity gains of over 46 for all of the three
proposed PC’s, with the biggest gain occurring for
SIGCHI2017 using the UGA. The gains in diversity
occur with an average utility loss of 35.24% for the
UGA but only 15.41% for the MGA. Since the MGA
resulted in greater utility savings, its average F score
is higher, and we conclude that the Multivariate
Greedy Algorithm outperforms the Univariate
Greedy Algorithm.
Table 2: Experimental results for the UGA and MGA
algorithms versus the RSA (baseline). All values presented
as percentages.
Table
𝐷
𝑈𝐿
Υ
F
SIGCHI
UGA 67.18 32.88 67.12
67.15
MGA 55.5 20.67 79.33
65.31
SIGMOD
UGA 50.51 17.47 82.53
62.67
MGA 53.00 -2.42 102.42
69.85
SIGCOMM
UGA 46.80 55.37 44.63
45.69
MGA 50.56 27.99 72.01
59.41
Average
UGA 54.83 35.24 64.76 58.50
MGA
53.02 15.41 84.59 64.86
0,00
20,00
40,00
60,00
80,00
100,00
F Non-White Junior Developing EPSCoR Low
Ranked
University
Percent
Protected Group
RSA PC1 PC2
0,00
20,00
40,00
60,00
80,00
100,00
F Non-White Junior Developing EPSCoR Low
Ranked
University
Percent
Protected Groups
RSA PC1 PC2
0,00
20,00
40,00
60,00
80,00
100,00
F Non-White Junior Developing EPSCoR Low
Ranked
University
Percent
Protected Groups
RSA PC1 PC2
Diverse Group Formation based on Multiple Demographic Features
175

Table 3: Comparison of all the three proposed PC’s produced by our MGA and the current PC’s. All values presented as
percentages.
Feature
Method
SIGCHI 2017
SIGMOD 2017
SIGCOMM 2017
Average
Female
Current 40.85 17.69 8.7 22.41
MGA 48.83 29.23 30.43 36.16
Non-White
Current 21.6 44.62 30.43 32.22
MGA 52.11 78.46 69.57 66.71
Junior
Current 34.74 31.54 34.78 33.69
MGA 48.83 49.23 52.17 50.08
Developing
Current 2.81 6.15 4.35 4.44
MGA 14.08 34.62 52.17 33.62
EPSCoR
Current 5.71 2.31 0.00 2.67
MGA 7.51 10.77 17.39 11.89
Low Rank University
Current 28.17 23.85 26.09 26.04
MGA 49.30 49.23 47.83 48.79
Table 4: Comparison of the average h-index of each
proposed PC produced by our MGA versus the current PCs.
Table Current MGA
SIGCHI2017 24.55 19.04
SIGMOD2017 32.86 23.27
SIGCOMM2017 29.43 19.91
Average 28.95 20.74
5.4 Validation
Finally, we provide a comparison between the actual
PC’s for the three conferences and the PCs proposed
by our best algorithm, the MGA (see Table 3).
The number of PC members from the protected
groups were increased across all demographic
features for all conferences. In most cases the
algorithm did not over-correct by including more than
50% of any protected demographic group, with the
exception of the participation of non-white that was
increased to over 66.7%. The participation of females
and junior researchers all increased about 50% and
non-whites and researchers from lower-ranked
universities doubled. Researchers from the
developing world and EPSCoR states increased
many-fold, although this was achieved by selecting
all candidates from EPSCoR states and most
candidates from developing countries. The h-index
for the proposed PC dropped 28.35% (see Table 4).
The overall diversity gain for the proposed PC is
53.02%, the utility savings 84.59% and the F-measure
64.86%.
6 CONCLUSION AND FUTURE
WORK
Groups of experts are formed in many situations
within industry and academia. However, there may be
bias in the traditional group formation process leading
to inferior results and blocking members of
underrepresented populations from access to valuable
opportunities. We investigate the issue of bias in
academia, particularly the formation of conference
program committees, and develop algorithms to form
a diverse group of experts. Our approach is based on
representing candidate experts with a profile that
models their demographic information consisting of
five features that might be sources of bias, i.e.,
gender, ethnicity, career stage, geolocation, and
affiliation impact. Most previous work focuses on
algorithms that guarantee fairness based on a single,
Boolean feature, e.g., race, gender, or disability. We
consider five Boolean features simultaneously and
evaluated two group formation algorithms. The
KDIR 2020 - 12th International Conference on Knowledge Discovery and Information Retrieval
176

Univariate Group Algorithm (UGA) selects members
based on a composite diversity score and the
Multivariate Group Algorithm (MGA) selects
members based on a round robin of priority queues
for each diversity feature. The resulting proposed PCs
were compared in terms of diversity gain and utility
savings, as measured by a decrease in the average h-
index of the PC members. The MGA produced the
best results with an average increase of 48.42% per
protected group with utility loss of only 10.21%
relative to a random selection algorithm.
In some cases, our algorithms overcorrected,
producing a PC that had overrepresentation from
protected groups. In future, we will develop new
algorithms that have demographic parity as a goal so
that the PC composition matches the demographic
distributions in the pool of candidates. These will
require modifications to our MGA so that the feature
queues are visited proportionally to the protected
group participation in the pool. We will also explore
the use of non-Boolean feature weights and dynamic
algorithms that adjust as members are added to the
PC.
In conclusion, our proposed work provides new
ways to create inclusive, diverse groups to provide
better opportunities, and better outcomes, for all.
REFERENCES
AlShebli, B. K., Rahwan, T., & Woon, W. L. (2018). Ethnic
diversity increases scientific impact. arXiv preprint
arXiv:1803.02282.
Asudeh, A., Jagadish, H. V., Stoyanovich, J., & Das, G.
(2019). Designing fair ranking schemes. In
Proceedings of the 2019 International Conference on
Management of Data (pp. 1259-1276). ACM.
Baggs, H., Broome, M., Dougherty, M., Freda, M., &
Kearney, M. (2008). Blinding in peer review: the
preferences of reviewers for nursing journals. Journal
of Advanced Nursing, 64(2), 131–138.
blog, NamSor. (2018, Jan 31). Inferring The World's
Gender and Ethnic Diversity using Personal Names.
Retrieved 2020., from
https://namesorts.com/2018/01/31/understanding-
namsor-api-precision-for-gender-inference/
Bornmann, L., & Daniel, H. D. (2005). Selection of
research fellowship recipients by committee peer
review. Reliability, fairness and predictive validity of
Board of Trustees' decisions. Scientometrics, 63(2),
297-320.
Brocco, M., Hauptmann, C., & Andergassen-Soelva, E.
(2011). Recommender system augmentation of HR
databases for team recommendation. Paper presented
at the Database and Expert Systems Applications
(DEXA), 22nd International Workshop On, 554-558.
Chandrasekaran, K., Gauch, S., Lakkaraju, P., & Luong, H.
P. (2008). Concept-based document recommendations
for citeseer authors. International Conference on
Adaptive Hypermedia and Adaptive Web-Based
Systems. Springer, Berlin.
Chen, Y., Fan, Z. P., Ma, J., & Zeng, S. (2011). A hybrid
grouping genetic algorithm for reviewer group
construction problem. Expert Systems with
Applications, 38(3), 2401-2411.
Cochran-Smith, M., & Zeichner, K. M. (2009). Studying
teacher education: The report of the AERA panel on
research and teacher education. Routledge.
Dias, T. G., & Borges, J. (2017). A new algorithm to create
balanced teams promoting more Diversity. European
Journal of Engineering Education, 42(6), 1365-1377.
doi:10.1080/03043797.2017.1296411.
Education, Times Higher. (2020). Times. Retrieved from
https://www.timeshighereducation.com/
Feldman, M., Friedler, A., Moeller, J., Scheidegger, C., &
Venkatasubramanian, S. (2015). Certifying and
removing disparate impact. In Proceedings of the 21th
ACM SIGKDD International Conference on
Knowledge Discovery and Data Mining (pp. 259-2).
Foundation, National Science. (2019). EPSCoR states.
Retrieved from
https://www.nsf.gov/od/oia/programs/epscor/nsf_oiia_
epscor_EPSCoRstatewebsites.jsp
Gabriel, D. (2017). Race, racism and resistance in British
academia. In Rassismuskritik und Widerstandsformen
(pp. 493-505). Springer VS, Wiesbaden.
Gauch, S., Speretta, M., Chandramouli, A., Micarelli, A.,
Brusilovsky, P., Kobsa, A., & Nejdl, W. (2007). The
adaptive Web: methods and strategies of Web
personalization.
Google Scholar. (2020). Google
. Retrieved 2020, from
https://scholar.google.com/
Holman, L., Stuart-Fox, D., & Hauser, C. E. (2018). The
gender gap in science: How long until women are
equally represented?. PLoS biology, 16(4), e2004956.
Hunt, V., Layton, D., & Prince, S. (2015). Diversity
matters. McKinsey & Company, 1, 15-29.
Jain, A., & Minni, J. (2017). Location based Twitter
Opinion Mining using Common-Sense Information.
Global Journal of Enterprise Information System, 9(2).
Jardine, N. &. (1971). The use of hierarchic clustering in
information retrieval. . Information storage and
retrieval, (pp. 7(5), 217-240.).
Juang, M. C., Huang, C. C., & Huang, J. L. (2013). Efficient
algorithms for team formation with a leader in social
networks. The Journal of Supercomputing, 66(2), 721-
737.
Justice, A., Cho, M., Winker, M., & Berlin, J. (1998). Does
masking author identity improve peer review quality?
A randomized controlled trial. Journal of the American
Medical Association, 280(3), 240–242.
Kamishima, T., Akaho, S., & Sakuma, J. (2011). Fairness-
aware learning through regularization approach. In
2011 IEEE 11th International Conference on Data
Mining Workshops (pp. 643-650). IEEE.
Diverse Group Formation based on Multiple Demographic Features
177

Khalid, K., Salim, H. M., Loke, S. P., & Khalid, K. (2011).
Demographic profiling on job satisfaction in Malaysian
utility sector. International Journal of Academic
Research, 3(4), 192-198.
Khan, B., Robbins, C., & Okrent, A. (2020, Jan 15). Science
and Engineering Indicator. Retrieved from
https://ncses.nsf.gov/pubs/nsb20198/demographic-
trends-of-the-s-e-workforce
Lane, D. (2008). Double-blind review: Easy to guess in
specialist fields. Nature, 452, 28.
Lane, T. (2018, 10 12). Diversity in Peer Review: Survey
Results. (COPE) Retrieved from
https://publicationethics.org/news/diversity-peer-
review-survey-results
Lappas, T., Liu, K., & Terzi, E. (2009). Finding a team of
experts in social networks. In the Proceedings of the
15th ACM SIGKDD International Conference on
Knowledge Discovery and Data Mining, 467-476., (pp.
Lappas, T.; Liu, K.; Terzi, E.).
Lee, C. J., Sugimoto, C. R., Zhang, G., & Cronin, B. (2013).
Bias in peer review. Journal of the American Society for
Information Science and Technology, 64(1), 2-17.
Lerback, J., & Hanson, B. (2017). Journals invite too few
women to referee. Nature News, 541(7638), 455.
Michael, J. (2007). 40000 namen, anredebestimmung
anhand des vornamens. C'T, 182-183.
Murray, D., Siler, K., Lariviére, V., Chan, W. M., Collings,
A. M., Raymond, J., & Sugimoto, C. R. (2019). Gender
and international diversity improves equity in peer
review. BioRxiv, 400515.
NamSor. (2020). NamSor. Retrieved 2020, from
https://www.namsor.com/
Owens, D. A., Mannix, E. A., & Neale, M. A. (1998).
Strategic formation of groups: Issues in task
performance and team member selection. Research on
managing groups and teams, 1(1998), 149-165.
Rodriguez, M. A., & Bollen, J. (2008). An algorithm to
determine peer-reviewers. In Proceedings of the 17th
ACM conference on Information and knowledge
management (pp. 319-328). ACM.
Salman, O., Gauch, S., Alqahtani, M., & Ibrahim, M.
(2020). The Demographic Gap in Conference
Committees.
SIGCHI. (2019). Diversity of the Program Committee for
CHI 2020. Retrieved from
https://chi2020.acm.org/blog/diversity-of-the-
program-committee-for-chi-2020/
Singh, A., & Joachims, T. (2018). Fairness of exposure in
rankings. In Proceedings of the 24th ACM SIGKDD
International Conference on Knowledge Discovery &
Data Mining (pp. 2219-2228). ACM.
Tobar, C. M., & de Freitas, R. L. (2007). A support tool for
student group definition. In 2007 37th Annual Frontiers
In Education Conference-Global Engineering:
Knowledge Without Borders, Opportunities Without
Passports (pp. T3J-7). IEEE.
Union, European. (2020). The official directory of the
European Union. Retrieved 2020, from
https://op.europa.eu/en/web/who-is-who
Wang, D. Y., Lin, S. S., & Sun, C. T. (2007). DIANA: A
computer-supported heterogeneous grouping system
for teachers to conduct successful small learning
groups. Computers in Human Behavior, 23(4), 1997-
2010.
Wang, W., Kong, X., Zhang, J., Chen, Z., Xia, F., & Wang,
X. (2016). Editorial behaviors in peer review.
SpringerPlus, 5(1), 903.
Wi, H., Oh, S., Mun, J., & Jung, M. (2009). A team
formation model based on knowledge and
collaboration. Expert Systems with Applications, 36(5),
9121-9134.
Worldbank. (2018). gdp-ranking. Retrieved 2020, from
https://datacatalog.worldbank.org/dataset/gdp-ranking
Yin, H., Cui, B., & Huang, Y. (2011). Finding a wise group
of experts in social networks. In International
Conference on Advanced Data Mining and
Applications (pp. 381-394). Springer, Berlin,
Heidelberg.
Zehlike, M., Bonchi, F., Castillo, C., Hajian, S., Megahed,
M., & Baeza-Yates, R. (2017). Fa* ir: A fair top-k
ranking algorithm. In Proceedings of the 2017 ACM on
Conference on Information and Knowledge
Management (pp. 1569-1578). ACM.
Zemel, R., Wu, Y., Swersky, K., Pitassi, T., & Dwork, C.
(2013). Learning fair representations. In International
Conference on Machine Learning, (pp. (pp. 325-333).).
KDIR 2020 - 12th International Conference on Knowledge Discovery and Information Retrieval
178
