
Development of Framework for Designing an Analytical Data
Warehouse: Case of e-Municipalities
Kristaps Pēteris Rubulis
1
, Jānis Vempers
2
and Edžus Žeiris
2
1
Riga Technical University, Institute of Information Technology, Kalku 1, Riga, LV-1658, Latvia
2
Ltd. ZZ Dats, Elizabetes 41/43, Riga, LV-1010, Latvia
Keywords: Knowledge Sharing, e-Municipalities, Patterns, Framework.
Abstract: Knowledge sharing is an important aspect in a company’s daily life. Transferring practical experience and
knowledge (that is required for solution development) among employees is crucial. This improves the
development time and quality of software solutions as well as understanding of future projects related to cases
with similar concepts and concerns. A framework for designing an analytical data warehouse (FADW)
intended for municipalities is proposed. This framework focuses on the usage of patterns that are utilized for
knowledge sharing purposes. The paper analyzes a case study and outlines possible solutions to the problems
identified. A data warehouse is used to integrate data and to address business data analysis and, with the help
of patterns, these solutions are shared among the municipalities.
1 INTRODUCTION
Knowledge sharing is a process of interchanging
knowledge, experience, intelligence, understanding
and other values, that create awareness and
understanding on how to use and apply an existing
solution or an approach to help deal with or solve the
encountered problem (Nadason et al., 2017). One way
to achieve knowledge sharing is with the help of
patterns. Pattern in the context of an analytical data
warehouse is a general, reusable, and configurable
solution to a commonly occurring problem within a
given context. With addition to literature review to
many patten definitions (Jokste et al., 2019), (Agerbo
& Cornils, 1998), (Buschmann et al., 1996), (Fowler,
1997), (Gamma et al., 1995), patterns:
Can be used as a knowledge base to shorten
implementation time and improve quality of
solutions;
Could be shared with other establishments, or in
this case – municipalities, to improve the
implementation time and quality of a business
needs;
Endure over time, for possible use in the future.
Based on this pattern approach, a framework for
designing an analytical data warehouse (FADW)
meant for municipality business cases is developed.
The problem addressed in this paper discusses the
use of a predefined framework for the development
of an FADW. The FADW in this case is meant for the
use of e-municipalities that could use other available
solutions from other municipalities to create solutions
that are necessary for them at that point and time.
The objective of this paper is to elaborate a
concept of the FADW by analyzing and
researching the requirements and needs for
municipal business cases and to show the general
idea on using the proposed framework for similar
cases. As well as, to propose a way to use patterns for
the development of a solution that has similar needs
to other cases and are within the same business
intelligence (BI) environment.
This research is done as a part of an industrial
research project managed by the university and a
company that implements the results of the research
projects into a system developed specifically for
municipalities. The overall objective is to establish BI
ecosystem facilitating efficient adoption of BI
solutions in Latvian municipalities. Solutions with
emphasis on demonstrating the value of information
and importance of identifying information for
suitable BI application cases.
The rest of the paper is organized as follows.
Section 2 provides background information about the
research. Section 3 describes the research method
used for carrying out the project. Section 4 analyzes a
Rubulis, K., Vempers, J. and Žeiris, E.
Development of Framework for Designing an Analytical Data Warehouse: Case of e-Municipalities.
DOI: 10.5220/0010056001610171
In Proceedings of the 12th International Joint Conference on Knowledge Discovery, Knowledge Engineering and Knowledge Management (IC3K 2020) - Volume 3: KMIS, pages 161-171
ISBN: 978-989-758-474-9
Copyright
c
2020 by SCITEPRESS – Science and Technology Publications, Lda. All rights reserved
161

case study and describes how to share the attained
knowledge with the help of patterns. Section 5
summarizes the analysis and research done in this
paper. And Section 6 gives the conclusion and future
plans related to this work.
2 BACKGROUND
As the need for municipalities to manage urban and
territorial development for cases related to traffic,
environmental pollutions, territorial improvements
(and other cases) is high, the importance of e-
municipalities cannot be over emphasized. The
system enhances local governance and democracy,
and it makes access to information, that is related to
municipalities, easier (Bojang & Bwando, 2018).
For the municipalities of Latvia, there is a Unified
Municipality system meant to ease the internal and
interinstitutional cooperation processes. This system
offers its services to 119 municipalities in total. The
company, mentioned in the introduction of the paper,
is responsible for the unified municipal system – its
maintenance and further improvements.
The company, with the help of the university, has
developed a framework meant for designing an
analytical data warehouse for the needs of
municipalities. This framework is a data warehouse
design approach that combines 1) data warehouse
technological solutions, 2) implementation of data
mining methods (and) 3) methods for independent
implementation and improvement of analytical
capabilities. The framework describes the concept of
a data analytics solution and the technical architecture
specifically for case of municipalities. As well as
guidelines on how to design and develop these
solutions. In the next section, topics related to the
FADW development are discussed and the general
outline of the framework is described.
3 RESEARCH METHOD
The research analyzes two case studies, based on
which the FADW is developed. Both case studies are
requests made by two different municipalities to
provide a data analytics solution to analyze data with
the available information. One of the case studies is
about municipality cards, that give the citizens of the
municipality a chance to use special services, that
require the use of this card. The second case study is
about determining the investment index in the
municipality and its citizens, to plan future
investments and environmental improvements.
To learn from similar BI application cases,
literature about the experiences of other countries –
their municipalities, was analyzed and reviewed and
set as a base, when researching possible solutions for
the FADW (Teixeira et al., 2014), (Nycz &
Polkowski, 2015), (Hartley & Seymour, 2015),
(Hafiz & Faith, 2016), (Adelakun, 2012), (Yadav &
Shakya, 2016). The literature describes data
warehouse and business intelligence solution
implementation potential with the research, planning
or development done by the different municipalities.
Literature indicates the potential difficulties and
benefits of the BI solutions. Largest issues the process
of designing BI solutions for multiple municipalities
had, was data integration problems between different
systems, difficult knowledge sharing between
municipalities and that it is financially challenging to
provide BI solutions for municipalities en masse.
Despite these difficulties, most the country
experiences approve the fact that BI solutions provide
more benefits than disadvantages.
With the available research materials, questions
requiring additional research arose. Questions that
required attention and research, before moving on to
designing the technological solution:
What criteria needs to be considered when
implementing analytical data warehouses and BI
solutions for e-governance purposes?
What is the role of datamining methods in data
warehouse solutions?
From what kind of components are data
warehouses and BI solutions comprised of?
What kind of already existing component-based
data analytics solutions are there?
Open data in the context of municipality BI
platform solutions,
User cooperation capabilities in already existing
BI platforms.
The conclusions made from the research led to
understand, that a BI solution meant to satisfy
municipality needs requires a stable data warehouse
implementation process, the use of datamining
methods, geospatial data analysis and visualization
tools as well as an integration of data between a
variety of different platforms. This study focuses on
providing an addition to the already existing data
warehouse solutions, by introducing the use of
component-based solutions. With an addition of a
component-based solution to these data warehouse
preconditions, it is possible to design a system, that
could help municipalities share knowledge and their
existing solutions between themselves and set
KMIS 2020 - 12th International Conference on Knowledge Management and Information Systems
162

conditions for the structure of data, that needs to be
provided for the BI solutions to work. This would
address the issues encountered by other countries and
result in cost savings and an efficient way of using
already developed solutions.
To understand the implementation possibilities
for a component-based approach, reference materials
for knowledge sharing (Jokste et al., 2019) within the
BI ecosystem and knowledge management (Kampars
& Stirna, 2017) are used to make sure that the
knowledge is transferred between municipalities.
Besides the more common and traditional
approaches, when the technological solution of the
data warehouse was being designed, multiple
reference materials related to data analytics and data
warehouses were considered:
Data extraction from devices, various data
format data extraction, data storage and analysis
(Ahmed & Shahat Osman, 2019),
Connecting new data sources to already existing
ones and combining new data source data with
the already existing data (Hiranandani, 2017),
Data integrity and control (Ahmed & Shahat
Osman, 2019), (Arora & Gupta, 2017),
Gradual additions and improvements to the data
warehouse (Silva et al., 2013), (Felipe et al.,
2018),
Service-oriented approach, configurability,
interoperability (Felipe et al., 2018).
With the available information as the base for
designing an analytical data warehouse, and a general
idea on how to do it, it is still important to consider
the two main questions that set the course on how the
analytical data warehouse will be build. The main
questions that need answers before creating a solution
for municipality data analytics needs and knowledge
sharing within the BI ecosystem:
How will it be possible to share knowledge
between municipalities,
How is it possible for different municipalities to
use the same solution – they might have similar
business objective, but the requirements and
needs might differ?
The questions guide the research and creates
discussion for possible ways to overcome the
problems and issues that these questions highlight.
Mentioned reference materials are reviewed for
finding possible solutions and approaches for the
creation of the framework.
To find an answer to the raised questions, to ease
the process of resolving the problems that
municipalities encounter and need a solution for, as
well as to acquire additional data and information,
that could be used to govern the municipality –
potential solution, such as an analytical data
warehouse, could be proposed. The data warehouse
would use data analytics tools, e.g. OLAP (Online
analytical processing) cube that would be used to
analyze the acquired data and provide an overview of
the situation regarding the problem. The structure of
the data warehouse would differ based on the problem
– what kind of data needs to be analyzed and how can
this data be stored (in the form of a dimensional data
model) in the data warehouse for data analytics
purposes.
Once a dimensional data model is structured and
implemented for the specific problem in the data
warehouse, the data could be uploaded and analyzed
with the help of data analytics tools. However, there
is a catch. This dimensional data model would require
to be universal – to have the most important aspects
with a minimalistic touch of the specific problem. The
reasoning behind that is so that other municipalities,
which would be interested to solve a similar problem,
would also be able to use this same dimensional data
model for their own purpose. And, if need be, other
additional functionalities could be added by
themselves later on. At this point, the knowledge
management side of the analytical data warehouse
solution is proposed.
In order for municipalities to share their
experience, knowledge and proposed solutions for
respective problems – for this cause, patterns are
introduced. Patterns are used together with the pattern
repository (Kampars & Stirna, 2017) that provides
knowledge management services – create new, find
and use already existing patterns. By using the pattern
repository, it is possible to track knowledge usage in
different applications as well as to aggregate feedback
about pattern usage efficiency. With this feedback, it
is possible to dedicate, which patterns seem to be
more efficient and help with selecting patterns
appropriate to solve municipal problems.
The situation is primarily analyzed from the
perspective of a consulting company that provides
solutions for municipality needs. The FADW serves
as guidelines for implementing, maintaining, and
sharing possible solutions that are meant to resolve
requests made by municipalities.
4 CITIZEN MUNICIPALITY
CARD CASE STUDY
As mentioned, the developed framework is based on
the two case studies – business requirement cases
Development of Framework for Designing an Analytical Data Warehouse: Case of e-Municipalities
163
raised by two municipalities which will be analyzed
in this (IV) and the following section (V). The first
case study focuses on providing the municipality a
way to analyze data that is accumulated by using the
municipality cards for different types of services, like
public transport, catering, etc. Goal of the case study
is to analyze the citizen card – utilization processes,
data that is exchanged in the card usage process, data
sources, and to design examples for data analysis
methods. Based on the case studies, framework for
designing an analytical data warehouse is developed.
4.1 Data Warehouse
To be able to use data warehouse for data analytics
purposes, a dimensional data model is required.
Dimensional models (Kirmani, 2017), (Sherman,
2014) can be used to write reports, use query tools to
analyze the data in the data warehouse, provide an
easy to understand user interface (helping end user
understand the database easier). It can also be
extended if there is a need for additional information.
The administration of the data warehouse is based on
the data structure “Fact-Table”. For this case study, a
snowflake schema is used for the dimensional data
model to ensure, that the data that is acquired in the
transaction processes, when using the municipality
citizen card, could be analyzed thoroughly and all the
required fields for data analysis would be provided in
the dimensional data model. To create the
dimensional data model, input data for citizen
municipality card case study is analyzed.
This input data is not of a complex nature and
luckily, all the data provided is already structured
without any unnecessary information. This helps
avoid any data quality issues. So at first glance the
dimensional model does not seem to be too complex
itself as well. However, that is not the case. Despite
there being only four fields in the provided report –
card id, merchandise id, time of the transaction taking
place and the transaction amount, many more aspects
need to be taken in consideration. Taking the client
(citizen purchasing the product with the municipality
card) data into account, the dimensional model
requires firstly, the standard tables – fact table, time
dimension table and client dimension table. To be
able to analyze the data, there is additional
information that can be related to the client. Which
means, that the client will have additional branches to
depict “client” in the dimensional data model. In
addition, the citizens need to be assigned to a
municipality, so dimension tables representing
municipalities and their territories must be added as
well. Based on this information and these
requirements, the dimensional data model, can be
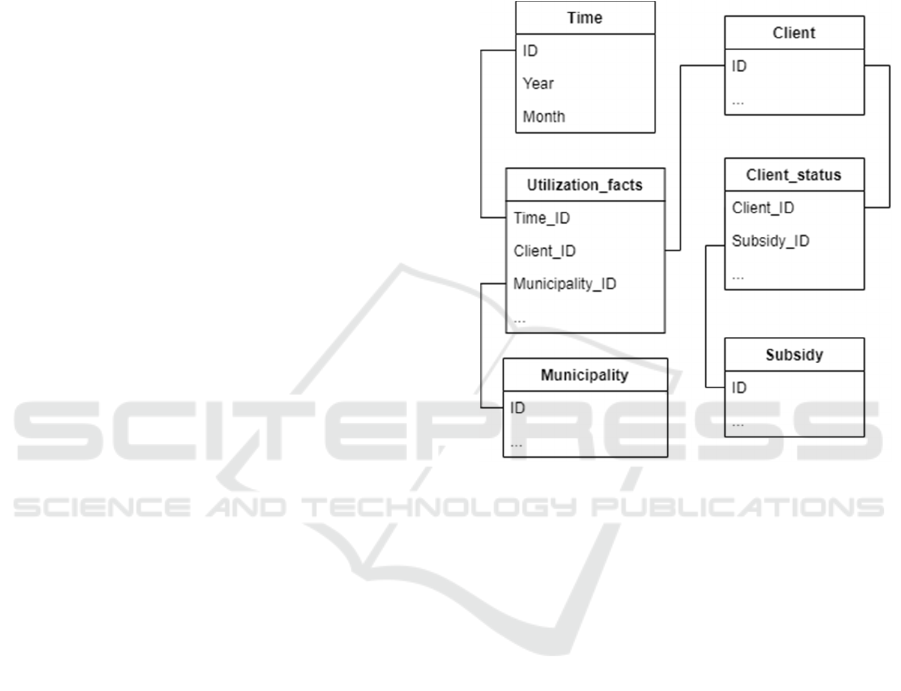
structured. A simple representation of dimensional
data model can be seen in Figure 1. The fact table
“Utilization_facts” holds the numbers and values that
are loaded into the data warehouse for data analysis
needs. The other tables are dimensions that provide
the necessary data to analyze the fact table data from
different perspectives and at different sections.
Figure 1: Representation of a dimensional data model for
municipality card case study.
4.2 ETL Process
To get the available data into the data warehouse,
there are a number of steps, that need to be taken. ETL
(E – extract, T – transform, L – load) tools and the
process of it is responsible for data extraction from
many different data sources, cleaning (transforming)
the data, for it to be usable and viable for the data
warehouse and then inserting the cleansed data into
the data warehouse. This data is stored in a snowflake
schema which was already described and showed in
Figure 1. To fetch data from this schema, many joins
are required. That is why it is very important how the
data is transformed and then stored during the ETL
process in the data warehouse. Based on outcome of
this process, the performance of the data warehouse
can either improve or diminish (Simitsis, 2005),
(Goar et al., 2010), (Hanlin, 2012), (Levene &
Loizou, 2003), (Oketunji & Omodara, 2016). So
before the data is inserted into the data warehouse, it
needs to be analyzed – how it is going to be stored
KMIS 2020 - 12th International Conference on Knowledge Management and Information Systems
164
(already provided in Figure 1), and then it can be
prepared for the transformation and storing process.
For the municipality citizen card case study, there
are two separate data sources. One system provides
information about the actual use of citizen cards
around the clock, while the other system provides
information about citizens – name, surname, other
personal information, citizen card assigned to them,
and similar information. Citizen card data requires to
be collected in real time, while data about the citizens
is fixed and rarely changes. Once the input data is
acquired, the transformation process of the data may
begin.
For this case, in total, there are 3 transformations
that need to be performed:
1. Combining data by citizen ID – since the data
is acquired from 2 separate data sources, it
needs to be combined by using the citizen
identification, which is stored in both data
sources.
2. Separating data by date and time – to analyze
data (for example anomaly identification,
which is described later in paper) by time or
date, or both for faster data analysis.
3. Calculating citizen (client) age by their birth
date – to analyze citizen card usage
tendencies according to age groups. The age
is acquired by using the citizen birth date
from one of the data sources and calculating
the actual age of the citizen at the time of the
transaction.
Once the data has been processed and transformed
it can be loaded into the data warehouse, where
further data analysis with respective tools can be
performed. As a result, an example of a possible
solution, for municipalities to use for their own cases,
can be proposed. Based on the needs of the
municipalities, different types of data transformations
can be made with the available data – therefore
different type of data analytics solutions, can be
presented. An approach to present these different
solutions and to provide the necessary knowledge so
that other municipalities could implement them, (as
already mentioned in the response for the second
question that was raised) is the usage of patterns.
Patterns are reusable components, that can help solve
problems of a specific context (Alexander et al.,
1977), (Agerbo & Cornils, 1998), (Buschmann et al.,
1996), (Fowler, 1997), (Gamma et al., 1995), e.g.
issues related to municipality governance. These
patterns, that can consist of either technical
components that ensure that the solution works
appropriately to the municipality requirements or
consists of knowledge that describes how to use or
adjust the patterns for a specific issue. They can be
used as a means of sharing knowledge between
municipalities.
4.3 Patterns
Traditional patterns for software development consist
of three main concepts that are 1) problem
description, indicating what type of issues the pattern
addresses; 2) definition of the context, describing the
conditions and the environment when the pattern can
be made use of; 3) solution, describing the achieved
results by using the corresponding pattern. However,
this is not much to go on, as there is no information
on what sort of input data is used or required; how this
solution could be implemented for other users; or any
indicators on whether or not this pattern provides
useful and valid information. Any user, who is
unaffiliated with the group of people, who put this
pattern together, could have a hard time achieving the
same result of the pattern. But it also should be
pointed out, that the developed patterns in these cases
were not meant for sharing. So, to make knowledge
sharing viable with the use of patterns, additional
pattern concepts need to be introduced. These
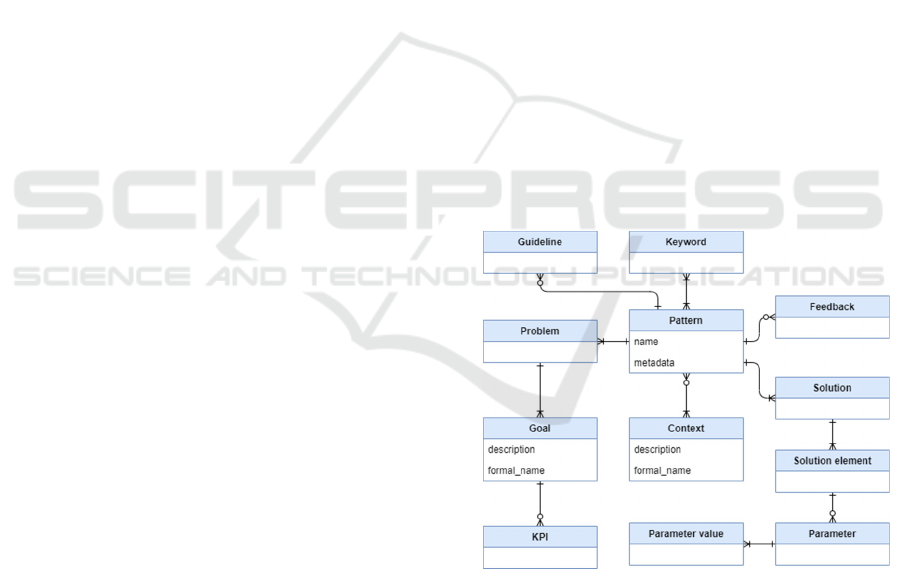
concepts are summarized in a pattern metamodel,
shown in Figure 2, and a more detailed information
follows the figure.
Figure 2: Pattern metamodel.
Pattern is a data analytics solution reusable
component, which can be combined with other
patterns and it is described by attributes such as a
name and metadata. Name referring to the specific
pattern and metadata being the concepts described
before (problem description, context, solution) and
further in the paper. By configuring the concepts of
the pattern, an analytical solution for a specific
municipality business need can be designed. Besides
Development of Framework for Designing an Analytical Data Warehouse: Case of e-Municipalities
165

the problem description, context and solution, that are
the main concepts of software development patterns,
concepts such as keywords, goal, key performance
indicators (KPI), solution element, parameters,
parameter values, feedback, and guidelines are
introduced and implemented. Keywords are used to
find the appropriate patterns in the pattern repository,
that is why, each of the patterns have keywords
assigned to them, to describe the cases they can be
used for. The goal describes what can be achieved
with the use of the pattern. Key performance
indicators define the usefulness indicators that
indicate how well the pattern performs. Solution
element is the concepts from which the solution is
composed of, e.g. data mining or data processing
algorithms. Each pattern is adjustable and so each
pattern can have different parameters – is it a data
source, data extraction query or any other input.
Parameter values are defined according to the
developer, who implements the data analytics soliton
by considering parameter types, possible values, and
restrictions. Feedback is used to evaluate the quality
and potential of the pattern. They are acquired from
users who have tried the pattern. Guidelines that
describe how to use patterns and how to integrate
them with other patterns. Each one of these concepts
is required for knowledge sharing purposes, so it is
important give as much information as possible and
as detailed as possible.
The aim of the additional concepts is to make it
easier for other users of the BI environment (in this
case – municipalities) to use and implement the data
analytics solutions with the help of patterns. A pattern
is described by using the concepts defined in the
metamodel (Figure 2) and a pattern template that is
represented in the form of a table. By using these
supplemented patterns, knowledge sharing in
between municipalities is possible.
To demonstrate the pattern approach, one of the
possible data analytics solutions encountered in the
case study – request for a possible solution from a
municipality – will be analyzed and demonstrated in
a form of a pattern.
4.4 Pattern Example – First Use Case
By analyzing the data from municipality citizen
cards, it is possible to predict the flow of the citizens
that are using public transport services. With these
predictions, a plan for the public transport routes – at
what times there should be additional units of public
transports and when there should be fewer, could be
proposed. Therefore, increasing citizen satisfaction
levels with the public transport and eliminating
inefficient public transport usage. However, there are
also public transportations that are functional during
nighttime. These are used by fewer people and data
analysis for this purpose is not require. But both cases
– daytime rides and nighttime rides are noted in the
system and are only separated by timestamps. To
clean the data from nighttime public transport usage
(anomalies) and have a dataset composed only from
daytime public transport usage, an anomaly
identification pattern could be introduced.
The goal of this pattern is to identify anomalies in
the immense amount of available data and separate
them from the “valid” data. By defining this goal, one
of the pattern concepts – “Goal” can be filled with the
respective information. Similarly, the rest of the
concepts are also populated with information. By
analyzing what is the purpose of the pattern and how
the result is acquired, the concepts of the pattern are
described. For “key words” – anomaly identification;
description about the issue pattern addresses
“problem” – distinguish anomalies in data and
analyze the reason for the cause of anomalies; and so
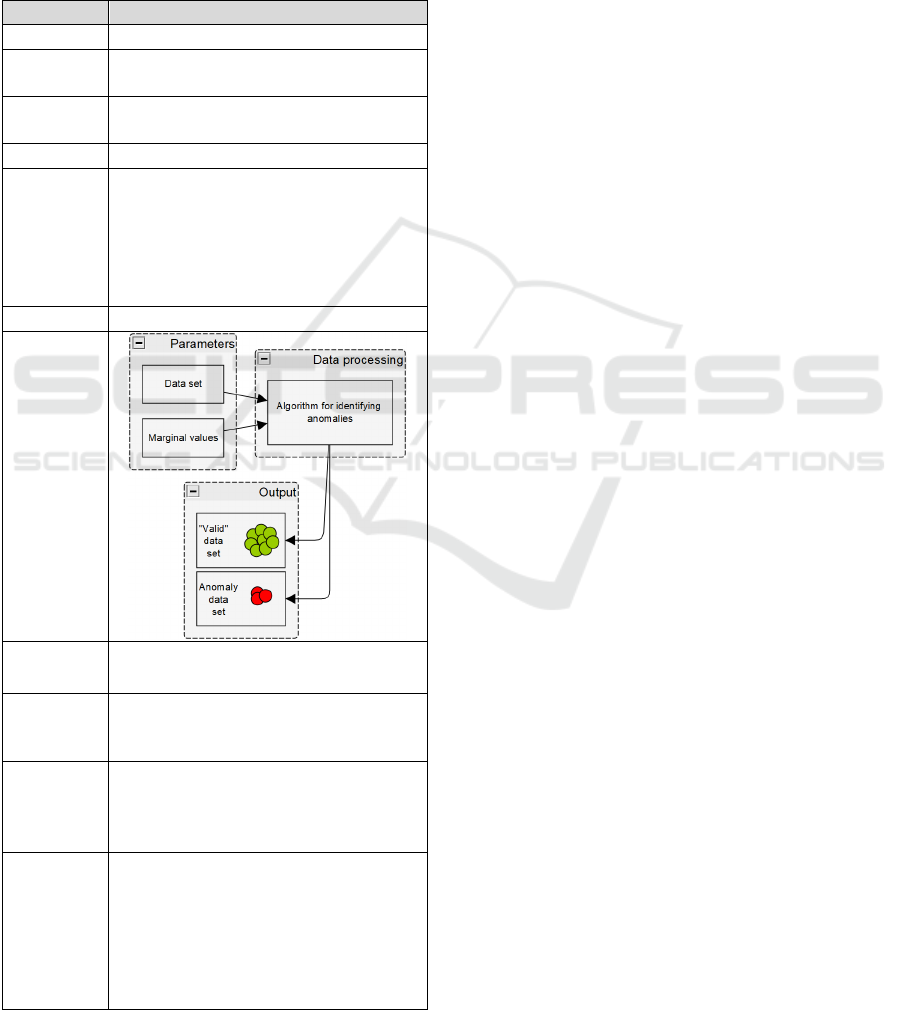
forth for the rest of the pattern concepts. As a result,
we acquire a pattern, in a tabular form, describing the
usage and implementation specifics. The example for
the anomaly identification case pattern, is shown in
Table 1.
The fields “parameter value” and “feedback” have
no information, as there is no universal value that
could be used for anomaly identification, nor are there
any user evaluations available to give a feedback onto
the pattern. By understanding under what
circumstances the pattern can be used (context) and
what the input data should be for the solution to work
(parameters), other users may use the same pattern, if
the problem they encounter is the same, and the
achievable goal matches.
Shown example is only one of the possible pattern
types for data analytics purposes – data analysis
pattern. In total three pattern types were identified.
There is the already mentioned data mining pattern
type and three other types – data extraction,
transformation, and storage; data analysis; and data
visualization and publication. During the data
analytics process there are a set of actions that can be
(combining citizens in groups by age) or need to be
(data extraction from data source) performed. These
actions can be described with the pattern types.
Therefore, for each of the actions, a respective pattern
can be utilized. Meaning, that if there were additional
patterns for extracting municipality citizen card
public transport data and a pattern for visualizing the
“valid” data set, then these patterns could be
combined with the anomaly identification algorithm
KMIS 2020 - 12th International Conference on Knowledge Management and Information Systems
166
pattern and a complete solution, could be proposed.
This would mean, that a complete solution, could be
shared with other municipalities, if all the
preconditions are made for the solution to work. This
shows that patterns have a high potential to not only
provide small solutions, but also create larger ones to
address more complex issues, by combining different
types of pattern solutions.
Table 1: Pattern for anomaly identification algorithm.
N
ame Anomaly identification algorithm
Key words Anomaly identification
Problem
Distinguish anomalies in data and analyze
the reason for the cause of anomalies
Goal
Identify anomalies in large amounts o
f
data
KPI Proportion of anomaly cases in data
Context
Municipality has access to a large
dataset that requires the use o
f
anomaly identification algorithm.
It is important to identify the
anomalies in the data, to analyze i
t
further.
Solution Anomaly identification algorithm
Solution
element
Parameters
Dataset
Data threshold values
Parameter
value
(For this case there is no information, bu
t
when used in practice with available data,
this field will be populated)
Feedback
(For this case there is no information, bu
t
when an actual solution is made and users
report on the solution, feedback will be
associated with this pattern)
Guidelines
To implement this pattern, it needs to
b
e integrated with a resul
t
visualization pattern. The result can be
presented in either the data
visualization tool or as a report. The
result can be combined with othe
r
analytical process patterns.
5 MUNICIPALITY INVESTMENT
INDEX CASE STUDY
The second case study focuses on providing
information about the investment situation in the
municipality – what is the return on investments that
were put into the society of the municipality. Goal of
the case study is to calculate the current period
investment index compared to previous period or
multiple periods. This index is composed from the
well-being of the municipality citizens – citizen
benefits, taxes – taxes paid by citizens or taxpayers,
and taxpayers – natural and legal persons of the
Republic of Latvia or foreign countries and groups of
such persons established on the basis of an agreement
or arrangement, or their representatives, who perform
taxable activities or who are guaranteed future
income. An overall estimation about the current
situation in municipality is calculated by using data
on these aspects as the main justification of the result.
5.1 Data Warehouse
Compared to the first use case scenario, the input data
for this scenario is a lot more complex. The data is
acquired in the form of reports that are represented as
tables. There is a total of 38 reports – 38 tables
representing report data. In these tables, there are only
statistical values that are used to inform the
municipality about the current situation of the
municipality. To use this information, it needs to be
normalized and then additional statistical calculations
need to be made, to acquire values that can be used to
understand the current municipality condition
compared to previous periods. Besides this issue, an
additional problem is that the well-being of
municipality citizens has no correlation with
taxpayers. Citizens and taxpayers have correlation
with taxes, but between citizens and taxpayers there
is no data, that could be used as a possible way to
connect these two aspects.
One of the solutions to the mentioned problems
could be that the citizens (well-being of municipality
citizens) could be separated from taxpayers and made
into two data models. This would solve the problem
with correlation between citizens and taxpayers. To
solve the problem with statistical data, multiple data
transformations need to be carried out. As a result of
these transformations, final values, used to describe
the current situation in the municipality, would be
provided and stored in the fact table.
For this use case, two separate dimensional data
models need to be designed that contain information
related to the well-being of municipality citizens,
Development of Framework for Designing an Analytical Data Warehouse: Case of e-Municipalities
167
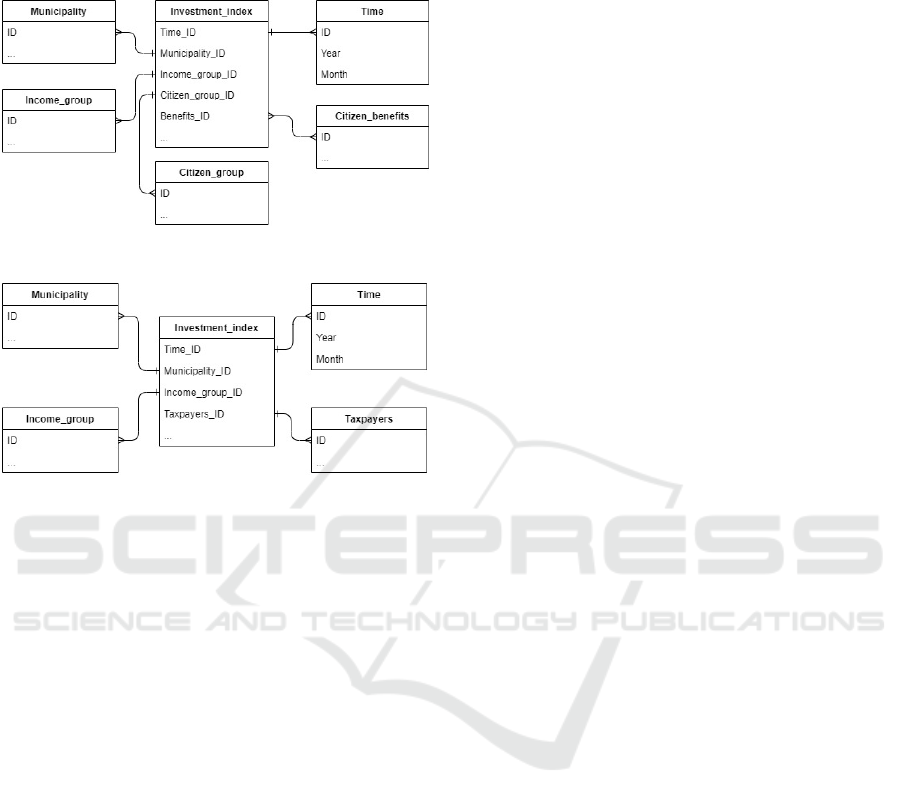
taxes, and taxpayers. Simplified representations of
these data models can be seen in Figure 3 and Figure
4.
Figure 3: Municipality citizen dimensional data model.
Figure 4: Municipality taxpayer dimensional data model.
For the municipality citizen dimensional data
model (Figure 3), similarly to the first use case
dimensional data model (Figure 1), information about
the municipality and time is required and this
information is stored in municipality and time
dimensions. As for the other dimensions –
Income_group stores information about municipality
income (types of taxes) that is acquired from citizens;
Citizen_group stores information about the citizen
group for which the statistics data was gathered
about; Client_benefits stores information about types
of benefits citizens get from the municipality.
For taxpayer dimensional data model (Figure 4)
same as previous dimensional data models,
municipality and time dimensions serve the same
purpose. The other dimensions – Income_group
stores information about municipality income from
taxpayers; Taxpayers stores more specific
information about the taxpayer group for which the
statistics was gathered about.
Having designed the dimensional data models, the
next step is to perform transformations on the data, so
that it would be possible to store it into the data
warehouse.
5.2 ETL Process – Transformation
To acquire data used to report the situation about the
municipality investment index, multiple
transformations need to be performed:
1. Report table data normalization.
2. Average values for statistics data values from
previous periods of all report tables.
3. Latest period statistics data values against
average values (division).
4. Acquiring weights for each of the statistics
data values.
5. Indicator calculation by using division results
and weights for statistics data values.
6. Aggregating acquired indicators and
grouping them to determine the investment
index for the corresponding groups - well-
being of the municipality citizens, taxes,
taxpayers.
As a result, the investment index for each of the
groups is acquired and the return on investment can
be evaluated based on the outcome. With these
transformations, there is no further need for data
mining methods. The result can be further used for
data analysis and data visualization purposes.
5.3 Pattern Example – Second Use Case
Example of a pattern for this use case is about the
ETL process that includes all the calculations
mentioned in Section V.B. Just like the first use case
pattern example, the representation of the pattern is in
tabular form. Each of the concepts is populated with
information that is related to this specific use case. As
a result, a pattern for a problem – extracting statistical
data from report tables to acquire municipality
investment index in comparison to previous periods –
is proposed. As these reports are available for any
municipality in Latvia, this pattern would be useful
for other municipalities to use as well, to acquire
information about the return on investment into the
society.
The proposed pattern for ETL process that
transforms data to calculate investment index for
municipalities, can be seen in Table 2.
In this pattern concepts “Parameter value” and
“Feedback”, same as in first use case, currently have
no values, as this is a simple example. But when used
with actual data and a data warehouses, information
related to data sources, data extraction frequency,
data transformation tasks, target storage, as well user
feedback – information related to these concepts
needs to be provided.
KMIS 2020 - 12th International Conference on Knowledge Management and Information Systems
168
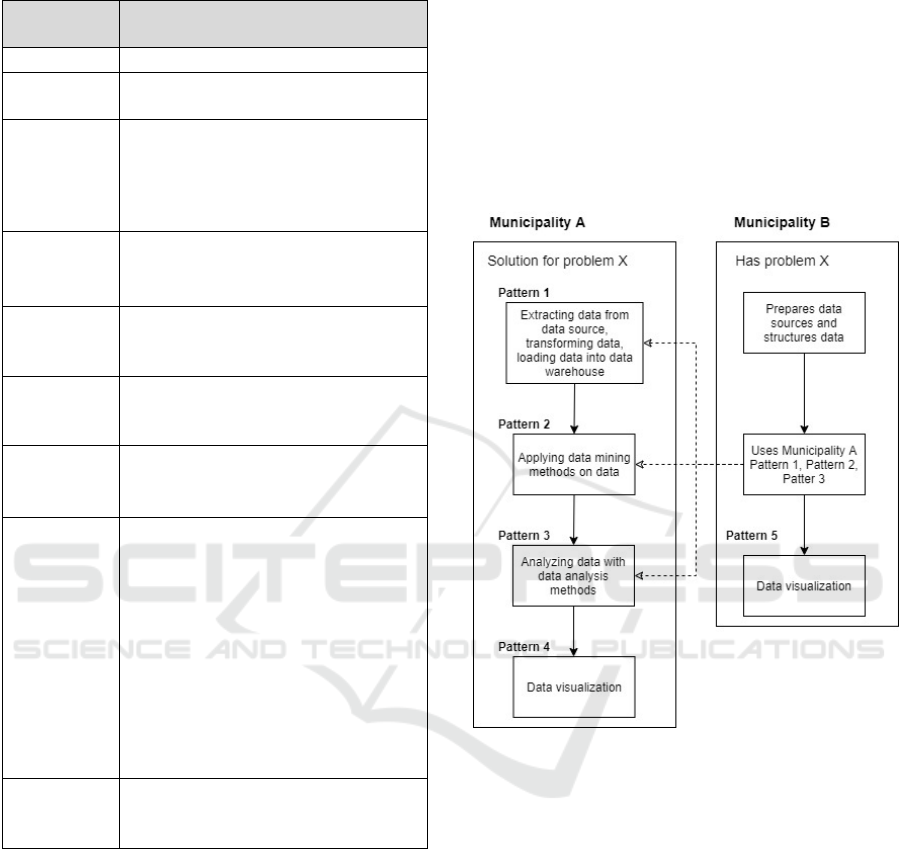
Table 2: Pattern for ETL process for calculating
municipality investment index.
N
ame
ETL process for calculating
municipality investment index
Keywords Investment index; ETL
Problem
ETL process is a mandatory component
for data analytics solutions
Goal
To ensure the process of data collection,
data transformation and data loading
into the data warehouse, that is
necessary for the analysis of repor
t
statistical data
KPI
Performance
Time efficiency,
Resource utilization.
Context
Municipality has access to
a
statistical data about citizens,
taxpayers, and paid taxes
Solution
ETL process, that extracts data from the
data source, transforms the data and the
loads it into the data warehouse
Solution
element
1. Data input
2. Data processing
3. Data output
Parameters
1. Data input
Data source,
Frequency of data extraction.
2. Data processing
Data transformation tasks (a
set of tasks, that describes
how to perform data
transformations mentioned in
Section V.B.).
3. Data output
Target storage.
Guidelines
Frequency of data extraction can be
adjusted and customized according
to requirements
Provided pattern is an example of a data
extraction, transformation, and storage pattern type.
By combining this pattern with a data analysis pattern
and data visualization and publication patterns a
complete solution for municipality investment index
use case can be proposed.
6 SUMMARY
The framework focuses on the development of
patterns that can be used for knowledge sharing
between municipalities. By using a data warehouse
and ETL process, data is stored, transformed, and
analyzed to present a result the municipality is
interested in – this can also be called a business
analytics solution. Patterns are applied to share the
knowledge on how this business analytics solution is
achieved. And by using multiple patterns, it is
possible to present a bigger solution that can solve a
seemingly hard problem in an easy way with the
combination of different types of patterns.
A visual representation on how the approach
proposed in the framework would work, can be seen
in Figure 5.
Figure 5: Example for the approach proposed in the
framework.
In the example, shown in Figure 5, there are two
municipalities – A and B. Municipality A has
implemented a solution for a problem X that they had
encountered at some point and time. The solution
consists of multiple patterns that each have their own
purpose. Municipality B has encountered problem X
just recently and wishes to find a solution to solve this
issue. Municipality B notices, that municipality A,
has a working solution for the same problem, so they
decide to use the proposed solution, expect for the
data visualization part. Municipality B has decided
that it needs to see data in different forms and
diagrams, so they will create their own pattern for this
purpose. To use the proposed patterns – Pattern 1,
Patter 2, Patter 3, Municipality B prepares a data
source and structures the data according to the
directions provided in Pattern 1, for a successful ETL
Development of Framework for Designing an Analytical Data Warehouse: Case of e-Municipalities
169

process. After that, the data is process and analyzed
by using Pattern 2 and Pattern 3. After that, all that is
left, is for Municipality B to use the output data from
Pattern 3 and use it for their own data visualization
purposes that is made into a new pattern – Pattern 5.
By using the pattern approach that is at the base of
the framework, it is possible to provide a shareable
solution for other business cases, that municipalities
are interested in (as seen in Figure 5 and described in
the example). And not only for municipalities, but for
different BI environments as well, where knowledge
sharing can be an important factor. Overall, the
framework can be used as guidelines to implementing
knowledge sharing solutions and understanding how
to use or create new patterns with implemented
knowledge sharing.
7 CONCLUSIONS AND FUTURE
WORK
The groundwork for designing an analytical data
warehouse for the use of e-municipalities has been
proposed. An approach for knowledge sharing with
the help of patterns has been analyzed, research and
developed. Based on the results, the pattern approach
seems to have potential and could be used to provide
complete solutions that are based on multiple smaller
solutions derived from patterns.
The results of the research project will be tested,
and a demonstration for the pattern approach and the
analytical data warehouse will be developed based on
the case studies proposed in this paper.
ACKNOWLEDGEMENTS
The research leading to these results has received
funding from the project "Competence Centre of
Information and Communication Technologies" of
EU Structural funds, contract No. 1.2.1.1/18/A/003
signed between IT Competence Centre and Central
Finance and Contracting Agency, Research No. 1.1
"Analytical Data Warehouse Design Framework for
E-government".
REFERENCES
Nadason, S., Saad, R. A.-J., Ahmi, A., 2017, Knowledge
Sharing and Barriers in Organizations: A Conceptual
Paper on Knowledge-Management Strategy.
Jokste, L., Pirta, R., Rubulis, K. P., Savčenko, E., Vempers,
J., 2019, Knowledge Sharing in BI Ecosystems: Case of
E-Municipalities, Available: http://ceur-ws.org/Vol-
2499/paper4.pdf
Bojang, M., Bwando, W., 2018, E-Municipality
Applications in Local Government: Prospects and
Challenges
Kampars, J. and Stirna, J., 2017, A Repository for Pattern
Governance Supporting Capability Driven
Development. In: BIR-WS 2017, CEUR Workshop
Proceedings. Vol.1898, Denmark, Copenhagen, 28-30
August.
Ahmed, M. Shahat Osman 2019, A novel big data analytics
framework for smart cities, Future Generation
Computer Systems, Volume 91, Pages 620-
633 Available: doi: 10.1016/j.future.2018.06.046
Hiranandani, S. 2017, IBM’s Enterprise Analytics
Reference Architecture, Available:
https://www.ibm.com/blogs/insights-on-business/sap-
consulting/enterprise-analytics-reference-architecture
Arora K. R., Gupta, M. K., 2017. e-Governance using Data
Warehousing and Data Mining, International Journal
of Computer Applications (0975 – 8887) Volume 169 –
No.8, July
Silva, W. M., Alvaro, A., Tomas, G. H.R.P., Afonso, R. A.,
Dias, K. L., Garcia, V. C. 2013, Smart cities software
architectures: a survey, in: Proceedings of the 28th
Annual ACM Symposium on Applied Computing,
Coimbra, Portugal, doi: 10.1145/2480362.2480688
Felipe, E., Santana, Z., Chaves, A. P., Gerosa, M. A., Kon,
F., Milojičić, D. S. 2018, Software platforms for smart
cities: concepts, requirements, challenges, and a
unified reference architecture, ACM Comput. Surv. 50
(6) pp. 104–126. doi: 10.1145/3124391
Kirmani, M., 2017, Dimensional Modeling Using Star
Schema for Data Warehouse Creation, doi:
10.13005/ojcst/10.04.07
Simitsis, A., 2005, Mapping conceptual to logical models
for ETL processes, In DOLAP 2005, pages 67-76.
Alexander C., Ishikawa S., Silverstein M., Jacobson M.,
Fiksdahl-King I., Angel S., 1977, A Pattern Language.
Towns. Buildings. Constructions. Oxford University
Press.
Sherman, R., 2014, Business Intelligence Guidebook,
chapter 9, Morgan Kaufmann, ISBN: 9780124115286.
Agerbo, E., Cornils, A. 1998, How to preserve the benefits
of design patterns, doi: 10.1145/286942.286952.
Buschmann, F., Meunier, R., Rohnert, H., Sommerlad, P.,
Stal, M., 1996, Pattern-Oriented System Architecture:
A System of Patterns.
Fowler, M., 1997, Analysis Patterns: Reusable Object
Model.
Gamma, E., Helm, R., Johnson, R., Vlissides, J., (1995),
Design Patterns: Elements of Reusable Object-
Oriented Software.
Teixeira, R., Afonso, F., Oliveira, B., Portela, F., Filipe, M.,
2014, Business Intelligence to improve the quality of
Local Government Services: Case-Study in Local
Government Town Hall, KMIS – 2014 – Proc. Int.
Conf, Knowl. Manag. Inf. Shar. 153-60.
KMIS 2020 - 12th International Conference on Knowledge Management and Information Systems
170

Nycz, M., Polkowski, Z., 2015 Business Intelligence in a
Local Government Unit, Proceedings of Informing
Science & IT Education Conference (InSITE) 2015, pg.
301 – 311.
Hartley, M., Seymour, L. 2015, Key Success factors for
implementing Business Intelligence in South African
public sector organisations, 9
th
IDIA Conference,
IDIA2015 (pg. 249 – 265).
Hafiz, T. A., Faith, A., 2016, The use of BI software in
Swedish municipalities. The path municipalities take
from adopting BI to actual use of BI, Master thesis 15
HEC, course INFM10 in Information Systems
Presented in 2016 June.
Adelakun, O., 2012, The Role of Business Intelligence in
Government: A Case Study of Swedish Municipality
Contact Center, Master thesis in informatics.
Yadav, M. K., Shakya, S., 2016, Database and Data
Warehouse Status for e-Government System in
Different Ministries of Nepal, International Journal of
Computer Science and Mobile Computing, Vol.5 Issue
1, January 2016, pg. 107-115.
Goar, V., Sarangdevot, S. S., Tanwar, G., Sharma, A., 2010,
Improve Performance of Extract, Transfomr and Load
(ETL) in Data Warehouse, International Journal on
Computer Science and Engineering, May 2010, pg. 786
– 789.
Hanlin, Q., Xianzhen, J., Xianrong, Z., 2012, Research on
Extract, Transform and Load(ETL) in Land and
Recourse Star Schema Data Warehouse, 2012 Fifth
International Symposium on Computational
Intelligence and Design , pg. 120 – 123.
Levene, M., Loizou, G. 2003, Why is the snowflake schema
a good data warehouse design?, Information Systesm,
28(3). 225-240. doi: https://doi.org/10.1016/S0306-
4379(02)00021-2
Oketunji, T. A., Omodara, R. O., 2011, Design of Data
Warehouse and Business Intelligence System: A case
study of Retail Industry, Master thesis in Computer
sciences.
Development of Framework for Designing an Analytical Data Warehouse: Case of e-Municipalities
171
