
Cold Start of Enterprise Knowledge Graph Construction
Rong Duan and Kangxing Hu
Huawei Technology, Shenzhen, China
Keywords:
Enterprise Knowledge Graphs, Cold Start, Link Prediction.
Abstract:
Enterprise Knowledge Graphs(EKG) is a powerful tool for Enterprise Knowledge Management(EKM). Most
EKG construction suffers cold start problem. In reality, EKG construction is an interactive process,in which
domain experts provide a small seed graph, and data driven methods are applied to expand the graph. This
paper proposes a framework to solve EKG cold start problem by integrating graph form expert knowledge
with non-graph form corpus. The proposed framework employs expert knowledge to guide unsupervised
learning, and crosses check the quality of expert knowledge simultaneously. A coarser cluster level and finer
entity level vectorization is proposed to predict the link between graph nodes and cluster words. And also,
a combined strategy is adopted to measure the importance of the predicted link, and provide to the expert
to evaluate incrementally. The proposed framework solves the ”labor intensive” EKG cold start construction
problem and utilizes expert knowledge efficiently. Simulation is generated to illustrate the properties of defined
measurements, and real-world application is discussed to show the challenges in practices.
1 INTRODUCTION
Basically, there are two types of KG construc-
tion techniques: data-driven or manpower driven.
Most open-domain KGs are constructed through data-
driven method. It either has a large knowledge base
at the start point, or has a large corpus that can extract
knowledge from. For example, Yago roots from the
large knowledge base Wikipedia, WordNet and Geon-
ame(Suchanek et al., 2007). NELL (Carlson et al.,
2010) extracts knowledge from hundreds of millions
of web pages. For specific domain, the KG construc-
tion heavily depends on domain experts. Especially
in solving cold start problem. Expert driven method
is efficient in a relative narrow area or a field with rela-
tive complete ontology. Successful applications such
as Amazon product graph(Dong, 2018), medical re-
lated knowledge graphs(Ramaswami, 2007)(Ferrucci
and Brown, 2011).
Enterprise Knowledge Graph(EKG), as a tool
for Enterprise Knowledge Management(EKM), is far
more complicated than specific domain applications.
The comparison of open domain, specific domain and
EKG has discussed in the tutorial(Duan and Xiao,
2019). Usually EKG covers different knowledge do-
mains, and the ontology design is time consuming
and labor intensive, which is the bottle neck of EKM.
Even though many industries have collected more and
more data with digital transformation, the size is still
not comparable with open domain.
A big challenge that modern EKM faces is how to
utilize the data and extract knowledge from it. Data
driven Knowledge Graphs have been receiving more
and more attention in enterprise. There are research
in studying the EKG framework(Galkin et al., 2017),
components and construction steps (Pan et al., 2017),
but the cold start problem of knowledge acquisition
hasn’t been addressed in details yet. This is a prob-
lematic issue that holds up the step for enterprise to
adopt the knowledge graph approach in EKM.
In practice, EKG starts with a small expert con-
structed seed graph, and a moderate size corpus can
be used to expand the graph. The problem can be
decomposed into four subproblems as described fol-
lowing:
1. Validate the correctness of expert designed seed
KG.
2. Link the words in cluster with nodes in graph.
3. Integrate expert knowledge with data.
4. Design the predicted link evaluation criteria.
This paper proposes a framework to answer above
questions. Our main contributions are three points.
First, dispersion and reachability are defined to mea-
sure the relation between graph structure and cluster
Duan, R. and Hu, K.
Cold Start of Enterprise Knowledge Graph Construction.
DOI: 10.5220/0010055301530160
In Proceedings of the 12th International Joint Conference on Knowledge Discovery, Knowledge Engineering and Knowledge Management (IC3K 2020) - Volume 3: KMIS, pages 153-160
ISBN: 978-989-758-474-9
Copyright
c
2020 by SCITEPRESS – Science and Technology Publications, Lda. All rights reserved
153

results. This is the first to use graph-form and non-
graph-form data to learn from each other, which pro-
vides a method to integrate expert’s prior knowledge
with unsupervised learning. Second, the entities are
vectorized by the cluster results, and the link predic-
tion between the graph nodes and words in cluster is
decided by the similarities of the coarser cluster level,
and the finer entity level. Third, an important-based
incremental method is proposed to evaluate the pre-
dicted links.
The rest of the paper is organized as follows: Sec-
tion 2 introduces the related work and problem state-
ment. Section 3 provides definitions and methodol-
ogy. Section 4 discusses the issues in real-application.
Section 5 concludes the paper and gives the future di-
rection.
2 RELATED WORK
Graph-based methods have been used widely in
classification and clustering problems. If the
data is graph-form, graph properties will apply di-
rectly(Rogers and Hahn, 2010)(Shervashidze et al.,
2009)(Geng et al., 2012)(Fortunato, 2009). If the
data is non-graph-form, a graph will be constructed
first, and then apply graph properties(Wang et al.,
2005)(Wu et al., 2018)(Zhang and Lee, 2007)(Zhu
et al., 2003).
This is different from our problem setting. We
have two data sets, one is in graph-form that con-
structed by experts, and the other is non-graph-form
that extracted from corpus.
Another related work is link prediction, especially
for cold start link prediction. Traditional link pre-
diction methods base on graph structure or labeled
data similarity (L
¨
u and Zhou, 2011)(Mart
´
ınez et al.,
2017)(Taskar et al., 2004)(Menon and Elkan, 2011).
Our problem setting is to predict the link between the
nodes in graph and words in clusters. The entities
are not in the graph yet, the graph structure based
link predict doesn’t fit. And also, attributes similar-
ity based or labeled data based methods don’t fit our
short of labels and lack of attributes corpus.
Many steps are involved in constructing KG from
scratch. Here we only focus on the stage where ex-
perts have manually constructed an initial KG,G
0
=
{V
0
,E
0
}, and are willing to expand the G
0
with the
corpus. V
0
represents node and E
0
represents edge. V
0
only has name as its attributes, and E
0
indicates the ex-
isting of relation. The corpus has been segmented to
words or phrase(Shang et al., 2017)(Liu et al., 2015),
noted as W. The nodes in V
0
, but not in W are noted
as V
00
, The words in W , but not in V
0
are noted as
W
00
. W
00
are candidates of graph nodes. The objec-
tive is to expand the original G
0
with W
00
to form a
new G = {V,E}. In general, |V
0
| |W | for the initial
states, where |V | is the number of V . Clustering tech-
nology is applied to W to form multiple clusters, rep-
resented as C
k
, where k ∈ [1,K], and |C
k
| represents
the number of words/phrases in the cluster C
k
.
3 DEFINITIONS AND
METHODOLOGY
3.1 Definitions
Given graph G = {V, E}, and cluster results C
k
, where
k ∈ [1, ··· , K], dispersion ζ and reachability ρ are de-
fined to measure the relation between graph G and
cluster C
k
, Cluster-based node vector representation
is defined to predict links.
3.1.1 Dispersion
Node dispersion ζ measures the neighbour nodes dis-
tribution in clusters. let’s denote Γ(V ) as node V ’s
1-degree ego-centric network, |Γ(V )| represents V ’s
degree. Dispersion of node V is defined as :
ζ
V
= tanh(−
∑
k
p
Γ(V )∈c
k
log p
Γ(V )∈c
k
log(|Γ(V )| + 1)
) (1)
where p
Γ(V )∈c
k
=
|Γ(V )
T
c
k
|
|Γ(V )|
, and log(|Γ(V )| + 1) is
normalization factor to adjust ζ
V
’s concentration ten-
dency for lower degree nodes.
ζ
V
is tanh transferred normalized entropy. It mea-
sures V ’s neighbors distribution in clusters. The prop-
erties of ζ are:
1. ζ ∈ [0,1], due to tanh transformation.
2. ζ
V
= 0, when there is only one cluster K = 1.
3. ζ
V
→ 0, means node V’s direct neighbours is rel-
ative synchronize with cluster results.
4. ζ
V
is monotonic increase function with the num-
ber of clusters Γ(V ) spread into, when cluster
method has hierarchical structure.
The properties (1),(2),(3) are straight forward. And
the proof of property (4) can be changed to en-
tropy and conditional entropy relation problem, which
equivalent to the problem that information gain is
nonnegative, which can be proofed easily.
Dispersion ζ measures the synchronousness be-
tween graph structure and cluster results from graph
point of view. In general, if a node’s neighbor is
spread in different clusters, its dispersion is high. If
KMIS 2020 - 12th International Conference on Knowledge Management and Information Systems
154

the dispersion for most of the nodes in graph is high,
it means the cluster result is not in sync with graph
structure, the neighbor nodes in graph are spread in
different clusters, and the clusters should be com-
bined. The expected dispersion E(ζ) will decrease as
the cluster number decreases until it becomes 0 when
every cluster is combined into one cluster.
Figure 1: A graph with 5 nodes and 5 edges.
Let’s say we have a graph as shown in Figure
1, and cluster method separates the data into 3 clus-
ters: C
1
= {A, B,C}, C
2
= {E}, and C
3
= {D}. For
nodes A and C, both of their 1-degree ego-centric
network are {A,B,C}. All of these nodes are in
C
1
. Γ(A) = Γ(C) = {A,B,C}. According to Eq:1,
ζ
A
= ζ
C
= 0. For node B, its 1-degree ego-centric net-
work is Γ(B) = {A,B,C, E}, 3 of 4 nodes in C
1
, 1 of
4 nodes in C
2
, and |Γ(B)| = 3, then ζ
B
= 0.38. Same
for nodes D and E, their dispersion are ζ
D
= 0.78, and
ζ
E
= 0.76 respectively. Compared with these 5 nodes,
A and C’s ego-centric nodes are only in one clus-
ter, and their dispersion are 0. B and D’s ego-centric
nodes are in two clusters, but D only has 1 degree, and
B has 3 degree. Adjusted by degree, ζ
B
< ζ
D
. Now,
let’s see the situation when decrease the number of
clusters. Combining cluster 2 and 3, the dispersion of
all the nodes change to ζ
A
= ζ
C
= ζ
D
= 0, ζ
B
= 0.38,
and ζ
E
= 0.52. All the nodes’ dispersion become 0, if
further combine all clusters into one.
ζ has the tendency to combine clusters. To avoid
this situation, cluster reachability ρ
k
and expected
cluster reachability ρ are introduced.
3.1.2 Reachability
Cluster Reachability. ρ
k
is defined by average short-
est path of all pairs of nodes in the graph G that over-
lapped with the cluster k. The nodes that are in G,
but not in any cluster are considered when form the
shortest path.
ρ
k
=
∑
(SP(i, j))
|i, j|
k
i, j∈(C
k
T
G)
(2)
where |i, j| is the number of node pairs. Cluster reach-
ability ρ
k
compares the cluster result with graph struc-
ture from cluster point of view. It measures the short-
est path in graph of each pair of words in cluster k.
The smaller the ρ
k
, the closer the words are in the
graph under this cluster method.
The nodes that in graph, but not in any cluster
are considered while calculate reachability, which to
avoid disconnected graphs situation.For example, in
Figure 1, if node E is not in W , and the cluster re-
sults are assumed as {{A,C}, {B,D}}. The reachabil-
ity of cluster {A,C} and {B,D} are 1 and 2 respec-
tively,where E is considered in calculating ρ
{B,D}
,
even though E is not in cluster result. And also, prac-
tically, these nodes are the semantic nodes created by
domain experts, which help in understanding the se-
mantic meaning of related nodes.
Expected cluster reachability ρ is defined to com-
pare the cluster results with different number of clus-
ters.
Expected Reachability. ρ is the sum of weighted
cluster reachability ρ
k
for all clusters. The weight
is the proportion of number of words in each cluster
against number of all words.
ρ
C
=
∑
k
|C
k
|
|W |
ρ
k
(3)
The value of ρ represents average steps of separa-
tion of the cluster words in graph. The smaller the ρ,
the closer the words are in the graph. Referring back
to Figure 1, if the clusters are {{A,B,C},{E},{D}},
the cluster reachability are {1,0,0}, and the weights
are {
3
5
,
1
5
,
1
5
} respectively. The ρ is 0.6. If the cluster
result is {{A,B,C},{E,D}}, ρ = 1. If all the nodes are
in one cluster, ρ = 1.7. The idea situation is that ρ is
close to 1, which means the words in each cluster are
in one degree ego-centric network in the graph.
Properties of ρ:
1. ρ ∈ (0,d(g)]. where d(g) is the diameter of graph
g
2. ρ = d(g),when there is only one cluster K=1.
3. ρ = 1, when each cluster is clique, and there is no
isolated single nodes.
4. ρ is monotonic decrease with the number of clus-
ter increase, when the cluster method has hierar-
chical structure.
Proof of property (4): Since the hierarchical clus-
tering result, we can assume the split cluster is s,
and c
s
= c
0
s
+ c
00
s
. To proof ρ is monotonic decrease
with the number of cluster, we only need to proof
ρ
C
s
≥ ρ
C
s
0
+ ρ
C
s
00
. The whole proof process is illus-
trated following.
Cold Start of Enterprise Knowledge Graph Construction
155

ρ
C
s
≥ ρ
C
s
0
+ ρ
C
s
00
|C
s
|
|W |
∑
|i, j|
SP(i, j)
|i, j|
≥
|C
0
s
|
|W |
∑
|i
0
, j
0
|
SP(i
0
, j
0
)
|i
0
, j
0
|
+
|C
00
s
|
|W |
∑
|i
00
, j
00
|
SP(i
00
, j
00
)
|i
00
, j
00
|
|C
s
|
∑
|i, j|
SP(i, j)
|i, j|
≥ |C
s
|
∑
|i
0
, j
0
|
SP(i
0
, j
0
)
|i
0
, j
0
|
+ |C
s
|
∑
|i
00
, j
00
|
SP(i
00
, j
00
)
|i
00
, j
00
|
∑
|i, j|
SP(i, j)
|i, j|
≥
∑
|i
0
, j
0
|
SP(i
0
, j
0
)
|i
0
, j
0
|
+
∑
|i
00
, j
00
|
SP(i
00
, j
00
)
|i
00
, j
00
|
∑
|i
0
, j
0
|
SP(i
0
, j
0
)
|i
0
, j
0
|
+
∑
|i
00
, j
00
|
SP(i
00
, j
00
)
|i
00
, j
00
|
≤
∑
|i, j|−1
SP(i, j)
|i, j| − 1
− 1
∑
|i, j|
SP(i, j)
|i, j|
≥
∑
|i, j|−1
SP(i, j)
|i, j| − 1
− 1
∑
|i, j|
SP(i, j)
|i, j|
≥
∑
|i
0
, j
0
|
SP(i
0
, j
0
)
|i
0
, j
0
|
+
∑
|i
00
, j
00
|
SP(i
00
, j
00
)
|i
00
, j
00
|
As illustrated above, the cluster reachability ρ is
equal to 1 when cluster words are direct connect to
each other in the graph. ρ has the tendency to sep-
arate the data into too many clusters. Neither ρ nor
ζ can be used stand alone. For example, in the
graph as shown in Figure 2, if the cluster result is
{{A,B},{C,F},{E,D}}, the ρ is 1, and the ζ equals
to 0.46; If the cluster result is {{A,B,C,F},{E,D}},
the ρ still equals to 1, but the ζ becomes to 0. The
reachability of these two results are the same, but the
dispersion for the 2nd cluster result is smaller. The
second cluster result is better than the first one, since
every words in cluster are directly linked to each other
in the graph.
Figure 2: A graph with a 4-nodes clique and 2-nodes clique.
Simulation data is generated to further illustrate
the properties of ζ and ρ. A random 1000 nodes
erdos-renyi graph is generated with edge probability
0.005. Edge betweeness is adopted as hierarchical
clustering method. And the number of cluster is set
from 1 to 100. The experiment repeats 50 times. The
changes of ζ and ρ according to the number of cluster
are shown in the Figure: 3. ζ is monotonic decrease
with the number of cluster increase, and ρ is vice-
verse.
3.1.3 Entity Vectorization
To predict the link between the nodes in graph with
the words in cluster, let’s define entity’s cluster-based
vector representation. Let K represents the number of
clusters, and ν
W
represents the vector of word W .
(a) (b)
Figure 3: (a) Dispersion monotonic increase with the num-
ber of cluster;(b) Reachability monotonic decrease with the
number of cluster;Solid black line is mean and dashed red
line is variance.
|ν
W
| is the length of vector, and |ν
W
| = K, ν
W
k
is the
value of kth bit of W .
ν
W
k
=
1,whileW ∈ C
k
0,whileW /∈ C
k
With this vector representation, the link prediction
algorithm is designed as two-steps approach:
1. Cluster-Subgraph Linkage: each cluster C
k
will
link to a node V
i
’s ego-centric network Γ(V
i
),
where i = argmax(JS(C
k
, Γ(V
i
))), JS is Jaccord
similarity.
2. Cluster Member - Subgraph Node Linkage: each
cluster member will link to a graph node where
argmax(cosine(ν
C
p
k
, ν
Γ(V
i
)
V
q
)). ν
C
p
k
is the vec-
tor representation of entity p in cluster C
k
, and
ν
Γ(V
i
)
V
q
represents the vector of nodes V
q
that is
node V
i
’s direct neighbour, where V
i
is identified
in the first step.
3.1.4 Link Validation
Link validation is another challenge problem in KG
expansion, especially during the cold start phase.
In EKM system, the initial graph G
0
is far from
complete, and the knowledge consumption base on
this graph is poor. The quality validation of the new
link is through expert.
To efficiently utilize expert resources under |V
0
|
|W
00
|, this paper proposes a score κ
W
00
to measure the
importance of each nodes. The score is the average
of degree centrality, betweeness centrality and close-
ness centrality. The nodes with high κ
W
00
score are
recommended to experts. The validated graph is send
back to replace seed graph. The words W
00
are added
incrementally.
3.2 Methodology
This section describes how to use previous defined
measurements to expand G’ to G with W. The frame-
work is illustrated in Figure 4. Three key modules are
KMIS 2020 - 12th International Conference on Knowledge Management and Information Systems
156

shown in thicker solid rectangle boxes: Cluster Num-
ber Determination and Seed Graph Validation, Link
Prediction, and Incremental Validation. Other NLP
techniques, like Word Segmentation, Phrase Finding,
Named Entity Recognition,etc are important, but not
in the scope of this paper. We put all these steps in
Preprocess box. This framework only considers the
stages where the corpus are ready to do cluster, and
there exits a small seed graph.
3.2.1 Cluster Number Determination
Cluster Number Determination is the critical module
in this framework. Both Link Prediction and Incre-
mental Validation modules base on the result of this
one. As discussed in Section 2, we have an initial
G
0
from experts, and a cluster results from cluster-
ing method. The largest possible number of cluster is
|N
0
|, where |N
0
| is the number of nodes in initial G
0
.
As illustrated in Section 3, ζ is monotonic decreases,
and ρ is monotonic increases. The cross point of ζ
and ρ is the best number of cluster. In reality, it is
not necessary to start from |N
0
|, just pick the num-
ber that doesn’t miss the cross point of ζ and ρ. The
advantage to use the balance of ζ and ρ to determine
the cluster number is that it integrates domain expert’s
knowledge with data. On one side, these two sources
compliment each other with missing information. At
the same time, it solves the lack of label, missing at-
tributes and not large enough corpus issues.
3.2.2 Extra Nodes in Graph
There is situation that not all nodes in G’ are in clus-
ters, which means the entity specified by the expert
might not be in corpus. For example, the semantic
level entity might not exist in corpus directly. These
nodes are represented as V
00
. To exploit this extra in-
formation, V
00
needs to be added to clusters. There are
two scenarios to add V
00
.
1. Scenario 1: Add V
00
to the cluster that V
00
is on the
shortest path when calculating ρ
C
k
.
2. Scenario 2: If V
00
hasn’t been added in Scenario
1, Add V
00
to the clusters that satisfy either of the
following two conditions:
(a) has the most V
00
’s common neighbours;
(b) the normalized common neighbor(Jaccard) is
larger than a threshold.(We set 50% here).
V
00
is critical node for the cluster in the first scenario.
For the second scenario, it complements cluster in-
formation. The first condition picks the cluster that
has the most common neighbor with V
00
, and the sec-
ond condition makes sure all those clusters that have
a large portion of V
00
’s neighbors are included. V
00
is
added to the clusters directly while calculating ρ for
scenario 1. V
00
is added after the cluster number
3.2.3 Seed Graph Validation
To evaluate the quality of seed graph, the node that is
not in any common clusters with its neighbours are se-
lected to re-evaluate by experts. Using Figure 1 as ex-
ample, if the cluster result is {{A,D}, {B,C}, {B,E},
{D,E}}, A
0
s neighbour Γ(A) is B and C. B and C are
in clusters {B,E}, {B,C}. A is not in any of these two
clusters. A’s relation with all its neighbours will be
re-examined by experts.
∀V
0
∈ G
0
;i f (|V
0
\
C
Γ(V
0
)
|) = 0,checkV
0
⇔ Γ(V
0
)
3.2.4 Link Prediction
After determining the number of clusters, the next
step is link prediction between graph nodes and clus-
ter members. It is straight forward if there is only one
entity from a cluster that exists in the graph. But in
most situation, there will be more entities in the graph
from the same cluster. Still using Figure 1 as ex-
ample. If the corpus includes {A,B,C,D,F,G,H,I,K},
and are grouped into four clusters: C
1
:{A,F,G}, C
2
:
{A,B,K,H}, C
3
: {C,D,H,I} and C
4
: {B,F}. The rela-
tion between cluster member and graph can be sum-
marized into 4 scenarios:
• Scenario 1: Only one cluster member exists in
the graph, and the other non-graph members only
associate with that specific cluster
• Scenario 2: Only one cluster member exists in the
graph, and the other non-graph members might
exist in different clusters
• Scenario 3: There are multiple cluster members
exist in the graph, and the other non-graph mem-
bers only associate with that specific cluster
• Scenario 4: There are multiple cluster members
exist in the graph, and the other non-graph mem-
bers might exist in different clusters
In the above example, G belongs to scenario 1, F be-
longs to scenario 2, K and I belong to scenario 3 and
H belongs to scenario 4.
To solve the link prediction problem to cover these
4 scenarios, we follow the method in Section 3.1.3,
which finds the coarser cluster level linkage first, and
finer individual entity level linkage second. The result
for the cluster level linkage is shown in Table:1
Node E is added to the cluster {C,D,H,I} first
according to Section 3.2.2, where E is on the short-
est path between C and D. Table: 1 provides the
Cold Start of Enterprise Knowledge Graph Construction
157
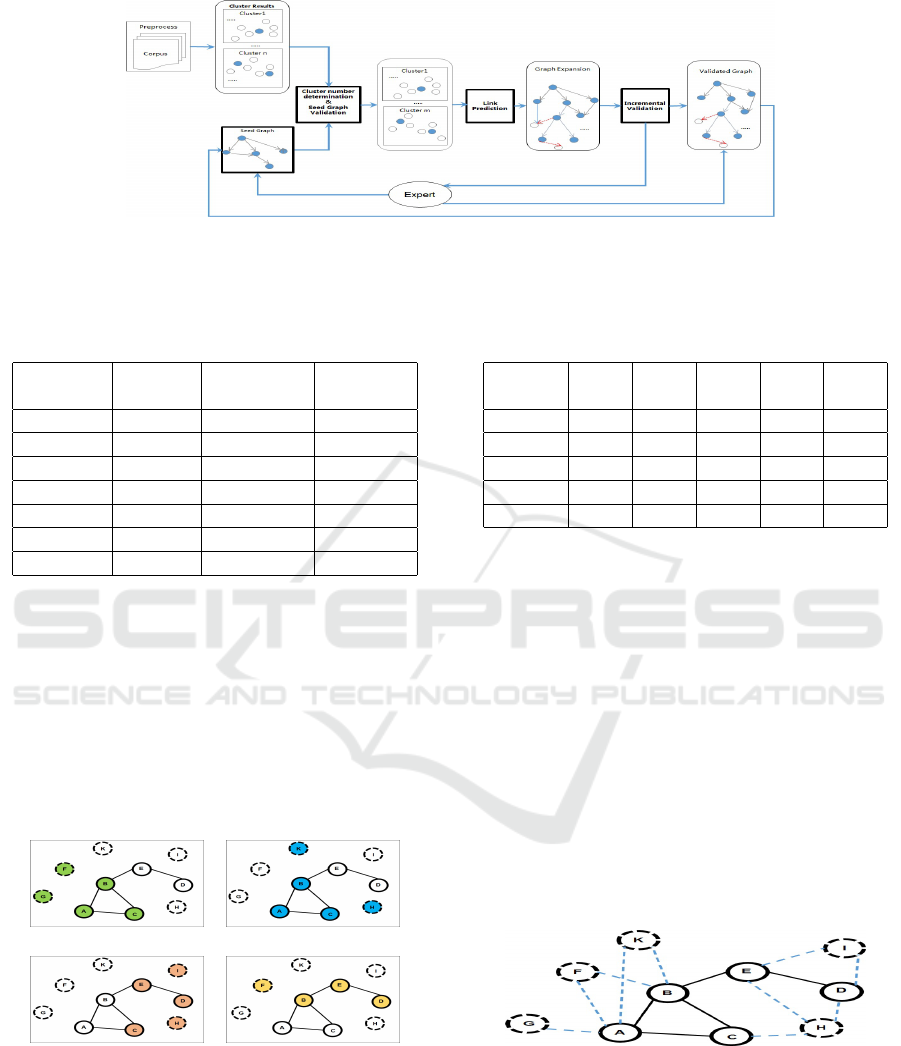
Figure 4: Framework components: rectangle boxes are modules, and round boxes are results. Solid dots represent entities
from expert, and empty dots represent entities from Corpus. Thicker solid rectangle boxes are the key components. After
important predicted links are validated, the validated graph is send back to replace Seed Graph, and incrementally expand the
graph.
Table 1: Link Prediction: Cluster Alignment.
Cluster New ego-centric JS(G
0
,C
k
)
Members Clusters Networks
AFG AFG ABC 1/5
ABKH ABKH ABC 2/5
ABKH ABKH ABCE 1/3
CDHI CDHIE ABC 1/7
CDHI CDHIE DE 2/5
CDHI CDHIE BED 1/3
BF BF ABCE 1/5
detail calculation. Both cluster {A, F,G} and clus-
ter {A,B,K,H} match with A ’s ego-centric network
{A,B,C}, cluster {C,D,H,I} matches with E’s ego-
centric network {B, D,E}, and cluster {B,F} matches
with D’s ego-centric network {D,E}. The sub-graph
and cluster matching results are shown in Figure: 5.
The solid nodes are the nodes in graph, and dashed
nodes are the candidate nodes that to be added to the
graph. The color indicates the coarser level cluster
alignment.
(a) (b)
(c) (d)
Figure 5: Solid circles are notes in graph, and dotted cir-
cles are candidate entities. The same color represents the
same alignment. (a) Cluster {AFG} aligns with A’s ego
network {ABC}; (b) Cluster {ABKH} align with A’s ego
network ABC; (c) Cluster {CDHI} align with E’s ego net-
work {BDE};(d) Cluster {BF} align with D’s ego network
{DE}.
Table 2: Link Prediction: Entity Linkage.
A B C D E
1100 0101 0010 0010 0001
H-0110 0.5 0.5 0.71 0.71 0.71
K-0100 0.71 0.71 0
I-0010 0 1 1
F-1001 0.5 0.5 0 0
G-1000 0.71 0 0
After the cluster alignment, the second step of link
prediction is to link the individual entities. Since H
is in both clusters {A, B,K, H} and {C,D,H,I, E},
and these two clusters link to B’s and E’s ego-centric
network, {A,B,C,E} and {B, E,D} respectively. H
needs to compare the similarity with all the exist-
ing nodes A,B,C,D, and E. K only exists in cluster
{A,B,K,H}, and {A, B,K, H} has larger Jaccord In-
dex with A’s ego-centric network {A, B,C}, compar-
ing with B’s ego-centric network {A,B,C,E}. K only
needs to compute the cosine similarity with nodes
A,B,C. Follow the same logic, I needs to compare
with B,E and D, F needs to compare with A,B,C and
E. The computed cosine similarities are shown in Ta-
ble 2, and the graph after the link prediction is shown
in Figure:6
Figure 6: Dashed line are predicted link.
3.2.5 Incremental Validation
After adding W
00
to G
0
, the expert evaluation is needed
to confirm the expansion. When |V
0
| |W
00
|, the cri-
teria to recommend W
00
to be evaluated is important.
We adopt the incremental method to recommend to
KMIS 2020 - 12th International Conference on Knowledge Management and Information Systems
158

Table 3: Procedure to extend G’ with W
00
.
Procedure of expand G’ with W
Initial:
1: Input expert designed graph G
0
= {V
0
,E
0
}
2: Initial number of cluster K = |V
0
|,
Find the best cluster number K:
3: While K >= 2
4: Cluster W into C
k
, k ∈ [1,K] with hierarchical cluster method
5: for each node V
0
∈ G’
6: calculate dispersion ζ
V
0
7: for each topic C
k
, k ∈ [1, K]
8: calculate reachability ρ
C
k
9: if V
00
is on the shortest path while calculating ρ
C
k
10: add V
00
to C
k
11: if µ(ζ
V
0
) <= 0.2, and ρ ≈ 1, exit;
12: else K = K - skip, go back to Step 3
13: The best K is the cross point of ζ
V
0
and ρ
C
k
14: if V
00
is not in C
15: addV(V
00
, C)
Seed Graph Validation G
0
:
16: for each V
0
i
∈ V
0
17: if |V
0
i
T
C
Γ(V
0
i
)
| = 0
18: output V
0
i
and Γ(V
0
i
) for re-evaluation
Expand G’ with W
00
19: vectorlize V
0
and W base on cluster result from Step 16
20: for each V
0
i
∈ V
0
21: calculate J
V
0
ik
between Γ(V
0
i
) and C
k
22: find J
V
0
ik
> 0.5 or argmax
k∈[1,K]
(J
ik
)
23: for each k in Step 19
24: calculate cosineV
V
0
i
,V
W
j
, where V
0
i
∈ Γ(V
0
),W
j
∈ C
k
25: find argmax
cosineV
V
0
i
,V
W
j
,add link between W
j
and V
0
i
Evaluate W
00
26: for each W
00
added to graph
27: if form a cycle for relation forbidden cycle, output W
00
28: else calculate κ
W
00
29: Sort κ
W
00
from high to low for validating.
30: form new graph G after validation and send back to Step 1.
function addV(V
00
,C):Add V
00
to Clusters:
1: for each V
00
i
∈ V
00
2: calculate J
V
00
ik
between Γ(V
00
i
) and C
k
3: find J
V
00
ik
> 0.5 or argmax
k∈[1,K]
(J
ik
)
4: Add V
00
i
to C
k
experts. First the degree centrality,closeness central-
ity and betweeness centrality are combined to rank the
candidate W
00
. Recommend W
00
to experts that have
its combined score larger than a threshold. After ex-
pert validation, the new graph is send back to replace
the seed graph. The whole process repeats till all W
00
have been added to G or all W
00
’s combined score is
smaller than threshold.
The summarized procedure is illustrated in Ta-
ble 3.
4 EXPERIMENTS
The proposed framework has been tested on an Enter-
prise Finance Knowledge Management System. The
corpus are collected from official documents and in-
ternal community discussion blogs. Rules, regula-
tions, policies, and manually collected Q&A regard-
ing accounting, tax, capital, etc are covered. The ob-
jective is to construct multiple intelligent bots that can
answer questions or serve as searching engine. The
detail is removed to reserve the company’s property.
The procedure will be discussed through the graph
properties without loss generality. The size of cor-
pus is few Gigabytes, and the initial expert designed
seed graph has few hundred nodes, and most in hi-
erarchical relation. The density of the seed graph is
0.031. We can use HAC to get the monotonic increase
and decrease ζ and ρ here, but the character simi-
larity based clustering method lacks of latent topic,
which doesn’t fit well for our situation. We adopt
LDA model in practice. Even though LDA is not strict
hierarchical clustering method, the cluster result will
form a hierarchical-like result if the corpus has good
hierarchical structure. Even though ζ and ρ will not
have increase or decrease function monotonically, but
the increase and decrease trend is good enough. We
set the maximum topic number as the half of the seed
graph nodes, and gradually reduce the topic number
till to one. Dispersion ζ decrease slowly with the
number of topics reduce till a change point. After
the change point, ζ drops quickly, which means graph
structures are more concentrate in clusters. Reacha-
bility ρ has the trend to increase with the number of
topics decrease, but it is not monotonic. There are
situations that ρ
k
≤ ρ
k+1
. Globally, ρ increases with
the number of topics decrease. In practice, we use the
trend of ρ instead of the actual line to find the cross
point with ζ. The changes of dispersion and reacha-
bility with the number of cluster for the first round is
shown in Figure: 7.
After validation, the final graph has around few
thousand entities, with density as 0.23. After the cold
start, the base graph serves different bots, and ex-
panded through the usage. The whole EKM system
has been running for one year, and have accumulated
close to million entities.
Figure 7: Dispersion and Reachability for real application.
There are some issues we would like to address
here in practice. First, In enterprise, the corpus have
low frequency and high precision, which is a chal-
lenge for frequency based data-driven method; Sec-
Cold Start of Enterprise Knowledge Graph Construction
159

ond, the construction of seed graph can adopt the En-
terprise Architecture, which provides a comprehen-
sive view of business; and the last, expert knowledge
needs crowd sourcing too, especially when the knowl-
edge are cross different domains. And the validation
of expert driven crowd sourcing is another challenge.
5 CONCLUSION
This paper proposes a framework to solve enterprise
knowledge graph cold start problem. The proposed
framework takes the advantage of graph-formed ex-
pert knowledge, and use it to guide the clustering
method, which integrates expert knowledge with data
driven clustering.
Coarser cluster level linkage, and finer entity level
linkage are adopted base on entity vectorization. In-
cremental validation is used to gradually add the
words in graph. The framework is validated through
an enterprise finance knowledge graph to support rea-
sonable knowledge consumption. Search engines and
Q&A apps will be constructed base on this graph, and
the current available data-driven techniques will be
used to expand and fine tune the graph.
REFERENCES
Carlson, A., Betteridge, J., Kisiel, B., Settles, B., Jr., E.
R. H., and Mitchell1, T. M. (2010). Toward an archi-
tecture for never-ending language learning.
Dong, X. L. (2018). Challenges and innovations in building
a product knowledge graph. In 24th ACM SIGKDD
International Conference on Knowledge Discovery
&Data Mining, pages 2869–2869.
Duan, R. and Xiao, Y. (2019). Enterprise knowledge graph
from specific business task to enterprise knowledge
management. In Proceedings of the 28th ACM Inter-
national Conference on Information and Knowledge
Management, CIKM ’19, page 2965–2966.
Ferrucci, D. and Brown, E. (2011). Adaptwatson: A
methodology for developing and adapting watson
technology. IBM, Armonk, NY, IBM Res. Rep.,
RC25244.
Fortunato, S. (2009). Community detection in graphs.
Physics Reports, 486(3):75–174.
Galkin, M., Auer, S., Vidal, M.-E., and Scerri, S. (2017).
Enterprise knowledge graphs: A semantic approach
for knowledge management in the next generation of
enterprise information systems. In International Con-
ference on Enterprise Information Systems (ICEIS),
volume 2, pages 88–98, Porto, Portugal. SciTePress.
Geng, L., Semerci, M., Yener, B., and Zaki, M. J. (2012).
Effective graph classification based on topological and
label attributes. Statistical Analysis & Data Mining
the Asa Data Science Journal, 5(4):265–283.
Liu, J., Shang, J., Wang, C., Ren, X., and Han, J. (2015).
Mining quality phrases from massive text corpora.
In 2015 ACM SIGMOD International Conference on
Management of Data, pages 1729–1744. ACM.
L
¨
u, L. and Zhou, T. (2011). Link prediction in complex
networks: A survey. Physica A: statistical mechanics
and its applications, 390(6):1150–1170.
Mart
´
ınez, V., Berzal, F., and Cubero, J.-C. (2017). A survey
of link prediction in complex networks. ACM Com-
puting Surveys (CSUR), 49(4):69.
Menon, A. K. and Elkan, C. (2011). Link prediction
via matrix factorization. In Joint european confer-
ence on machine learning and knowledge discovery
in databases, pages 437–452. Springer.
Pan, J. Z., Vetere, G., Gomez-Perez, J. M., and Wu,
H. (2017). Exploiting Linked Data and Knowledge
Graphs in Large Organisations. Springer Publishing
Company, Incorporated, 1st edition.
Ramaswami, P. (2007). A remedy for your health-related
questions: health info in the knowledge graph.
Rogers, D. and Hahn, M. (2010). Extended-connectivity
fingerprints. Journal of Chemical Information & Mod-
eling, 50(5):742–754.
Shang, J., Liu, J., Meng, J., Xiang, R., Voss, C. R., and Han,
J. (2017). Automated phrase mining from massive text
corpora. IEEE Transactions on Knowledge & Data
Engineering, PP(99):1–1.
Shervashidze, N., Vishwanathan, S. V. N., Petri, T.,
Mehlhorn, K., and Borgwardt, K. M. (2009). Ef-
ficient graphlet kernels for large graph comparison.
In 12th International Conference on Artificial Intel-
ligence and Statistics, pages 488–495.
Suchanek, F. M., Kasneci, G., and Weikum, G. (2007).
Yago: a core of semantic knowledge. pages 697–706.
Taskar, B., Wong, M.-F., Abbeel, P., and Koller, D. (2004).
Link prediction in relational data. In Advances in neu-
ral information processing systems, pages 659–666.
Wang, J., Zhang, Z., and Zha, H. (2005). Adaptive manifold
learning. In Advances in neural information process-
ing systems, pages 1473–1480.
Wu, X., Zhao, L., and Akoglu, L. (2018). A quest for struc-
ture: Jointly learning the graph structure and semi-
supervised classification. In 27th ACM International
Conference on Information and Knowledge Manage-
ment, CIKM ’18, pages 87–96. ACM.
Zhang, X. and Lee, W. S. (2007). Hyperparameter learn-
ing for graph based semi-supervised learning algo-
rithms. In Advances in neural information processing
systems, pages 1585–1592.
Zhu, X., Ghahramani, Z., and Lafferty, J. D. (2003). Semi-
supervised learning using gaussian fields and har-
monic functions. In 20th International conference on
Machine learning (ICML-03), pages 912–919.
KMIS 2020 - 12th International Conference on Knowledge Management and Information Systems
160
