
Saudi Stock Market Sentiment Analysis using Twitter Data
Amal Alazba
1,2
, Nora Alturayeif
1,3
, Nouf Alturaief
1,3
and Zainab Alhathloul
1
1
Department of Information and Computer Science, KFUPM, Dhahran, Saudi Arabia
2
Department of Information Systems, King Saud University, Riyadh, Saudi Arabia
3
Department of Computer Science, Imam Abdulrahman Bin Faisal University, Dammam, Saudi Arabia
Keywords:
Machine Learning, Sentiment Analysis, Supervised Learning, NLP.
Abstract:
Sentiment analysis in the finance domain is widely applied by investors and researchers, but most of the work
is conducted for English text. In this work, we present a framework to analyze and visualize the sentiments of
Arabic tweets related to the Saudi stock market using machine learning methods. For the purpose of training
and prediction, Twitter API was used for collecting off-line data, and Apache Kafka was used for real-time
streaming tweets. Experiments were conducted using five machine learning classifiers with different feature
extraction methods, including word embedding (word2vec) and the traditional BoW methods. The highest
accuracy for the sentiment classification of Arabic tweets was 79.08%. This result was achieved with the
SVM classifier combined with the TF-IDF feature extraction method. At the end, the predicted sentiments of
the tweets using the outperforming classifier were visualized by several techniques. We developed a website
to visualize the off-line and streaming tweets in various ways: by sentiments, by stock sectors, and by frequent
terms.
1 INTRODUCTION
Generally, stock market behavior has a random pat-
tern that cannot be predicted very accurately. How-
ever, with the advent of machine learning, the user-
generated content can be analyzed and used to predict
stock returns (Ranco et al., 2015; Karabulut, 2013).
Recent research has shown a significant relationship
between the stock returns and the user-generated con-
tent (Ranco et al., 2015; Pagolu et al., 2016; Oliveira
et al., 2017). Different data sources were used to col-
lect the users’ content, such as Twitter (Ranco et al.,
2015), Facebook (Karabulut, 2013) and LiveJournal
(Gilbert and Karahalios, 2010). Also, different analy-
sis techniques have been applied on users’ data, such
as mood analysis (Nofer and Hinz, 2015) and senti-
ment analysis (Ranco et al., 2015; Pagolu et al., 2016;
Oliveira et al., 2017). However, a significant corre-
lation between the stock returns and user-generated
content were mostly found in twitter data by utilizing
sentiment analysis (Ranco et al., 2015).
Although there are many studies that have investi-
gated the use of Twitter as a major source for public-
opinion analysis, none of them analyzed the sentiment
of Arabic stock market tweets. In this work, we con-
tribute to the field of sentiment analysis of Twitter
Arabic data. Sentiment analysis is concerned with
classifying an opinion of text into positive, negative
or neutral. We used the sentiment analysis to classify
tweets about Saudi stock market into positive or neg-
ative. The stock market is changing frequently, there-
fore, it is very important to analyze real-time tweets.
We used Apache Kafka for real-time sentiment analy-
sis of Saudi stock market tweets. Then, the predicted
sentiment of the collected and the real-time tweets
were visualized into a website.
The proposed work can be used by individuals
who are interested to invest in the Saudi stock mar-
ket. The website provides insights about to what ex-
tent people are satisfied with the Saudi stock market
in different sectors. To reproduce our results and for
future work, the code and data used in the experiments
can be accessed through GitHub
1
.
The rest of the paper is organized as follows. In
section 2, we briefly review the related research about
user-generated content and the stock market. The
methodology is discussed in details in section 3, start-
ing by the data collection, followed by the data anal-
ysis, data streaming and data visualization. In sec-
tion 4, we show the evaluation results of the sentiment
analysis. Section 5 presents the website that was de-
veloped to visualize the results of this work. Finally,
in section 6 we will wrap up with a conclusion and a
discussion on future work that can be extended from
this paper.
1
https://github.com/Noufst/Saudi-Stock-Market-
Sentiment-Analysis
36
Alazba, A., Alturayeif, N., Alturaief, N. and Alhathloul, Z.
Saudi Stock Market Sentiment Analysis using Twitter Data.
DOI: 10.5220/0010026100360047
In Proceedings of the 12th International Joint Conference on Knowledge Discovery, Knowledge Engineering and Knowledge Management (IC3K 2020) - Volume 1: KDIR, pages 36-47
ISBN: 978-989-758-474-9
Copyright
c
2020 by SCITEPRESS – Science and Technology Publications, Lda. All rights reserved

2 RELATED WORK
In this section, we briefly review the research which
investigates the correlation between the Twitter data
and financial markets. Most of the research used sen-
timent analysis (Ranco et al., 2015; Pagolu et al.,
2016; Oliveira et al., 2017), whereas analyzing the
user’s mood has not been largely explored (Nofer and
Hinz, 2015). This might be because sentiment anal-
ysis has shown to be significantly affecting the stock
market while the users’ mood has shown no signifi-
cant correlation with the stock market. Also, the ma-
jority of the research was conducted on English tweets
(Ranco et al., 2015; Pagolu et al., 2016; Oliveira et al.,
2017). One study has used Germany tweets (Nofer
and Hinz, 2015); however, the tweets were translated
into English before the analysis.
Ranco et al. investigated the relations between
30 stocks of the DJIA index and Twitter data (Ranco
et al., 2015). They collected over 1.5 million En-
glish tweets using the Twitter Streaming API. Three
financial experts have labelled 100,000 tweets using
three sentiment labels: negative, neutral or positive.
They used SVM model to classify 1.5 million tweets
to compare the data of the stock price returns with
tweets polarity. The results have shown a significant
relationship between the abnormal stock returns with
sentiments of tweets.
A more focused analysis of one company was ex-
plored by Pagolu et al. (Pagolu et al., 2016). The
aim of this study was to find if there is a correla-
tion between the public opinions of the company with
stock prices of that company. 2.5 million tweets about
Microsoft were collected using Twitter API, however,
only 3,216 tweets were annotated by a human. A ma-
chine learning model was built using the Random For-
est algorithm with an accuracy of 70.2%. They com-
pared the sentiments of the tweets with stock price
data of Microsoft, and a strong correlation between
them were found.
Oliveira et al. have analyzed the tweets to fore-
cast the stock market behavior (Oliveira et al., 2017).
They collected roughly 31 million tweets using Twit-
ter REST API. The collected tweets contain hashtags
of all stocks traded in US markets. A lexicon-based
model was used to extract the sentiment of the tweets.
Many machine learning algorithms such as Neural
Network, SVM and Random Forest were used to pre-
dict the stock market. The results have shown that the
stock market behavior can be predicted using senti-
ment analysis of twitter data.
Some studies have investigated the effect of users’
mood in the stock market. Nofer and Hinz conducted
an empirical study to explore the correlation between
the people’s mood and the stock market (Nofer and
Hinz, 2015). They collected around 100 million Ger-
man tweets using Twitter API and included only pos-
itive and negative tweets using a dictionary of key-
words. They translated German tweets into English
in order to use the ASTS tool. The DAX intraday
returns of 30 major German companies were used in
the analysis. The result has shown no significant rela-
tionship between the stock market and Twitter users’
mood.
In this study, we aim to analyze Arabic tweets re-
lated to the Saudi stock market. The sentiments can be
further analysed to examine the correlation between
tweets and the Saudi stock index.
3 METHODOLOGY
This section describes the framework that we present
to analyze the sentiment of Arabic tweets for the
Saudi Stock market. In general, there are three ap-
proaches that one can handle this problem: super-
vised learning, lexicons or using a hybrid of both. In
the current work, we adopt supervised learning to ex-
tract the sentiment of tweets. Figure 1 illustrates the
framework of the sentiment analysis process, starting
from collecting the data until the visualisation of the
results.
3.1 Data Collection
As one of the most popular social media platforms in
Saudi Arabia, Twitter has been selected for this study
as the data source for the sentiment analysis. In or-
der to collect the tweets related to the Saudi stock
market, the Twitter search API
2
was queried with a
specific keywords such as "A` rJ¥m", "¤d",
"¨FA", etc. However, Twitter’s standard search API
only searches against a sampling of recent tweets pub-
lished in the past 7 days. Thus, to collect tweets in one
year period, the IDs of users who publish tweets re-
lated to Saudi stock market were extracted. Then, we
extracted the timelines of these users and filter them
based on the keywords and date. The irrelevant tweets
(e.g. advertisement tweets) were eliminated.
A total of 5209 Arabic language tweets over the
period of January 1st, 2019 to December 13th, 2019
related to the Saudi stock market were extracted from
twitter API (after excluding redundant and irrelevant
tweets, e.g. advertisement tweets). Each tweet record
contains: (1) tweet identifier, (2) date/time of cre-
ation, and (3) text. The tweets used in this study are
based on data obtained from public timelines.
2
https://dev.twitter.com/
Saudi Stock Market Sentiment Analysis using Twitter Data
37
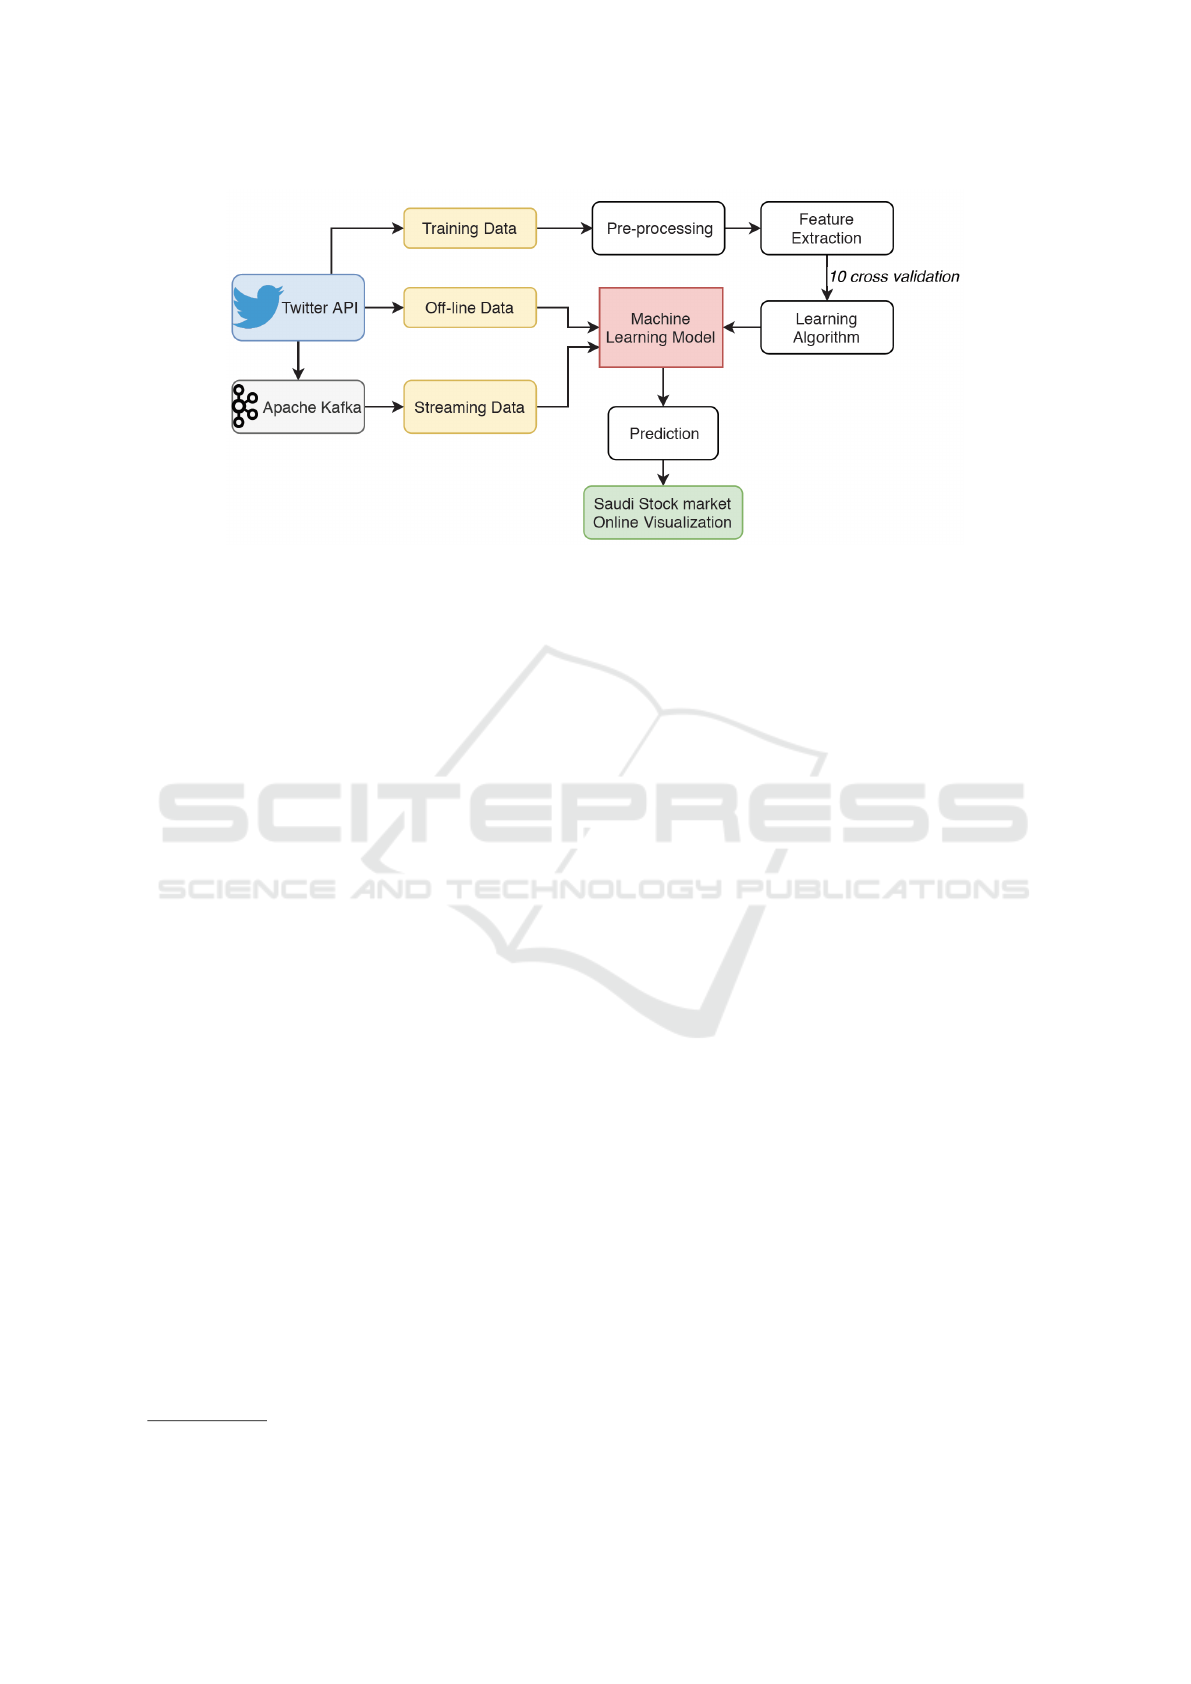
Figure 1: Framework of the proposed twitter sentiment analysis system.
3.2 Data Pre-processing
The pre-processing of the tweets’ text involves a set of
operations that are already shown to be efficient with
a high accuracy result (Duwairi and El-Orfali, 2014).
Four stages were employed:
1. Cleaning: Tweets contain many emoticons and
unnecessary data, thus, cleaning step is applied to
better define the feature space. RegEx matching
and preprocessor
3
packages in Python were uti-
lized to remove URLs, hashtags, emoticons, user
mentions and extra whitespace.
2. Normalization: In order to transform the tweets to
a more unified sequence, the following steps were
applied:
• Prolonged word showing intense emotions like
"EAtm" is replaced with "EAtm".
• Punctuation and diacritics (short vowels) such
as "Å Ä ¿" are removed.
• Tatweel "þþ" is removed. For example, us-
ing Tatweel in the word "ws"” may look
like"wþþþs".
• The letters that appear in different forms are
Unified. For example, unify ", , , " to be
"".
3. Stop Words Removal: Stop Words are a group of
words that do not express any emotion, such as
preposition. Thus, stop words are removed, for
the model to focus on the expressive words, and
to enhance the quality of the classifier.
4. Tokenization: The process of tokenization splits
sentences (tweets) into words, which makes the
3
https://pypi.org/project/tweet-preprocessor/
texts easier for additional processing; e.g. pro-
ducing the “words vectors”.
3.3 Sentiment Analysis Model
The design of the sentiment analysis model involves
two sub-tasks: feature extraction and model train-
ing. For this study, three types of word representa-
tion techniques were used for the learning features,
and five different machine learning classifiers were
selected as the prediction model.
3.3.1 Feature Representation
Machine learning methods require lots of feature en-
gineering work for proper textual representations.
Most Arabic sentiment analysis applications still rely
on costly hand-crafted features and lexicon-based fea-
tures to achieve the preferred accuracy (Abu Farha
and Magdy, 2019). Many of the state-of-art NLP
architectures adopted word embedding techniques,
which have many advantages compared to Bag-of-
Words (BoW) representation. For example, words
that share similar contexts in the text are placed within
close proximity to one another in the vector space.
In addition, word embeddings have lower dimensions
than the BoW (Mikolov et al., 2013a).
In this work, we utilized neural word embeddings
created by Altowayan and Tao (Altowayan and Tao,
2016) as an alternative for such hand-engineered fea-
tures. They utilized the well-known and widely used
word2vec model (Mikolov et al., 2013b) with Contin-
uous Bag of Words (CBOW) model architecture to em-
bed Arabic words in a continuous vector space. Their
embeddings were built using a corpus contains around
190 million words from 3 sources: Quran, Arabic
KDIR 2020 - 12th International Conference on Knowledge Discovery and Information Retrieval
38
news, and consumer reviews to enrich the corpus with
different dialectal vocabulary.
Despite that BoW introduced limitations such as
sparse representation and large feature dimension
(Mikolov et al., 2013a), we used BoW for build-
ing a baseline model. Two approaches of BoW
were implemented: counting word occurrence and
Term Frequency-Inverse Document Frequency (TF-
IDF). Both methods were applied using the fea-
ture_extraction.text module available in the open
source Python library: scikit-learn.
3.3.2 Models Training
In this work, we used a supervised machine learning
approach to train a sentiment classifier. For the pur-
pose of training, 427 tweets were labeled manually
by two experts in Tadawul All Share Index (TASI).
The tweets were labeled with two sentiments: posi-
tive (211 tweets) and negative (216 tweets). Positive
tweets were given the label "1", and negative tweets
were given the label "0". The meaning and examples
of each label are illustrated in Table 1. Nevertheless,
it should be noted that the ground-truth data labels
should be considered informed but not 100% accu-
rate, as human decisions can involve errors.
Five different learning algorithms were employed
for the development of the tweets sentiment clas-
sifier: (1) Random Forest, (2) Stochastic Gradient
Descent (SGD), (3) Linear SVM, (4) Logistic Re-
gression and (5) Decision Tree. All learning algo-
rithms were implemented using scikit-learn libraries.
The algorithms were trained to classify new obser-
vations based on the set of labeled data (tweets),
each described by 3 different feature representations
(word2vec, count occurrence and TF-IDF), which are
demonstrated in Section 3.3.1. Lastly, in order to
evaluate the classifiers’ performance in more general
cases, 10-fold cross validation was used from scikit-
learn’s model_selection module.
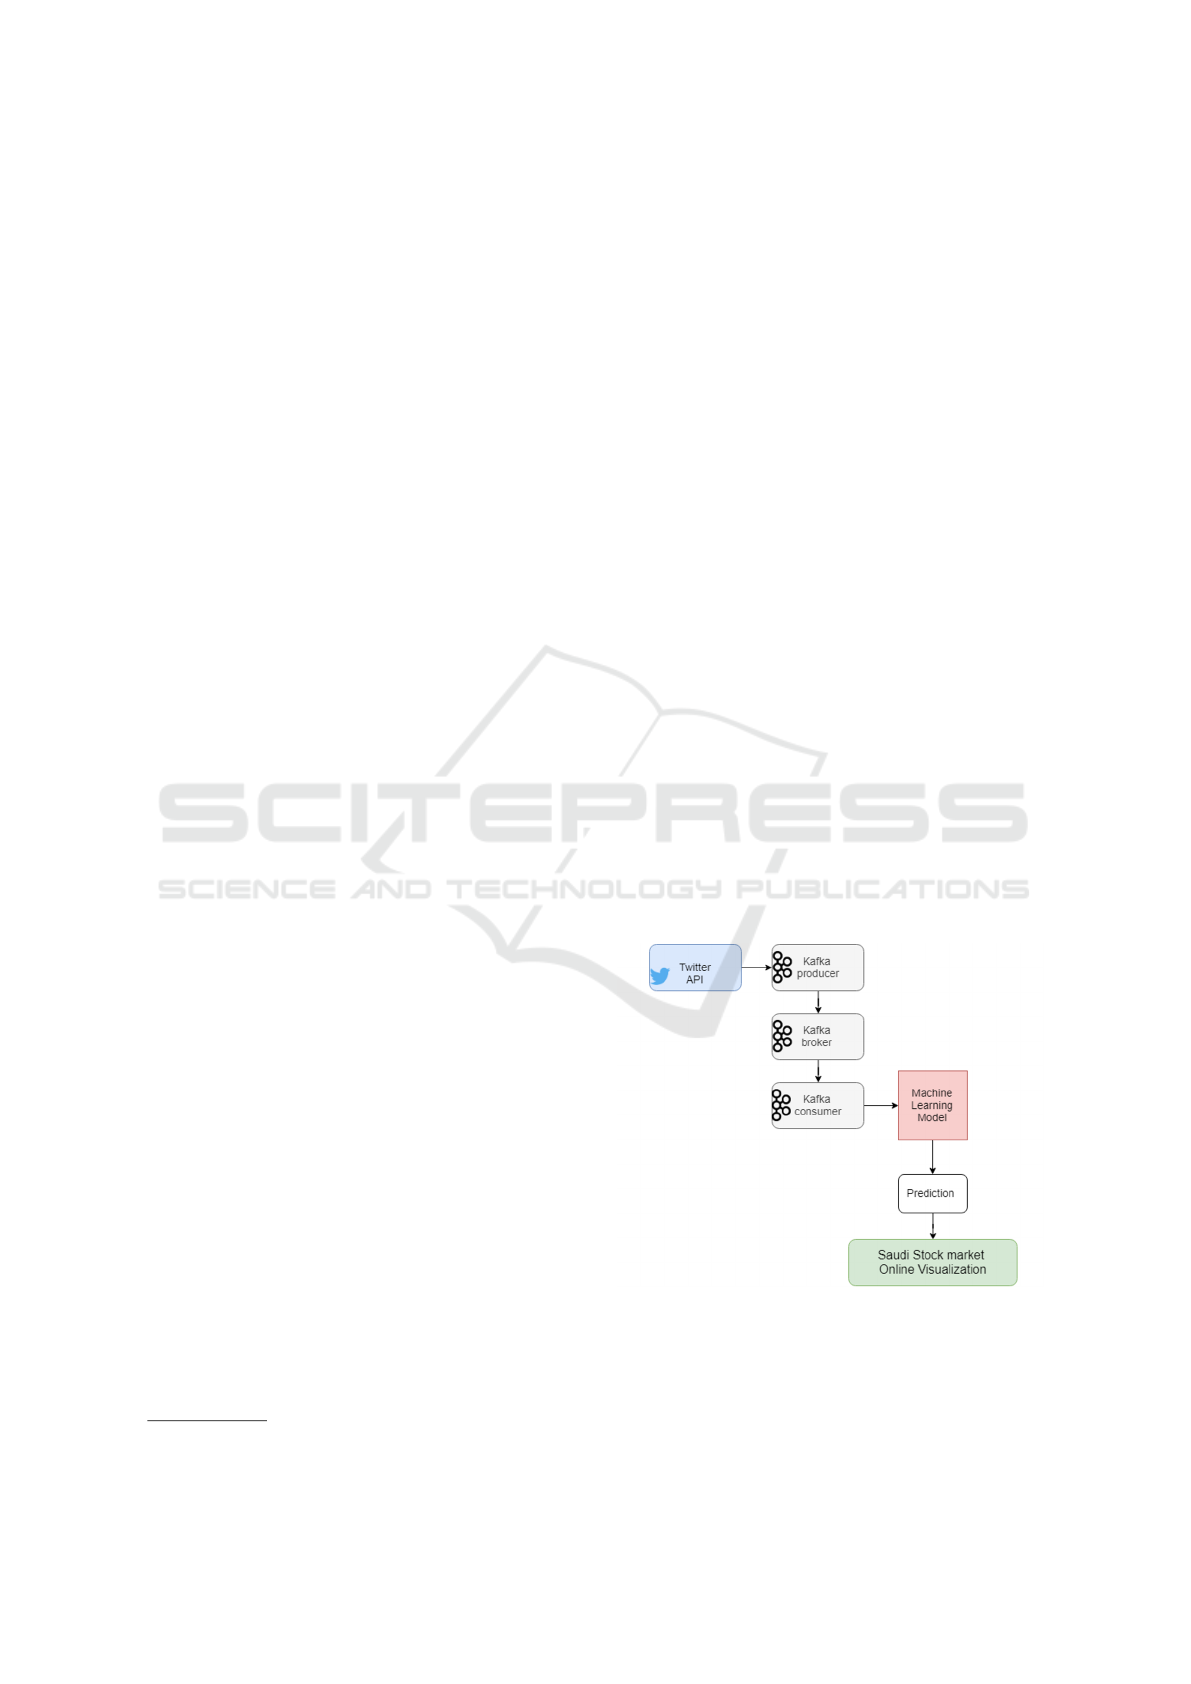
3.4 Data Streaming
In the stock market, it is crucial to have a real-
time sentiment analysis of users’ opinion. Therefore,
Apache Kafka
4
was utilized to predict the sentiment
of the tweets in real-time. Apache Kafka is a dis-
tributed service that uses topic-subscribe messaging
which can be used as a real-time streaming platform.
In this paper, we created a topic named stock_market
to collect streaming tweets on Saudi stock market.
The architecture of Kafka that is integrated with the
4
https://kafka.apache.org
trained model is presented in Figure 2. The architec-
ture consists of six components:
• Kafka Producer: This component is one of the
main modules in Kafka. It publishes the stream-
ing tweets to the stock_market topic that was cre-
ated previously.
• Kafka Broker: Kafka consists of a cluster of
servers; each server is called a broker. The server
stores a key, value (the tweet text and time cre-
ated), and a timestamp of each tweet and saves the
tweets in the stock_market topic in the server. The
data that is stored in the broker are immutable, any
new tweet will be appended to the log.
• Kafka Consumer: The consumer can subscribe to
one or more topics. In this research, the consumer
subscribes to the stock_market topic. Now, the
consumer can consume the data in the server to
be analyzed and visualized in the next two steps.
• Machine learning model: The previously trained
model described is Section 3.3, will be loaded in
order to be used to classify real-time streaming
tweets.
• Sentiment analysis/prediction: Each tweet stored
in the stock_market topic and consumed by the
consumer will be fed to the classifier. The clas-
sifier will return the sentiment of a tweet; whether
it is a positive or a negative tweet.
• Visualization: Finally, the results will be visual-
ized by a website. The visualization outcome is
described in Section 3.5.
Figure 2: Kafka architecture.
Saudi Stock Market Sentiment Analysis using Twitter Data
39

Table 1: Labels of tweets used in annotation and an example of each label.
Label Example Tweet English Translation
Positive: if there is a clear
indicator of bull market
even if it is not strong
Aq wbF± ws ¨ ¨§C
..ºAW`A A¤ rS ¢
¾®yl Xbh§ d d± w§ T§d
r «r Xq §wtl
.l ¢l¤ T§ Ayq ArKl
My opinion of the market next week is
that it’s green and full of tender..
By the start of Sunday, it may go
down a little, for intimidation only.
Then, we will notice a move for the
leading companies, and God knows best.
Negative: if there is a clear
indicator of bear market
even if it is not strong
CA ¨Am¤ ¨nf ylt
wt¯ F± wF ,rWys
ws ,¾Ay¶Ah zf rb ¢y
¤znA bK
Technical and financial analysis are out
of control. Do not expect a motivational
news for the stock market, it’s oversold.
3.5 Data Visualization
For the data to be meaningful and useful for public
users, a website is developed to visualize the senti-
ments of Saudi stock market data. In the website, the
sentiment of the previously collected tweets, as well
as the real-time tweets, are visualized. The tools that
have been used in both the server and client sides are
described next.
• Server-Side Tools:
– Flask: Flask
5
is a framework written in python
that facilitates the design and development of
web applications. The main advantage of using
this framework is its extensibility.
– Python: in particular, python is used in the
server side for real-time twitter data streaming.
It runs the Kafka consumer that is written in
python. It sends the results in a JSON format to
the client to be read using JavaScript.
• Client-Side Tools:
– Interfaces: HTML (Hypertext Mark-up Lan-
guage) and CSS (Cascading Style Sheets) are
used to build the website. HTML and CSS are
the base of web scripting languages for devel-
oping web applications. HTML and CSS aren’t
the same; they are like the bones and skin for
any website. HTML is responsible for con-
structing and structuring the actual content of
the website, including the written text or fig-
ures, whereas, CSS is used to design or deco-
rate the website, such as the colors, the layout
and the visual effects.
– Data Processing: JavaScript
6
and jQuery
7
are
used to load, modify, transform, and control
5
https://palletsprojects.com/p/flask
6
https://www.javascript.com
7
https://jquery.com
the data. JavaScript is a dynamic scripting lan-
guage that makes websites more interactive. It
enables changing the content, layouts or posi-
tion of the website dynamically. jQuery is an
open-source library written in JavaScript. It
contains a set of functions that facilitate the use
of a JavaScript.
– Charts Visualization: to visualize the data in an
attractive and readable way, two JavaScript li-
braries were used: Chart.js
8
and D3.js
9
. Both
a powerful data visualization using different
types of charts such as (bar chart, pie chart, line
chart, etc.). Chart.js provides simple graphs
representation while D3.js can be used for com-
plex data visualizations that need a high level of
interactivity.
4 MODEL PERFORMANCE AND
EVALUATION
To examine the effectiveness of the proposed model
and for the purpose of methods comparison, the per-
formance is reported using F1-score and MAcc (mean
accuracy of the 10-folds cross validation). The de-
tailed performance of all the five classifiers on each
of the three feature representations are reported in Ta-
ble 2.
Several important conclusions can be drawn from
the results presented in Table 2. First, word em-
bedding perform poorly on all classifiers compar-
ing to the other two feature representations. This
shows that traditional BoW approach may work better
than Word Embedding in small datasets. In addition,
since our context is very domain specific, we couldn’t
find some corresponding vectors from the pre-trained
8
https://https://www.chartjs.org
9
https://d3js.org
KDIR 2020 - 12th International Conference on Knowledge Discovery and Information Retrieval
40
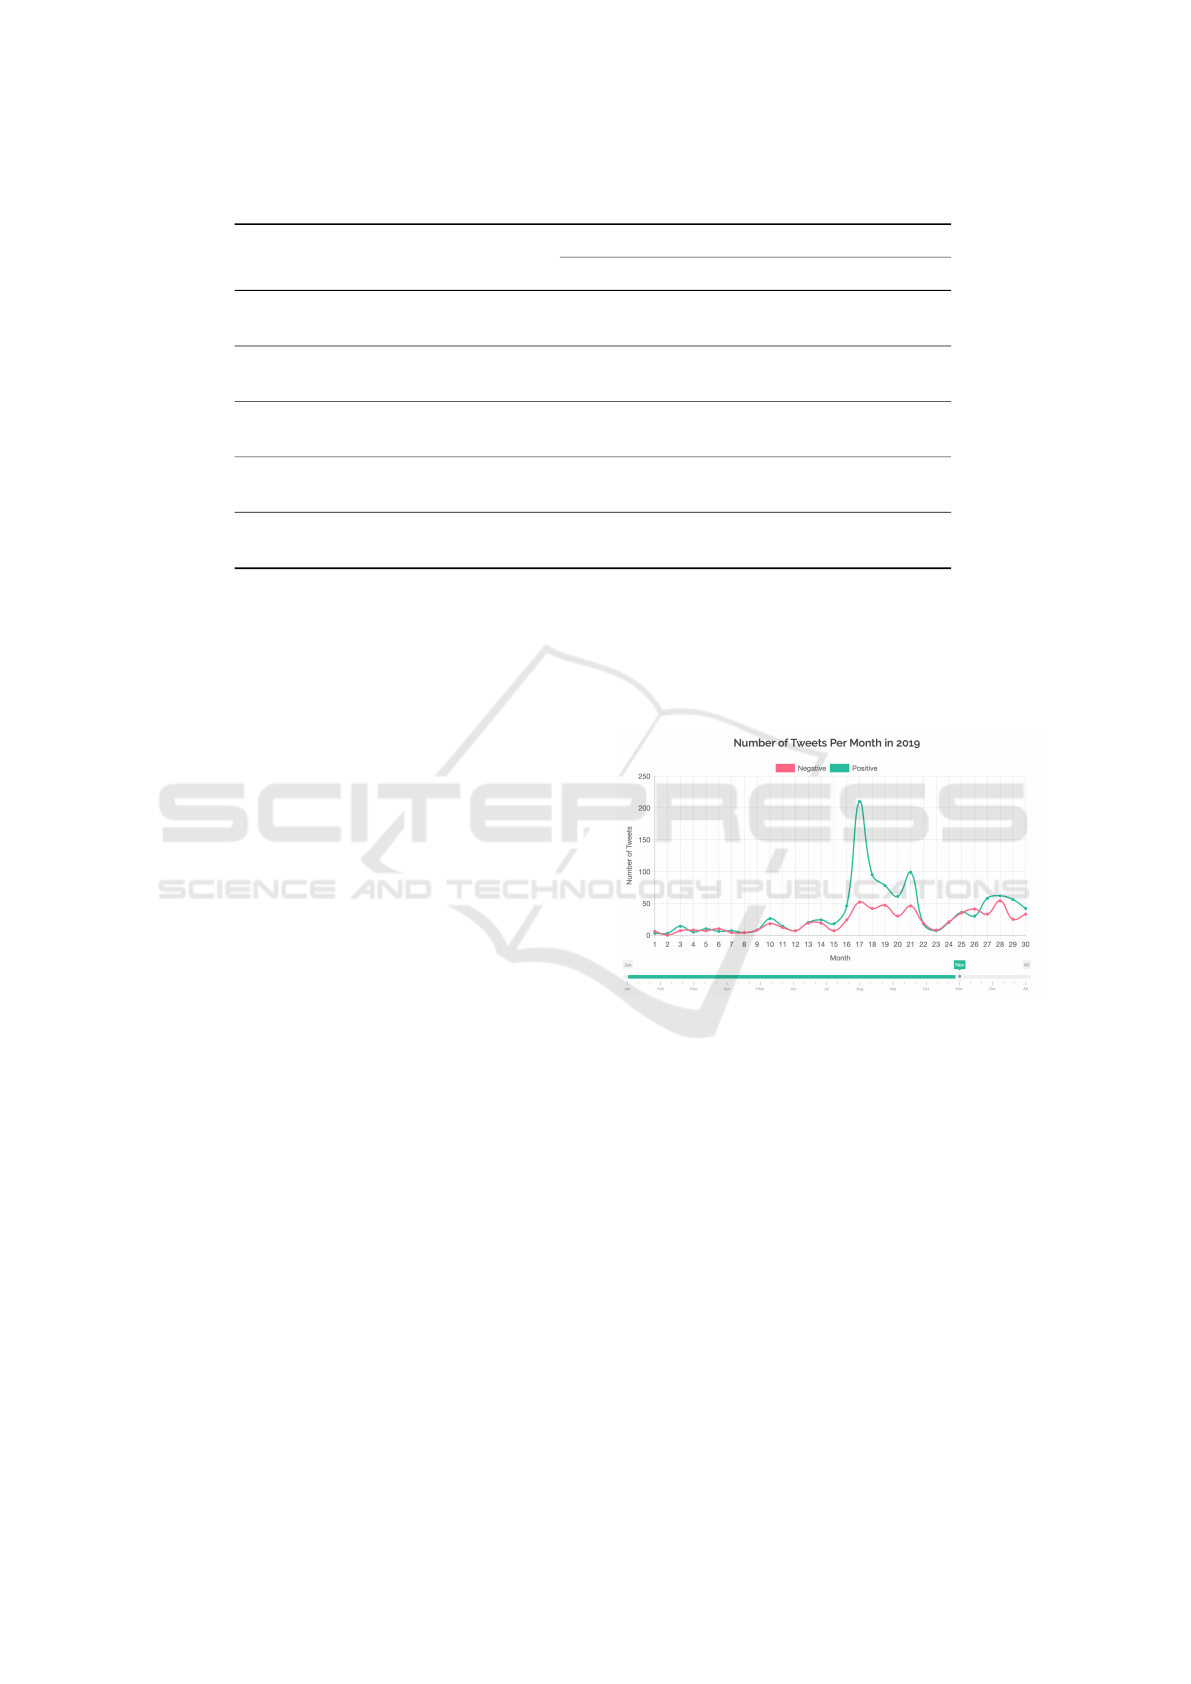
Table 2: F1-score and accuracy percentage for each classifier and feature representation.
Classifier Metric
Feature Representation
Count Occurance
TF-IDF
Word Embedding
Random Forest
Mean accuracy 75.38 77.06 62.06
F1-score 75.75 74.63 62.00
SGD
Mean accuracy 72.36 75.42 65.29
F1-score 72.32 74.44 63.88
Linear SVM
Mean accuracy 75.94 82.15 69.85
F1-score 75.98 79.08 68.42
Logistic Regression
Mean accuracy 73.97 78.07 64.49
F1-score 75.00 74.34 63.11
Decision Tree
Mean accuracy 71.83 75.23 54.48
F1-score 74.07 71.92 53.29
word embedding model created by Altowayan and
Tao (Altowayan and Tao, 2016). They have gener-
ated the embedding using a corpus from Quran, Ara-
bic news and consumer reviews with different Arabic
dialect vocabulary that does not include all Saudi di-
alect vocabulary. This suggests that such a simple use
of the word embedding may not give us an advantage
to Arabic sentiment analysis. This should encour-
age research in the application of word embedding for
Arabic to adapt more future-promising techniques.
As can be seen from Table 2, TF-IDF representa-
tion performed best among the three different repre-
sentations. Furthermore, SVM outperformed all other
learning algorithms with each feature representation.
SVM has F1-score of 79.08 and mean accuracy rate
of 82.15 using the TF-IDF representation.
5 SAUDI STOCK MARKET
ONLINE VISUALIZATION
The goal of this paper is a visualization that presents
the sentiment of the Saudi stock market trends. Using
the best classifier obtained with the process explained
in Section 3, we classified the off-line tweets and the
streaming tweets into one of two categories (positive
or negative). The sentiment of the resulted tweets are
visualized using several different visualization tech-
niques. Each technique is designed to highlight dif-
ferent aspect.
Figure 3 shows the total number of positive and
negative tweets about the Saudi stock market per day.
The user can select a specific month and see the peo-
ple opinion about the Saudi stock market or about
Aramco shares specifically. Also, the user can se-
lect to view the total number of positive and nega-
tive tweets over the year by selecting "all" using the
slider. In Figure 3, the peak of the tweets was on 17
Nov 2019 (the day where Aramco opened the sub-
scription of the shares). The graph shows that most
of the tweets on 17 Nov are positive, which gives an
indicator that people are optimistic and interested in
trading in Aramco.
Figure 3: The total number of positive and negative tweets
in November 2019.
In Figure 4, the total number of positive and neg-
ative tweets for each sector is shown. This graph
can be very useful when an individual is interested
in investing in one of the following sectors: (Cement,
Banks, Real-Estate, Agriculture, Retail, Telecommu-
nications, and Insurance). The results show that peo-
ple in Saudi Arabia are mostly talking about Cement,
Banks, Real-Estate and Telecommunications sectors.
However, not all of the tweets are positively talking
about these sectors. As we can see in Figure 4, most
of the tweets are positive in Cement, Banks and Real-
Estate sectors, while the number of positive and neg-
ative tweets about the Telecommunications sector is
almost equal. The tweets about the insurance sector
stocks are mostly negative.
Moreover, we noticed a lot of tweets about the
Saudi Stock Market Sentiment Analysis using Twitter Data
41
Figure 4: The total number of positive and negative tweets
per sector.
Saudi stock market in general. Therefore, we visu-
alized the data into another graphs that show the to-
tal number of positive and negative tweets about the
Tadawul All Share Index (TASI), which is the ma-
jor stock market index on the Saudi Stock Exchange.
We compared the results of TASI with Aramco shares
and all the other sectors. Figure 5 shows the num-
ber of positive (the green bars) and negative (the red
bars) tweets for Aramco, TASI and other sectors. The
figure revealed that about 64% and 62% of TASI and
others sectors tweets are negative, respectively. How-
ever, about 88% of Aramco shares tweets are positive.
Figure 5: A comparison between Aramco, TASI and other
sectors in term of total number of positive and negative
tweets.
Figure 6 provides a visual representation of the
most frequently used terms in the positive and neg-
ative tweets, which were extracted using the text min-
ing steps listed in Section 3.2 with the predictions
from the proposed model. In order to show the Ara-
bic terms in proper a form, the word cloud was gen-
erated by installing the following packages in Python:
arabic_reshaper, bidi.algorithm and wordcloud. The
significance of a word (i.e. based on its frequency) is
associated with the font size of the word.
Figure 6: Word Cloud of the positive and negative tweets.
All the previous graphs show the result of
analysing the off-line data. Nevertheless, the same
graphs were implemented to visualize the streaming
data in real-time. Complete screenshots of the web-
site can be accessed in the Appendix.
6 CONCLUSIONS AND FUTURE
WORK
This paper addressed a sentiment analysis for tweets
expressed in Arabic language about the Saudi stock
market. We have collected 5209 tweets about the
Saudi stock market. We analyzed the sentiment of the
tweets using 427 labeled tweets, five machine learn-
ing classifiers, and three different feature extraction
methods. The SVM classifier with the TF-IDF train-
ing model achieved the highest accuracy (79.08%),
therefore it was chosen to be loaded in the website
to predict the sentiments of the off-line and real-
time streaming tweets. We utilized Apache Kafka to
stream real-time tweets. Then, we visualized the re-
sults using different types of charts in a website de-
veloped using Flask framework, Chart.js and D3 li-
braries. The preliminary evaluation results revealed
that TF-IDF feature representations performed better
than word embeddings and word occurrence. We be-
lieve that this work should encourage research in the
application of word embedding for Arabic to adapt
more future-promising techniques. Moreover, as ex-
emplified in the previous work, sentiment analysis in
Arabic language is a challenging task when compared
to other languages.
In this paper, we have trained only 427 tweets
for analyzing people’s sentiment about Saudi stock
market. In future, we aim to target larger training
KDIR 2020 - 12th International Conference on Knowledge Discovery and Information Retrieval
42

dataset, and to build a domain-specific lexicon with
enough data to evaluate the best method that can be
used to classify the tweets. In addition, another data
sources can be used beside Twitter, such as Stocktwits
10
which is a communication platform for people who
are interested in trading and stock market. The results
can be further analyzed with the Saudi stock market
index to find if a significant correlation exists between
them. Moreover, the proposed analysis can be utilized
by companies who are interested in finding a rela-
tionship between their short-term market performance
and people opinions. In addition, investors can utilize
our website to support the decision of which sector to
invest in.
REFERENCES
Abu Farha, I. and Magdy, W. (2019). Mazajak: An on-
line Arabic sentiment analyser. In Proceedings of the
Fourth Arabic Natural Language Processing Work-
shop, pages 192–198. Association for Computational
Linguistics.
Altowayan, A. A. and Tao, L. (2016). Word embeddings
for arabic sentiment analysis. In 2016 IEEE Inter-
national Conference on Big Data (Big Data), pages
3820–3825.
Duwairi, R. and El-Orfali, M. (2014). A study of the ef-
fects of preprocessing strategies on sentiment analy-
sis for Arabic text. Journal of Information Science,
40(4):501–513.
Gilbert, E. and Karahalios, K. (2010). Widespread worry
and the stock market. In Fourth International AAAI
Conference on Weblogs and Social Media.
Karabulut, Y. (2013). Can facebook predict stock market
activity? In AFA 2013 San Diego Meetings Paper.
Mikolov, T., Chen, K., Corrado, G., and Dean, J. (2013a).
Efficient estimation of word representations in vector
space. In 1st International Conference on Learning
Representations, ICLR 2013 - Workshop Track Pro-
ceedings.
Mikolov, T., Sutskever, I., Chen, K., Corrado, G., and Dean,
J. (2013b). Distributed representations ofwords and
phrases and their compositionality. In Advances in
Neural Information Processing Systems.
Nofer, M. and Hinz, O. (2015). Using twitter to predict the
stock market. Business & Information Systems Engi-
neering, 57(4):229–242.
Oliveira, N., Cortez, P., and Areal, N. (2017). The impact of
microblogging data for stock market prediction: Us-
ing twitter to predict returns, volatility, trading volume
and survey sentiment indices. Expert Systems with Ap-
plications, 73:125–144.
Pagolu, V. S., Reddy, K. N., Panda, G., and Majhi, B.
(2016). Sentiment analysis of twitter data for pre-
dicting stock market movements. In 2016 interna-
10
https://stocktwits.com
tional conference on signal processing, communica-
tion, power and embedded system (SCOPES), pages
1345–1350. IEEE.
Ranco, G., Aleksovski, D., Caldarelli, G., Gr
ˇ
car, M., and
Mozeti
ˇ
c, I. (2015). The effects of twitter sentiment on
stock price returns. PloS one, 10(9):e0138441.
APPENDIX
Screenshots of the interfaces of the Saudi Stock Mar-
ket Sentiment Analysis Website are presented next.
Saudi Stock Market Sentiment Analysis using Twitter Data
43
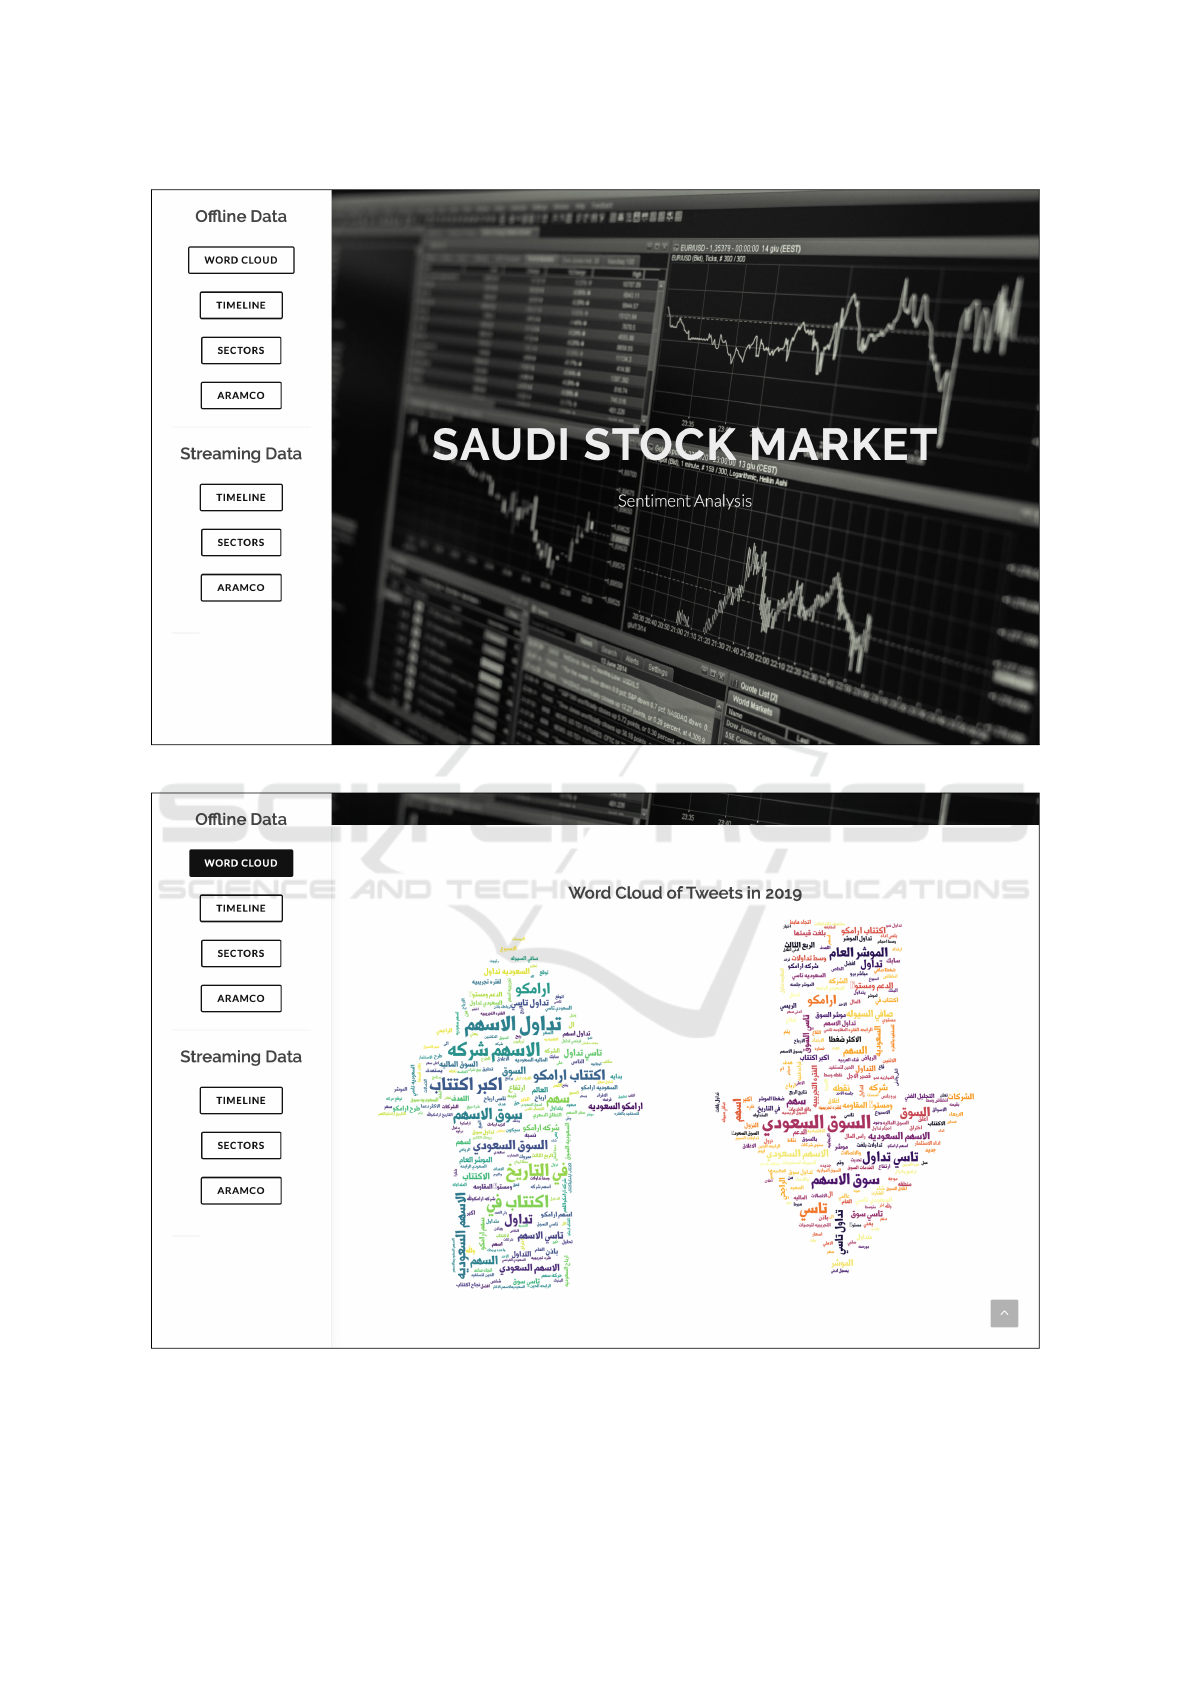
Figure 7: The home page of the website.
Figure 8: A webpage showing World Cloud of the off-line tweets.
KDIR 2020 - 12th International Conference on Knowledge Discovery and Information Retrieval
44
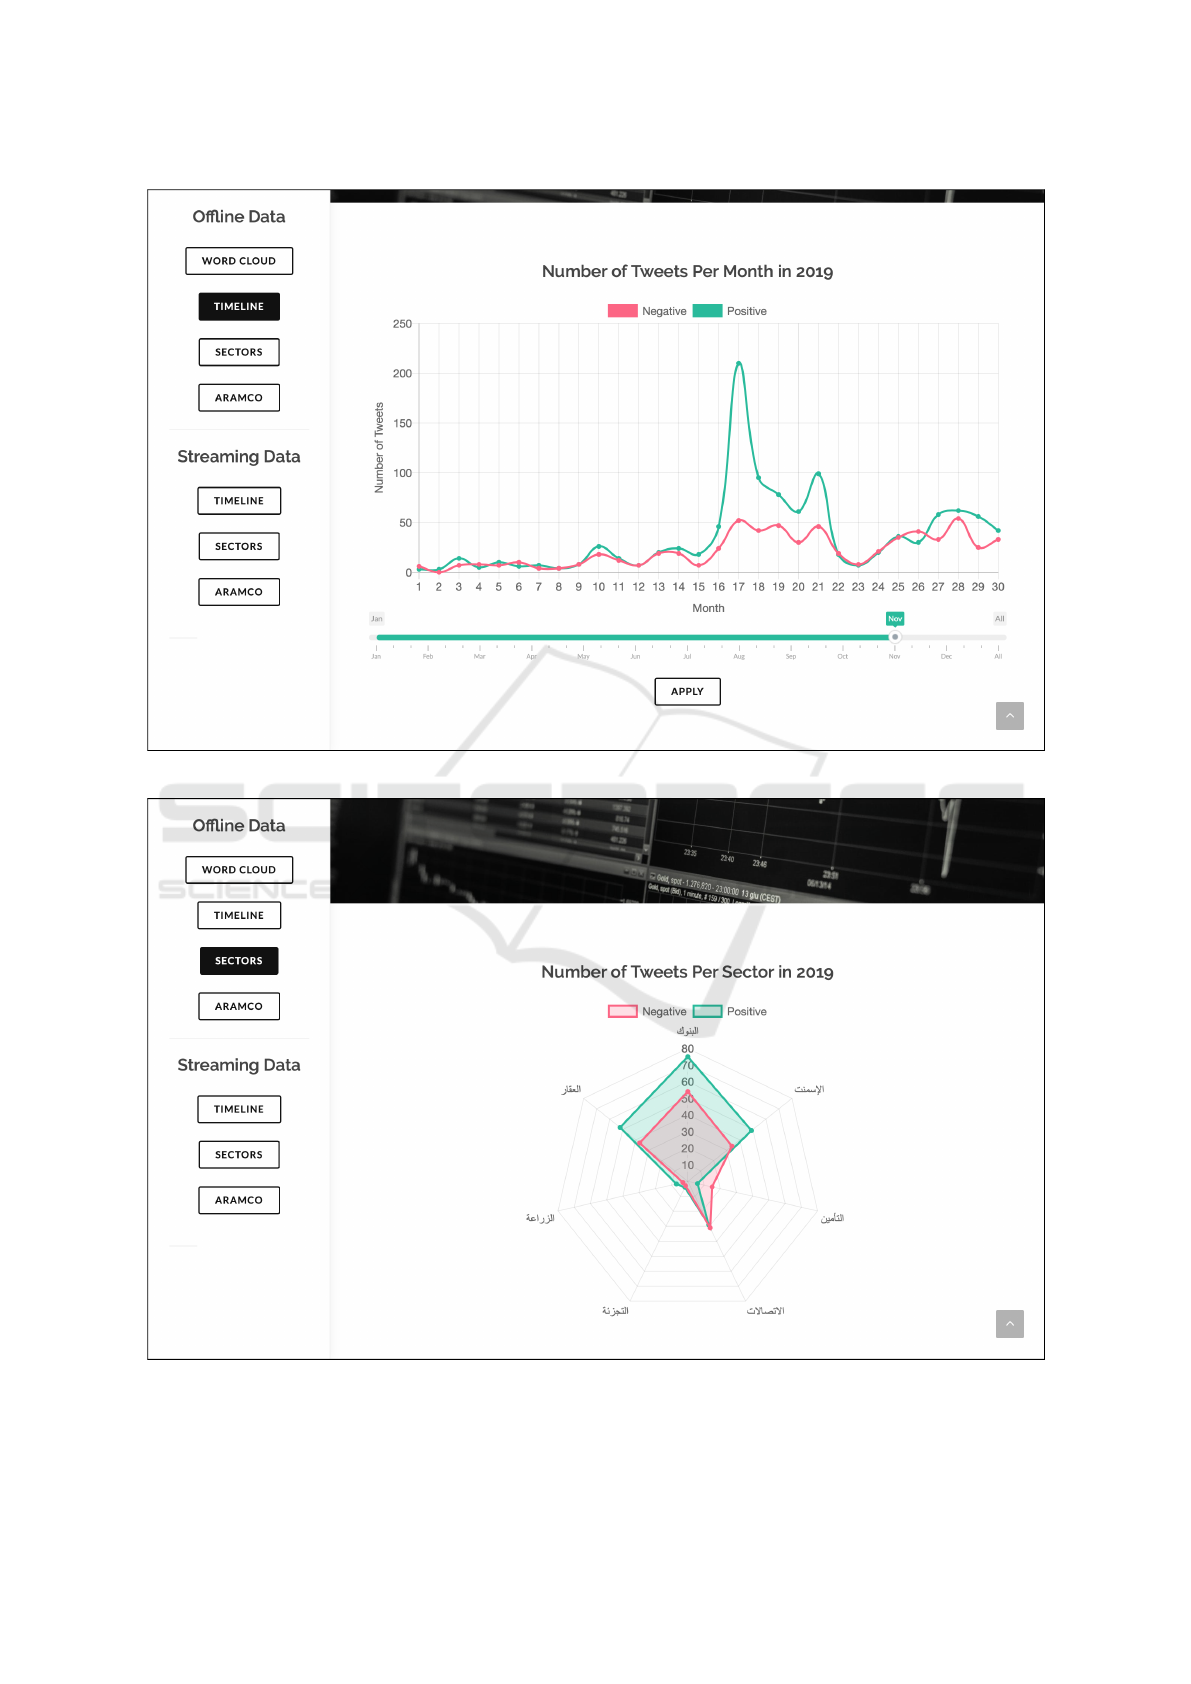
Figure 9: A webpage showing the number of tweets per day and their sentiments.
Figure 10: A webpage showing the number of tweets per sector and their sentiments.
Saudi Stock Market Sentiment Analysis using Twitter Data
45
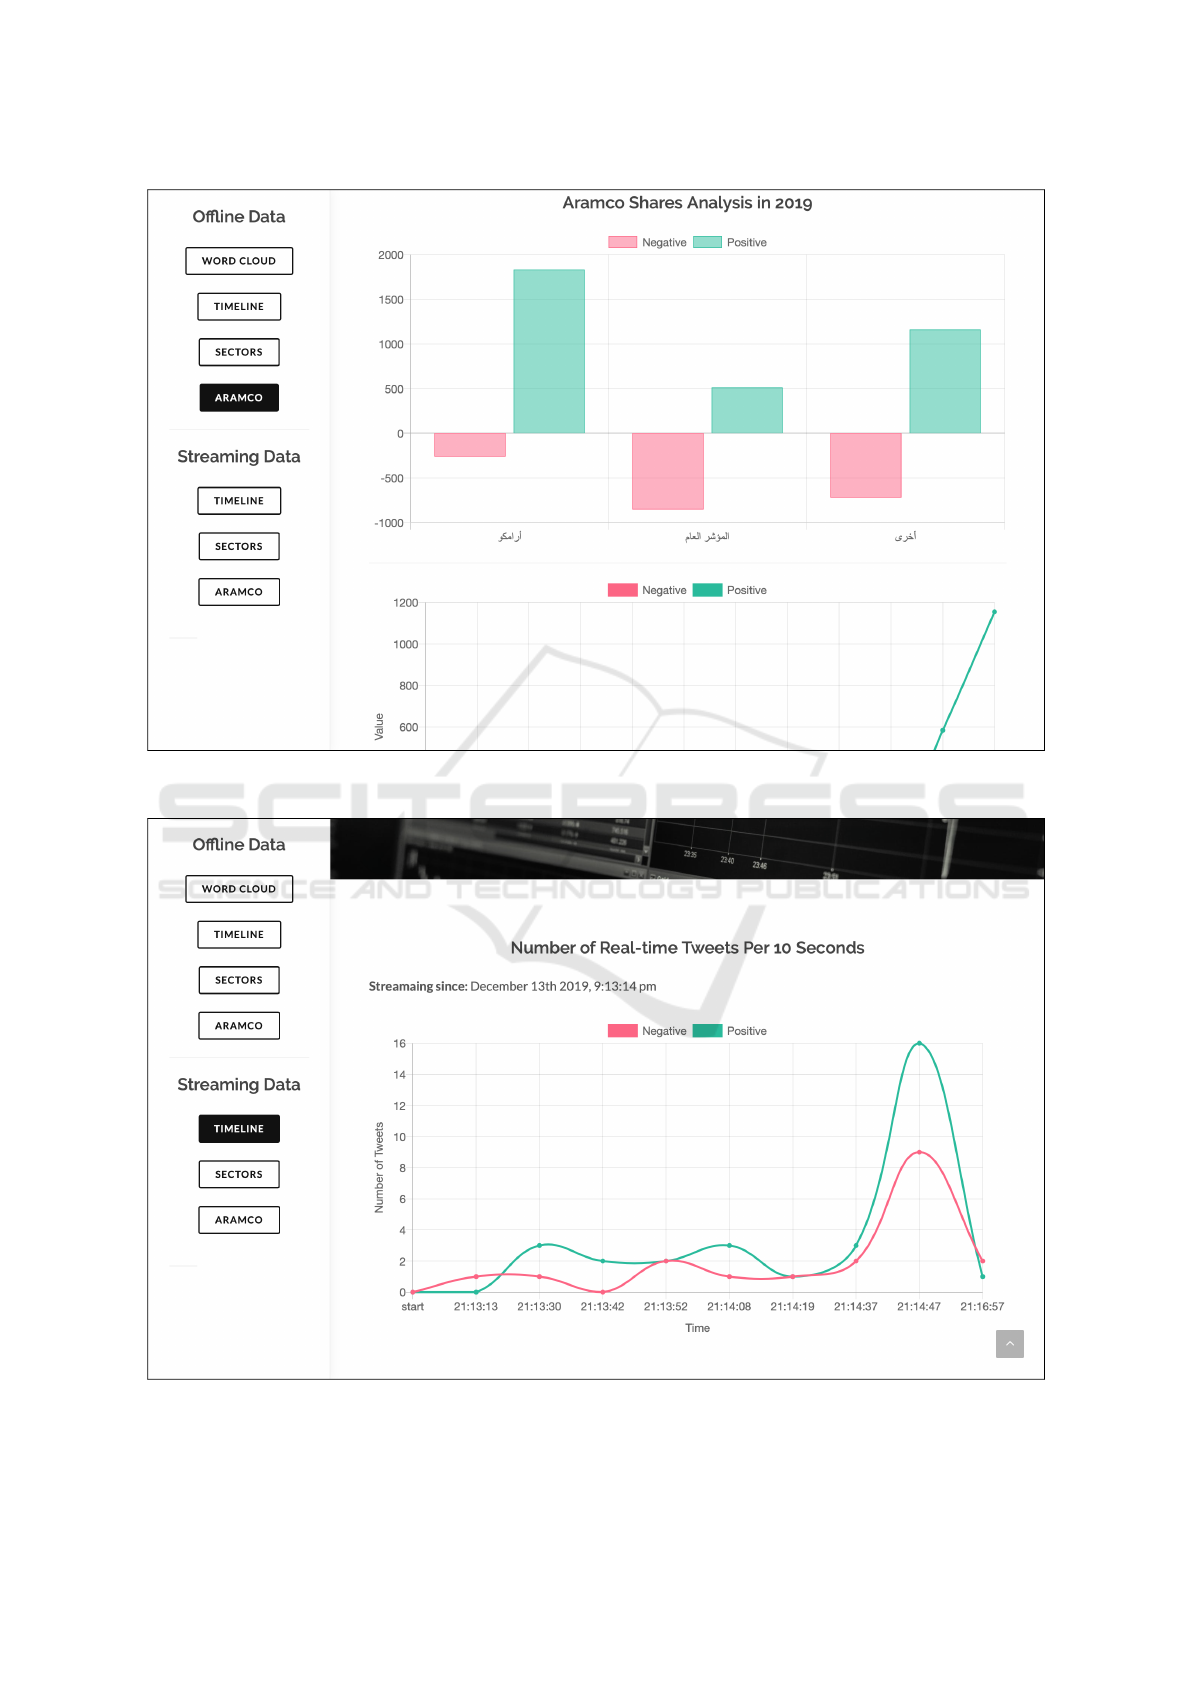
Figure 11: A webpage showing comparisons of Aramco’s number of tweets and their sentiments against TASI and all the
other sectors.
Figure 12: A webpage showing the number of real-time tweets and their sentiments.
KDIR 2020 - 12th International Conference on Knowledge Discovery and Information Retrieval
46
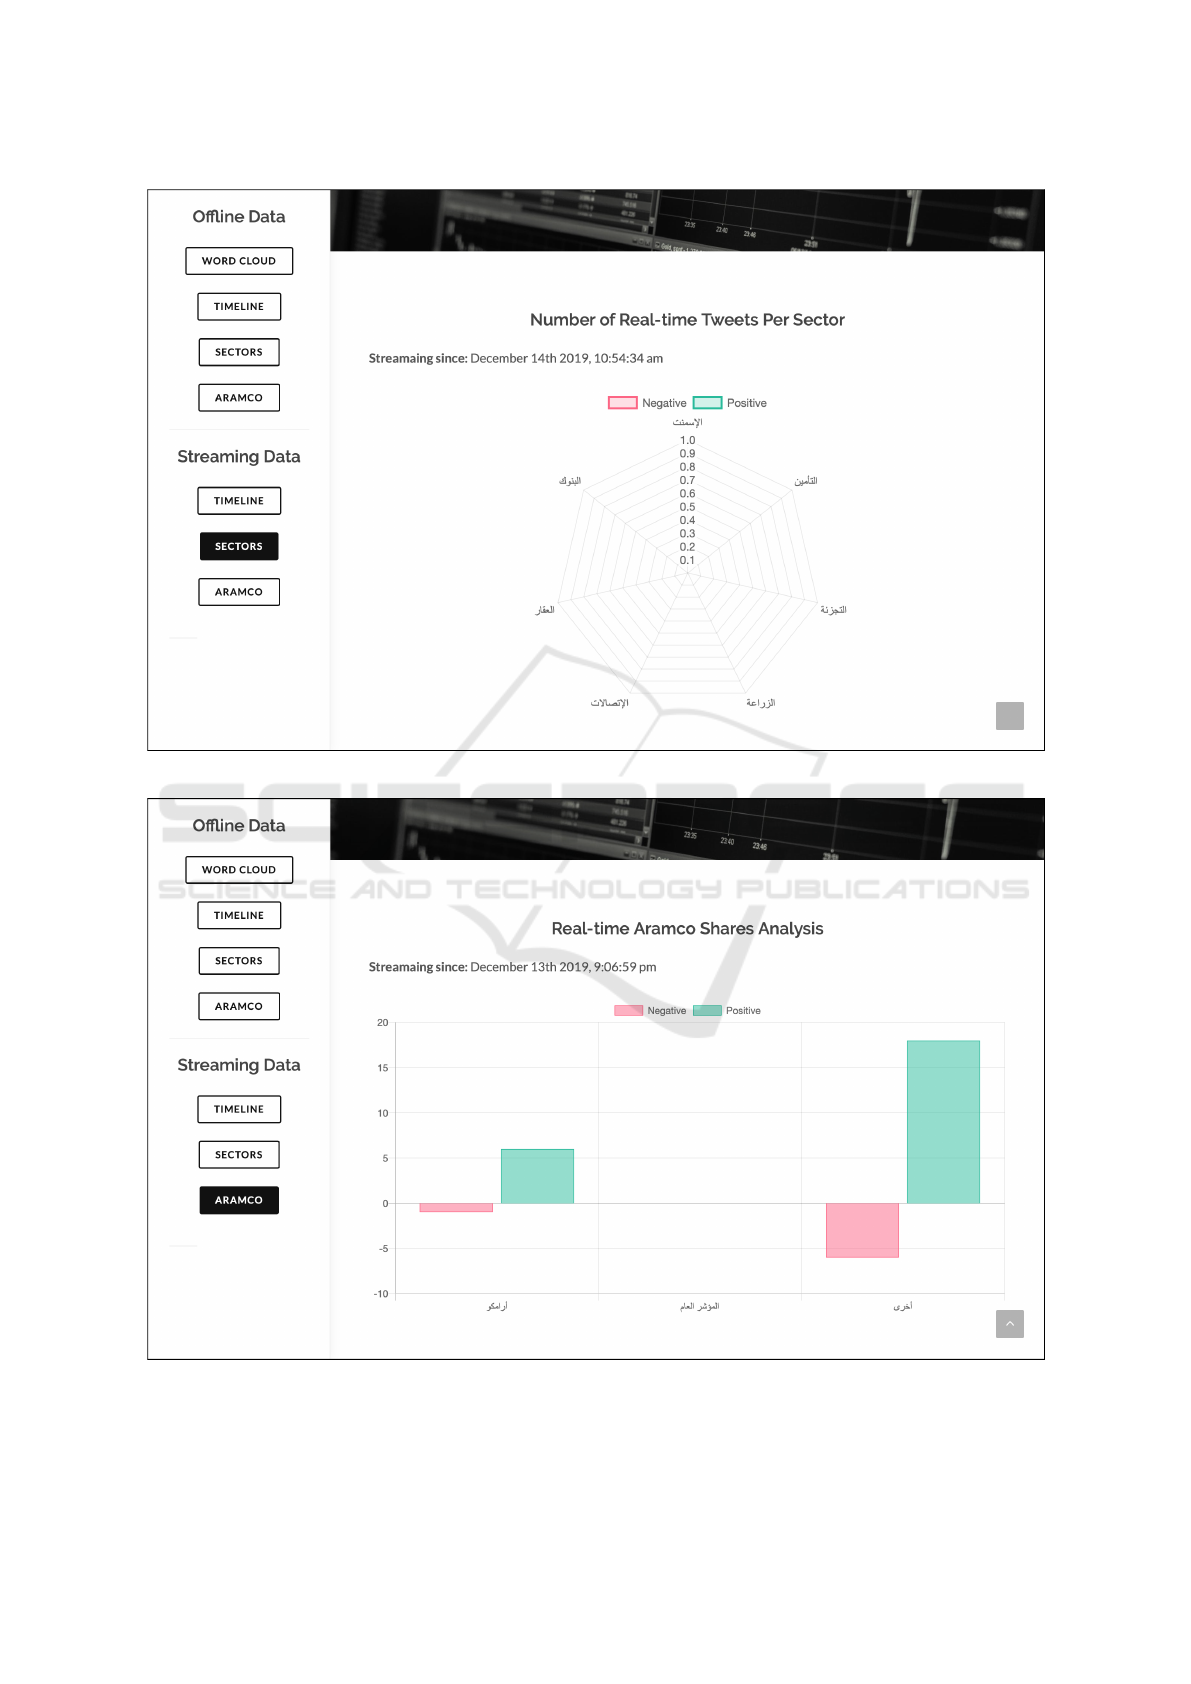
Figure 13: A webpage showing the number of real-time tweets per sector and their sentiments.
Figure 14: A webpage showing a comparison of Aramco’s real-time tweets and their sentiments against TASI and all the other
sectors.
Saudi Stock Market Sentiment Analysis using Twitter Data
47
