Study on Factors Affecting the Radiator-cooling of EV Power Battery
Pack
Fusheng Hu
1, a
, Chengzhi Ouyang
1
and Fei Xiong
1
1
GAC Automotive Engineering Institute, Guangzhou Automobile Group CO.,LTD, Guang Zhou, China
Keywords: Electric Vehicle, Thermal management, Battery cooling.
Abstract: Based on the battery pack cooled by cooling package within electric vehicle, the cooling process of the power
battery was studied by simulation and tests. The influence of the pump speed and fan level on the battery
cooling was compared. The results of the simulation and tests showed that the final battery temperature of the
high fan level was lower than 1°C relative to the low fan level, while the impact of the high speed water pump
relative to the low speed water pump is within 1°C during idle cooling procedure.
1 INTRODUCTION
Since the performance and reliability of the battery
pack dependent on its temperature (Pesaran and.
Keyser, 2001), various approaches to cool the power
battery were studied (Zhang et al, 2015) (Rao and
Wang, 2011). The liquid-cooled battery pack are
chilled by a lower temperature coolant and are more
efficient than air-cooled battery pack (Wu et al, 2002)
(Chen et al, 2016). The coolant should be cooled
down first before cooling the power batteries.
Generally, coolant can be chilled by two methods
(Wu W. 2019), one is cooled by the AC system of the
vehicle with chiller, and the other is chilled by the
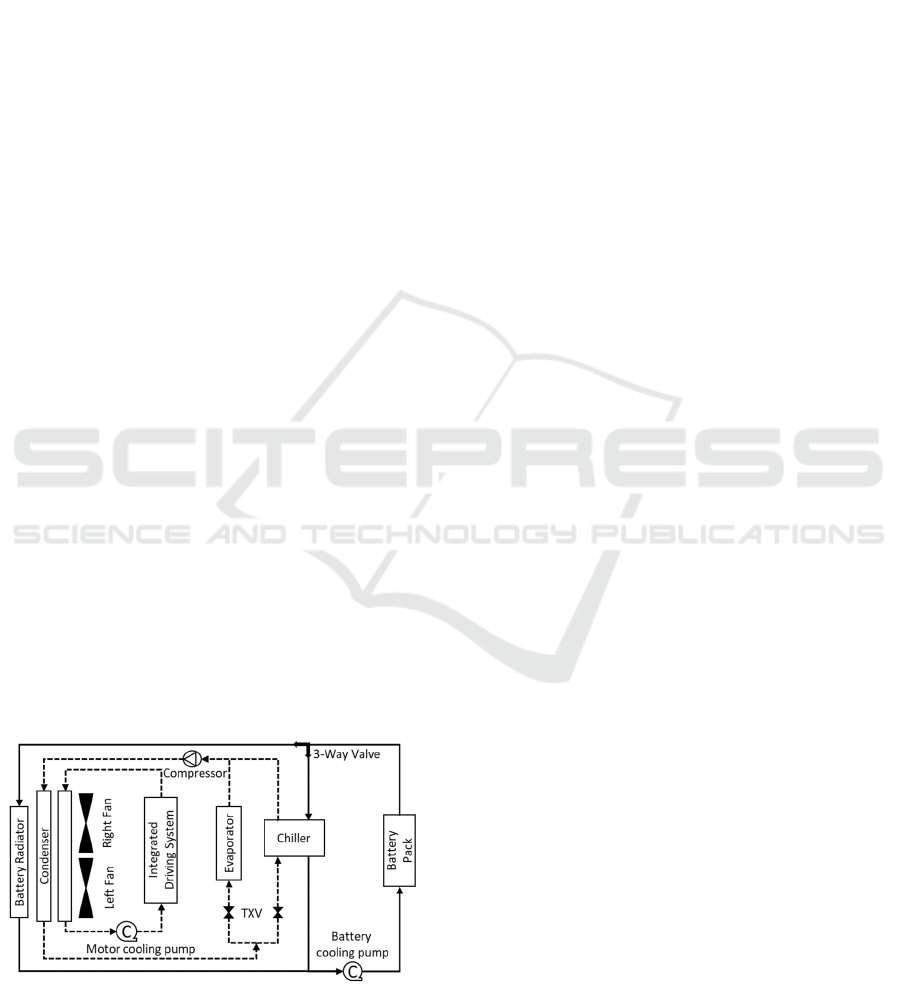
ambient temperature with radiator. Chiller-cooling
and radiator-cooling are combined in one architecture
as illustrated in the Fig. 1.
Figure 1: Electric vehicle thermal management system.
Many previous studies revealed the temperature
spread within the battery pack (De et al, 2017)
(Yoong,2019). But little attention was paid on the
whole cooling structure. 1D and 3D simulation
approaches were used to analyse the radiator cooling
based on the whole cooling system in this paper.
There are two main factors influence the radiator-
cooling efficiency (Deng Y. 2018), one is the fan
speed, the other is the coolant pump working status.
Different fan speeds and pump duty cycles were
compared based on simulation and tests. The vehicle
was in idle state, that is electrical loading on the
battery pack was neglected, during the cooling
process, so the self-heating of the battery was
negligible.
2 CFD SIMULATION OF THE
COOLING PACKAGE
The radiator was mounted in the front cooling
package and coolant is cooled down by outside air
flow, therefore the air flow caused by different fan
levels should be analyzed by 3D CFD at first. The
cooling package was arranged as shown in Fig.2.
Hu, F., Ouyang, C. and Xiong, F.
Study on Factors Affecting the Radiator-cooling of EV Power Battery Pack.
DOI: 10.5220/0010017900330037
In Proceedings of the International Symposium on Frontiers of Intelligent Transport System (FITS 2020), pages 33-37
ISBN: 978-989-758-465-7
Copyright
c
2020 by SCITEPRESS – Science and Technology Publications, Lda. All rights reserved
33
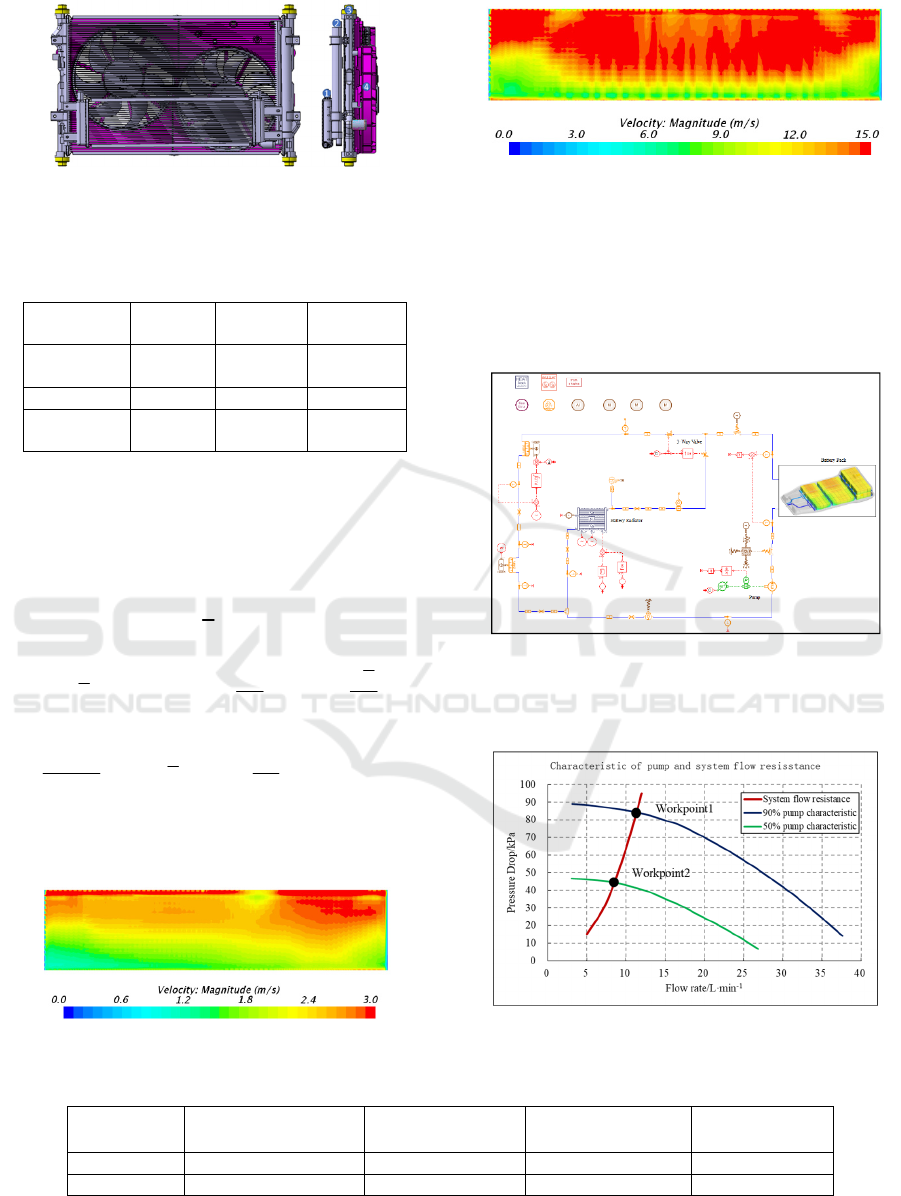
Figure 2: Cooling package arrangement.
The radiator dimensions were shown in Table1.
Table 1: Dimensions of the radiators.
Fan Levle
Width
/mm
Height
/mm
Thickness
/mm
Battery
Radiator
558 141 16
Condenser 657 356 16
Motor
Radiator
716 440 16
The RPM settings of the high and low level of fan
within the cooling package were shown in Table 2
The air flow in the cooling package was supposed
as incompressible. For CFD simulation, the following
equations were used.
div 0v
(1)
div( grad ) div( )
ieff i eff
ii
pv
vv v
xx
(2)
(T)
div( ) div( grad )
T
p
K
vT T S
TC
(3)
The simulated velocity contour results of battery
radiator by CFD is shown in Fig. 3
(a) Velocity contour of low fan level
(b) Velocity contour of high fan level
Figure 3: Velocity contour of battery radiator.
The 1D simulation model was built based on the
thermal system illustrated in Fig.1. The coolant is
50%-50% glycol-water mixture. The flow resistance
curve of the thermal system was simulated. The
results were shown on Fig. 5
Figure 4: 1D simulation model of the thermal system.
The analysed work point was shown in Fig. 5.
Figure 5: Pump characteristic and flow resistance curve.
Table 2: RPM of the fan on High/Low level.
Fan Level
RPM of Left Fan
/rpm
RPM of Right Fan
/rpm
Example column 1
Example
column 2
Low 1750 1450 Example text 1 Example text 2
High 2550 2250
FITS 2020 - International Symposium on Frontiers of Intelligent Transport System
34
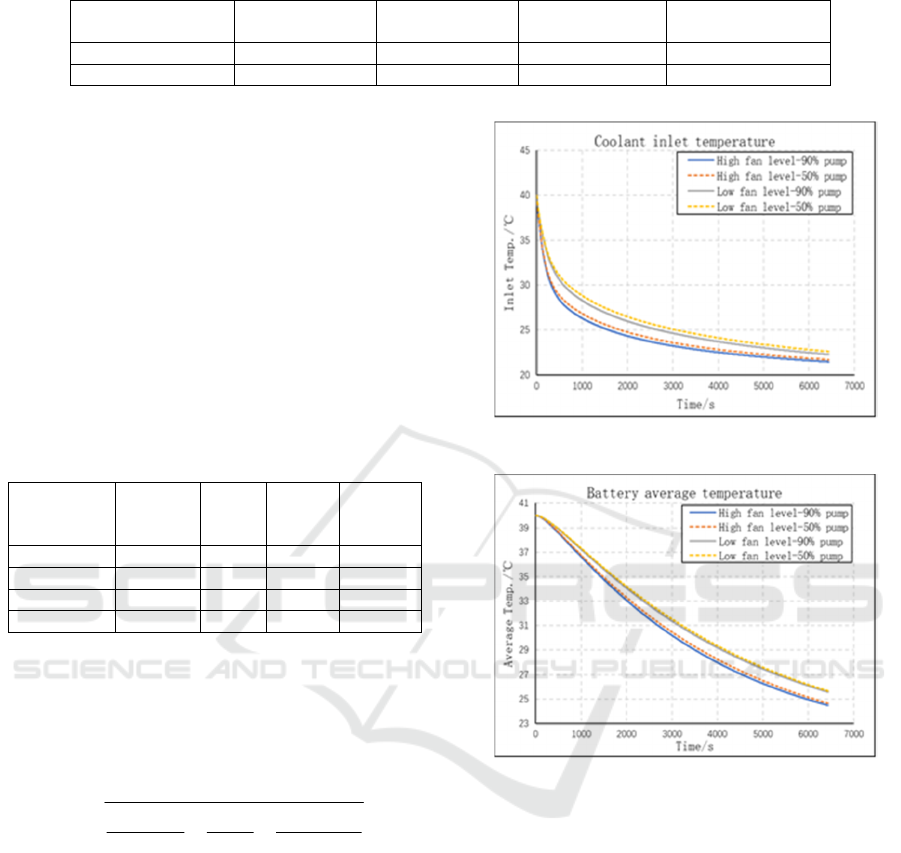
Table 3: 1D simulation results of the thermal system.
Working point
Duty cycle
/%
Pressure Drop
/kPa
Flow rate
/ L·min-1
Pump Power
/W
1 90 84 1450 56
2 50 44.5 2250 31
According to the above simulation, the pump
power was 51W and 31W at 90% and 50% duty cycle,
respectively. The detailed thermal flow system results
were shown in Table 3.
3 SIMULATION OF BATTERY
COOLING PROCES
The influence of the fan speed and pump duty cycle
on battery cooling process were studied based on the
previous simulated results. The simulation boundary
conditions were listed in Table 4
Table 4: Simulation conditions.
Work
Conditions
Ambient
Temp.
/°C
Initial
Temp
. /°C
Fan
level
Pump
Power
/%
1 20 40 High 90
2 20 40 High 50
3 20 40 Low 90
4 20 40 Low 50
The heat transfer of the radiator can be calculated
by NTU (Number of Transfer Units) (Theodore,
2011) method. The Heat transfer is calculated as
followings.
12
11 1 2 2 2
1
1
wall
kA
dd
Nu A G Nu A
(4)
kA
is the total heat transfer coefficient,
d
is the
hydraulic diameter,
Nu
is the nussel number,
is
the thermal conductivity of liquid,
A
is the heat
transfer area,
wall
G
is the thermal conductivity of
solid. The subscript represents gas-side and liquid-
side fluids.
Battery loading was ignored, so there was no self-
heating. The simulated coolant inlet temperature and
average battery temperature was shown in Fig.6 and
Fig.7
Figure 6: Coolant inlet temp. of simulation.
Figure 7: Battery average temp. of simulation.
According to the results, the effect of the fan level
on the water temperature and average temperature of
the battery was greater than the effect of the pump
speed. High fan level can accelerate the water
temperature and battery temperature drop under the
same working conditions. In addition, the working
power difference of the water pump was about 25W,
while of the fan was about 317W.
4 TESTS OF BATTERY COOLING
PROCESS
Cooling tests conditions were listed as Table 5.
Study on Factors Affecting the Radiator-cooling of EV Power Battery Pack
35
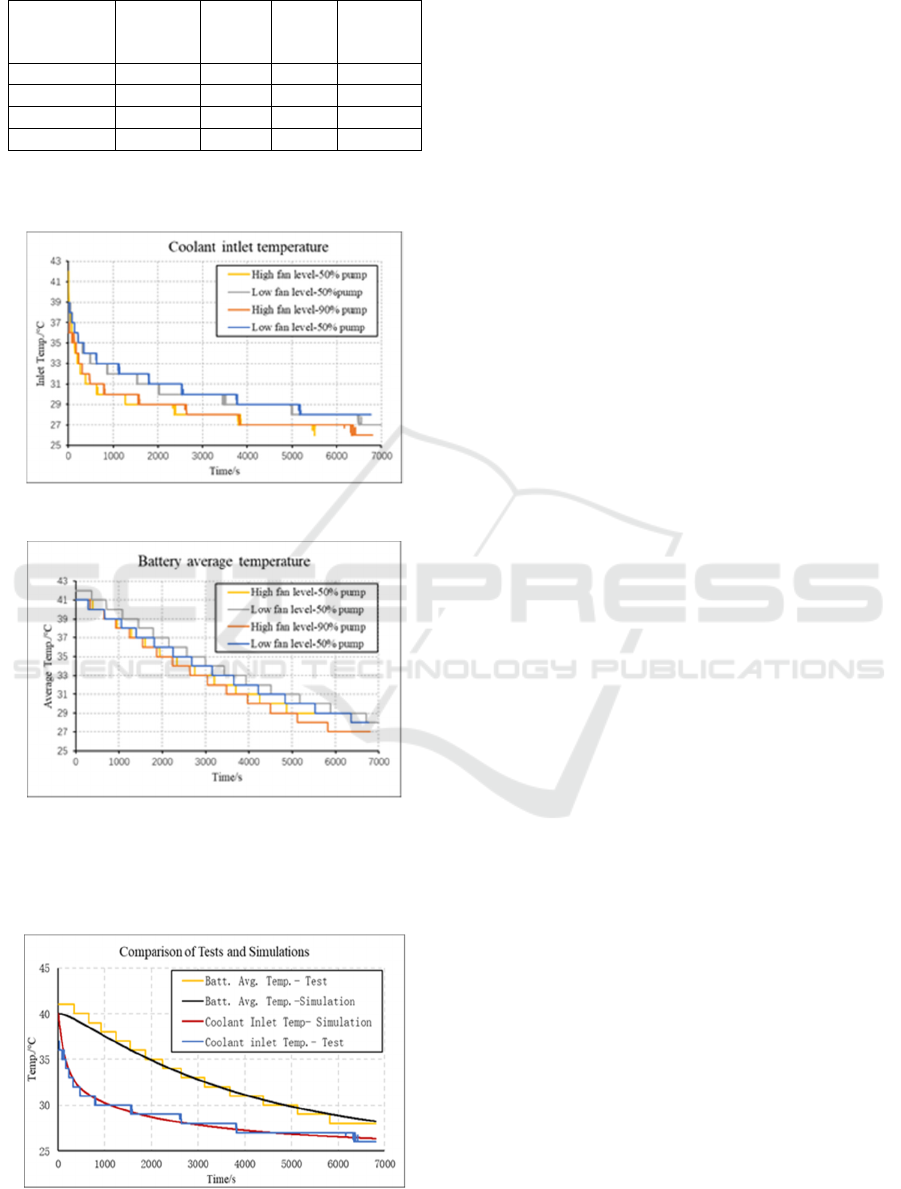
Table 5: Test conditions.
Work
Conditions
Ambient
Temp.
/°C
Initial
Temp.
/°C
Fan
level
Pump
Power
/%
1 25 40 High 90
2 25 40 High 50
3 25 40 Low 90
4 25 40 Low 50
The test results temperature were shown in Fig.8
and Fig.9.
Figure 8: Coolant inlet temp. of simulation.
Figure 9: Cooling performance of test results under
different fan and pump speed.
The comparison of the simulation and tests are shown
in Fig. 10.
Figure 10: Coolant inlet temp. of simulation.
According to the comparison, the inlet
temperature and the battery average temperature
behaved the same, the simulation results were
reliable.
5 CONCLUSIONS
This paper analyses the effect of water pump and fan
on coolant temperature and battery temperature
during the heat dissipation process. The results of the
simulation and tests showed that the final battery
temperature of the high fan level was lower than 1
°C
relative to the low fan level, while the impact of the
high speed water pump relative to the low speed water
pump is within 1
°C
during idle cooling procedure.
The above analysis can be used to the battery cooling
design.
REFERENCES
Chen D., Jiang J. and Kim GH, et al. (2016). Comparison
of different cooling methods for lithium ion battery
cells, Applied Thermal Engineering, Vol. 94: pages
846-854.
Deng Y. Feng C. Jiaqiang E. Zhu H. and Chen J. et al.
(2018). Effects of different coolants and cooling
strategies on the cooling performance of the power
lithium ion battery system: a review. Applied Thermal
Energy. Vol.142, pages:10-29.
De V. A, Maheshwari A, Destro M, et al. (2017). Transient
thermal analysis of a lithium-ion battery pack
comparing different cooling solutions for automotive
applications, Applied Energy, Vol. 206: pages 101-112.
MS Wu, KH Liu, YY Wang, et al. Heat dissipation design
for lithium-ion batteryies, Journal of Power Sources,
109(2002) 160-166.
Pesaran A. A. and Keyser M. (2001). "Thermal
characteristics of selected EV and HEV batteries,"
Sixteenth Annual Battery Conference on Applications
and Advances. Proceedings of the Conference, Long
Beach, CA, USA: pages 219-225.
Rao Z. and Wang S. (2011). A review of power battery
thermal energy management, Renewable & Sustainable
Energy Reviews, Vol. 15: pages 4554-4571.
Theodore L.B., Adrienne S. L., Frank P.I. and David P.D.
(2011) Fundamentals of Heat and Mass Transfer, John
Wiley& Sons Press.
Wu W. Wang S. and Wu W. et al. (2019) A critical review
of battery thermal performance and liquid based battery
thermal management. Energy Convers Manage. Vol.
182: page: 262-81.
Yan W., Qing G.and Tianshi Z. et al. (2017) Advances in
Integrated Vehicle Thermal Management and
Numerical Simulation. Vol 10.: pages:1636-1696.
FITS 2020 - International Symposium on Frontiers of Intelligent Transport System
36

Yoong C., Min Soo K. (2019). Thermal analysis and pack
level design of battery thermal management system
with liquid cooling for electric vehicles, Energy
Conversion and Management, Vol. 196: pages 105–
116.
Zhang T., Gao C., Gao Q., et al. (2015). Status and
development of electric vehicle integrated thermal
management from BTM to HVAC, Applied Thermal
Engineering, Vol. 88: pages 398-40.
Study on Factors Affecting the Radiator-cooling of EV Power Battery Pack
37
