
GPS Driven Camera Selection in Cyclocross Races
for Automatic Rider Story Generation
Jelle De Bock
a
, Alec Van Den Broeck
b
and Steven Verstockt
c
IDLab, Ghent University-imec, Belgium
Keywords: GPS Tracking, GeoJSON, Geospatial Analysis, Linked Open Data, Storytelling, Summarization.
Abstract: Cyclocross races are a very popular winter sport in Belgium and the Netherlands. In this paper we present a
methodology to calculate the proximity of riders to a number of cameras that are located on a cyclocross
course in order to automatically select the correct camera for each rider. The methodology is based on two
main input sources. The first input is the course with cameras positioned along it. As the course and camera
information is usually available as pdf and isn’t directly processable by computer programs, we propose the
conversion GeoJSON. The second requirement for our methodology is accurate location tracking of the
athletes on the course with the help of wearable GPS trackers. We present an experimental camera proximity
algorithm that uses both input sources and finds for every rider at any given moment in the race the closest
camera or vice versa. The output of this methodology results in automatic identification of the filmed riders
by a given camera at a given moment in the race and might benefit post-processing of the camera video
streams for further computer vision-based analysis of the streams, for example, to pre-filter the camera streams
or to generate rider and team stories.
1 INTRODUCTION
Over the past few years, cyclocross became more and
more global as the UCI World Cup series is organized
across the universe, with its epicentre located in
Belgium. Races are broadcasted on Belgian and
Dutch national television and the action is captured
by an array of approximately 20 cameras. The
optimal camera stream for a given moment in the race
is usually selected by the broadcast director who is
monitoring the race footage in the camera truck at the
race location. When the race gets very eventful and a
lot of action happens simultaneously this can be a
rather hectic job. Furthermore, it is not unimaginable
that the directors in charge have some subjectivity or
their preferences for certain riders or sectors. In the
current workflow, a lot of video footage is lost, as
only the main broadcast is usually persisted at their
servers. As it will be illustrated in this paper and in
further research, this is a missed opportunity because
having the raw footage at each moment in the race
might be valuable to generate additional race insights.
a
https://orcid.org/0000-0002-1676-9813
b
https://orcid.org/0000-0002-3593-7851
c
https://orcid.org/0000-0003-1094-2184
Data-driven race reporting might offer a solution
for the previously mentioned shortcomings. The
evolution of wearable technology and the
implementation of new wireless standards allow race
organisers to track every rider on the cyclocross
course in real-time. Studies of Hess et al. and Merry
et al. show that nowadays fairly accurate GPS
tracking is even possible with most of the available
smartphones. However, for demanding events such as
cyclocross and long road races, a dedicated GPS
tracker is used more often. The Quarq Qollector is an
example of such a device that tracks GPS location and
combines it with sensor data such as heart rate, power
and cadence. The sensor is usually mounted on the
riders’ bikes or at the back of their skinsuit and is
transmitting its data in real-time to the Quarq servers
using 3G cellular data connectivity. Based on the
rider location we can search the camera on the course
that is best used to capture the riders.
Cyclocross courses are challenging for riders, but also
for the film crew to bring the race to the television
viewer. The design of a cyclocross track can be
considered as “a fine art” as courses are usually built
De Bock, J., Van Den Broeck, A. and Verstockt, S.
GPS Driven Camera Selection in Cyclocross Races for Automatic Rider Story Generation.
DOI: 10.5220/0010016200670074
In Proceedings of the 8th International Conference on Sport Sciences Research and Technology Support (icSPORTS 2020), pages 67-74
ISBN: 978-989-758-481-7
Copyright
c
2020 by SCITEPRESS – Science and Technology Publications, Lda. All rights reserved
67
by a handful of specialists and often ex-professional
riders such as Adrie van der Poel, Richard
Groenendael and Erwin Vervecken. Planning,
building and finalizing the perfect track takes weeks
to provide riders with a challenging, but safe course.
Obstacles such as barriers, sandpits and off-camber
sectors make cyclocross interesting to watch both at
location and on the television. The broadcast director
visits the location a couple of days in advance and
accurately plans the camera setup at race-day.
Cameras, identified by their index number, are placed
on a topological map of the course (see Figure 1 for
an example of such a course plan).
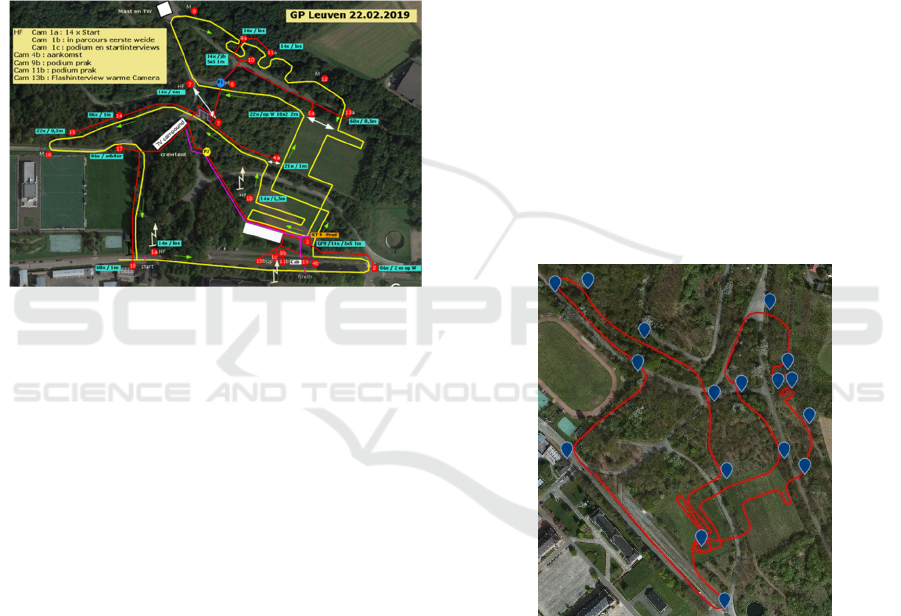
Figure 1: Example pdf document of the race broadcasters
plan of the Leuven cyclocross track. Plan contains the
course (yellow line). Cameras are annotated as red circles.
It is a very detailed plan of the course but is not directly
processable by a computer program.
The combination of the multiple camera streams,
detailed riders’ locations and carefully planned and
documented course and camera location make the
cyclocross broadcasting a very interesting use-case for
automation. As mentioned, camera selection and race
monitoring can be very hectic at times. In literature
several implementations that predict the best camera at
given circumstances based solely on the camera
streams exist. Shen and Fels proposed a methodology
that produced a Quality of View (QOV) measurement
for classifying the quality of each shot in a multi-
camera surveillance system. In a sports related context,
Chen et al. implemented a methodology to
automatically select the correct video camera stream
based on Internet videos in soccer games. However, in
this paper we present a mechanism that tracks the
riders’ location based on either GPS files or real time
data and returns the closest camera to a given rider.
Video editors and directors could benefit from this
mechanism as streams can be pre-filtered based on the
vicinity of riders. Finally, it can also be used to
generate a summary of a rider/team across all cameras.
2 METHODOLOGY
In this section we introduce the steps of the
methodology to match a rider based on its GPS
location to the closest camera.
2.1 Course Digitalisation
The first step to a GPS assisted camera proximity
algorithm is the digitalisation and annotation of the
racecourse and cameras positioned along that course.
Currently this is a partly manual (offline) process in
which a portable document format (pdf) and a gps
exchange format (gpx) file are used as input. The gpx
file can be either provided by a rider who did practise
on the course or it can be drawn with tools such as
Komoot, RideWithGPS or Garmin Connect. This gpx
file of the course is converted with a Python script to
a GeoJSON linestring object. GeoJSON is a very
useful standard to store, represent and
programmatically access geographic data. The
linestring of the course consists of interconnected
points (latitude/longitude pairs) of the track (red line,
Figure 2).
Figure 2: Digitalized version of the cyclocross course of the
Rectavit Series Leuven (2020) based on Figure 1. Red line
is the GeoJSON course linestring. The blue markers are
GeoJSON point features and are representing the cameras
and their respective identifiers (camera id).
The locations of the cameras are registered by the
broadcasters in a pdf containing both the course and
the locations of the various cameras across the track.
Every camera on the schematic has an identifier (e.g.
Camera 7a), but the logic behind the numbering isn’t
related to its exact location on the track. To make this
camera locations programming interface friendly, we
manually added the locations to the GeoJSON track
icSPORTS 2020 - 8th International Conference on Sport Sciences Research and Technology Support
68

file of the previous step. The installed cameras on the
course are stored as GeoJSON point features with the
identifier of the camera as its properties (see Code 1 for
the json code representing the camera location of
camera 2). The camera digitalisation is a rather manual
procedure, but tools such as GeoJSON.io are making
this rather straightforward. Future work will also
further focus on the development of a tagging tool that
can automatically generate the GeoJSON data.
{
"type": "Feature",
"properties": {
"type": "camera",
"camera_id": 2,
},
"geometry": {
"type": "Point",
"coordinates": [
4.710833430290222,
50.85269722820937
]
}
}
Code 1: GeoJSON code representing the “camera 2”
coordinates on the course as a point geometry. The feature
has its type and camera_id stored as the properties.
2.2 Rider Location Processing
Once we have a structured representation of the track
and the cameras placed around it, we can start looking
for riders on it. As mentioned in the introduction,
several methods do exist to accurately track and trace
riders on the cyclocross course. We divided rider
tracking in two separate approaches. In the first
approach, GPS eXchange (gpx) files were used to get
time stamped locations of the riders, who recorded
their races with their own GPS head units or watches.
These kinds of files are usually uploaded to online
web applications such as Strava, Trainingpeaks or
Today’s plan for further analysis. Although this is not
offering us real time locations of the riders, it still
provides great information for our camera and rider
matching algorithm for post-race video analysis and
summarization. Another benefit of using this
approach is that there is no need to interface with
external Application Programming interfaces (APIs)
and real-time storage and management isn’t an issue.
The second approach to get the riders’ locations
is by using one of the many connected GPS trackers
(eg. SPOT or Quarq Qollector). These GPS trackers
are usually worn on the riders’ bodies or fixed to their
bikes. Most of the trackers are accessible by APIs.
A Python program was written to interface, read
and interpret the data from the Quarq qollector API.
Each Quarq Qollector device has a tracking id (tid).
With the API we were able to periodically (every
second) retrieve all the sensor and location data that
was recorded by the Quarq Qollector for a list of
participating tracking ids.
Both approaches result in the location of the
tracked riders for any given moment during the race.
An abstraction layer was written to quickly get a
location for a specific rider at a given timestamp,
independent from the underlying rider tracking
technology.
Riders are often tracked with an identifier. For
further computer vision-based analysis on the camera
streams the riders’ names and other relevant
information about them should be linked with the
tracking identifier. The linking process should be
generic and future-proof. The connection of the
riders’ identities with the tracking devices should
introduce the least manual effort as possible. In
cyclocross, new teams appear, and old ones disappear
rather quickly. Riders’ contracts can range anything
from one year to three years, so riders changing teams
is very common. The open WikiData knowledge base
is the perfect data provider for this information. Most
of the riders playing a key role in the race are well
documented in WikiData. Their WikiData entries
(also called entities in WikiData) are often containing
lots of meta-information, such as their height, weight,
team history, birthday and many more. WikiData is
maintained by a rather active community of
contributors around the world. Everybody can
propose changes to a WikiData page. For instance,
during 2020, the page of famous cyclocross rider
Wout Van Aert has been already changed/improved
more than five times. This example makes it safe to
say that important changes such as team changes or
big victories will most likely be updated quite
quickly. Finally, the WikiData knowledge base can
also be easily exported as a Javascript Object
Notation (JSON) document or queried using the
SPARQL query language. An example query to the
WikiData SPARQL endpoint is shown in Figure 3. As
illustrated and if available a royalty free “profile”
picture is also retrieved.
It is important that rider ids are linked to the
WikiData entity id (QID) for further analysis of the
video streams. Currently the link between the location
tracking ID and the tracked rider’s WikiData QID
was made manually. For each tracked rider we make
a list that projects each tracking ID number on the
athlete’s WikiData QID that produces the tracking
data. This process would become much easier if riders
would have a fixed location tracking ID as well (i.e.
if they were using the same trackers every race).
GPS Driven Camera Selection in Cyclocross Races for Automatic Rider Story Generation
69
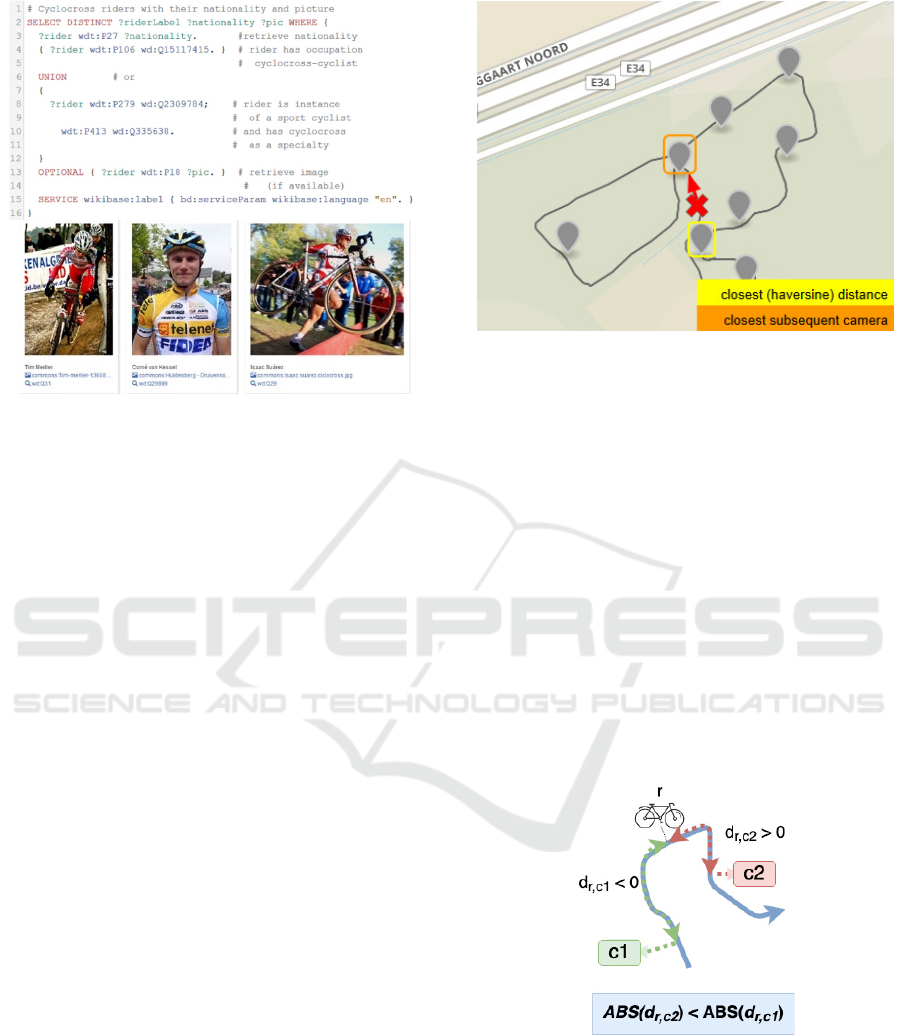
Figure 3: Example SPAQRL query that retrieves all
cyclocross riders from the WikiData knowledge base with
their WikiMedia image. Result can be stored as JSON or
XML. This produces useful rider meta-information for
further computer vision-based video stream analysis.
2.3 Camera Rider Matching Algorithm
Now that racetrack, camera locations and rider
locations are available and converted to a computer-
understandable format a camera matching algorithm
can be introduced.
As a start, a formal definition of the proximity of
a rider to a certain camera should be given. The
calculation can be tackled in a couple of different
ways. A first possibility might be the calculation of
the haversine distance between a rider and all of the
available cameras. The haversine distance is a
formula that is very important for geospatial purposes
as it is calculating the distance between two points
(using their latitude and longitude coordinates) on a
sphere (i.e. the earth) (Ingole and Nichat, 2013).
In some cases, haversine distance can be enough,
but sometimes the track layout of a cyclocross race
might not be ideal for this calculation method. Tracks
usually consist of lots of tight turns on a compact area.
Figure 4 illustrates this principle. The yellow circled
camera is the one that is detected as closest to the rider
(represented by the red X). This might result in a good
shot of the rider, based on the orientation and direct
visibility of that specific camera at this location.
Another possibility is to project both the cameras
and the riders on the course’s linestring (Westra). The
proximity of a camera is now determined by the
distance along the course from the rider to the
projection of the camera (see Figure 5). The
projection is achieved by finding the index of the
Figure 4: Camera setup on a test course. The red X is the
current location of the rider following the course in the
direction of the red arrow. Yellow circled marker is the
absolute closest camera. Orange circled marker is the next
camera the rider will visit on the course.
point on the course with minimum (haversine)
distance to the camera’s location. If n is the number
of cameras and l the number of course points this
approach has a time complexity of O(l·n). As
mentioned, camera and course data are available prior
to the race so this step can be pre-processed for faster
real-time querying.
A final optimization that can be done is the pre-
indexing of the course points based on the closest
cameras (see Figure 6). Finding the closest camera for
a given rider is reduced to a search in a precomputed
list that is mapping each point on the course to the
best/closest camera.
Figure 5: Illustration of closest camera along the course
principle. Rider r is “snapped” on the blue course line
following the direction of the arrow. Cameras c1 and c2 are
also projected on the course linestring. Distance d is the
distance from rider r to a camera c with a given index,
following the course path. Negative distances are cameras
behind the rider, positive distances are cameras the rider is
approaching. Closest camera is the camera with the smallest
absolute distance.
icSPORTS 2020 - 8th International Conference on Sport Sciences Research and Technology Support
70
It is worth mentioning that labelling which
camera is serving which point on the courses can also
be done manually by the responsible video director
prior to the race (resulting output is similar to the
output of the pre-indexing approach, Figure 6) .
Although this process is a manual effort (that can be
facilitated by a software tool), it will in some
situations be more accurate, e.g., when dense forests,
elevation differences or audiences are blocking the
direct view of the closest camera.
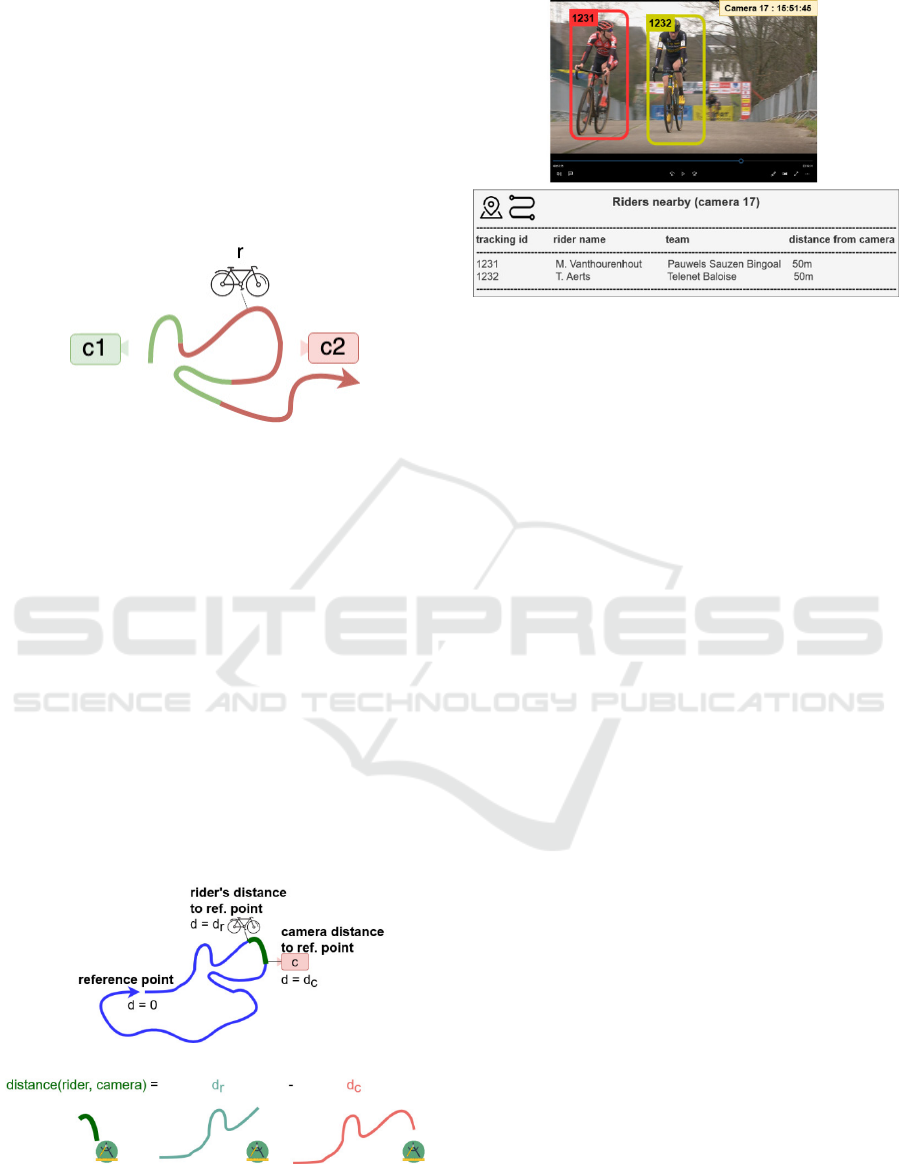
Figure 6: Alternative straightforward approach. Only riders
are projected on the course. Each point on the course is
labelled with the camera that is serving that location on the
track. This can be done by the race directors prior to the race
or can be the result of the camera on course projection
technique. Getting the closest camera is now a case of
looking at the camera index of the point of the rider on the
course. Distance to the camera can also be pre-processed
for each point on the course using either the haversine or
the distance across the course metric.
Now that we know the closest camera for a given
rider, we also want to get an idea how far away that
camera is. Figure 5 explains the distance (d
r,c
) between
a camera c and the rider r. The distance is not the
direct distance between both points but is again the
distance along the course’s path. A negative distance
means that the camera is behind the rider and
positioned earlier on the course. A positive distance
means that the rider is approaching this camera.
Figure 7: Visual illustration how the referencing approach
uses distances w.r.t. a reference point. The distance between
two points is the result of the difference between distances
from both points to the reference point.
Figure 8: Example output of the camera matching algorithm
for a cyclocross race of the 2019-2020 season. Manual
verification in the video stream shows that riders 1231 and
1232 are indeed visible by the camera. This shows the
feasibility of tracking a rider during the race across the
available cameras which is facilitating the video searching
process.
To further speed up the camera matching
algorithm the distances of riders and cameras on the
courses were mapped with respect to a fixed point on
the course. We choose the start of the course as the
reference point (see Figure 7). This allowed pre-
indexing all camera projection locations elapsed
distances w.r.t. the course starting point. Finding the
distance between a rider and a camera with given
index is now a case of finding the elapsed distance of
the rider (projected on the course line) w.r.t the course
reference point, look up of the elapsed distance of the
camera’s elapsed distance (w.r.t course reference
point) and subtracting both distances.
3 RESULTS
With the introduced building blocks, we can now
track riders on the course and find their distances to a
given camera. This approach facilitates several
interesting analyses. A first possibility is the sorting
of riders based on their proximity to a certain camera.
Figure 8 shows an example of such a search for the
cyclocross race of Leuven around minute 50 of the
race. Solely based on sensor data and the course and
camera metadata we can reduce the number of riders
that might have been filmed by a certain camera. As
an example, and as shown in Figure 8, the total
number of riders nearby was limited to only two of 13
riders. From one side this methodology might give us
an idea of how many and who to expect at a given
camera at a given moment in the race. This can for
example be very interesting to limit the number of
GPS Driven Camera Selection in Cyclocross Races for Automatic Rider Story Generation
71
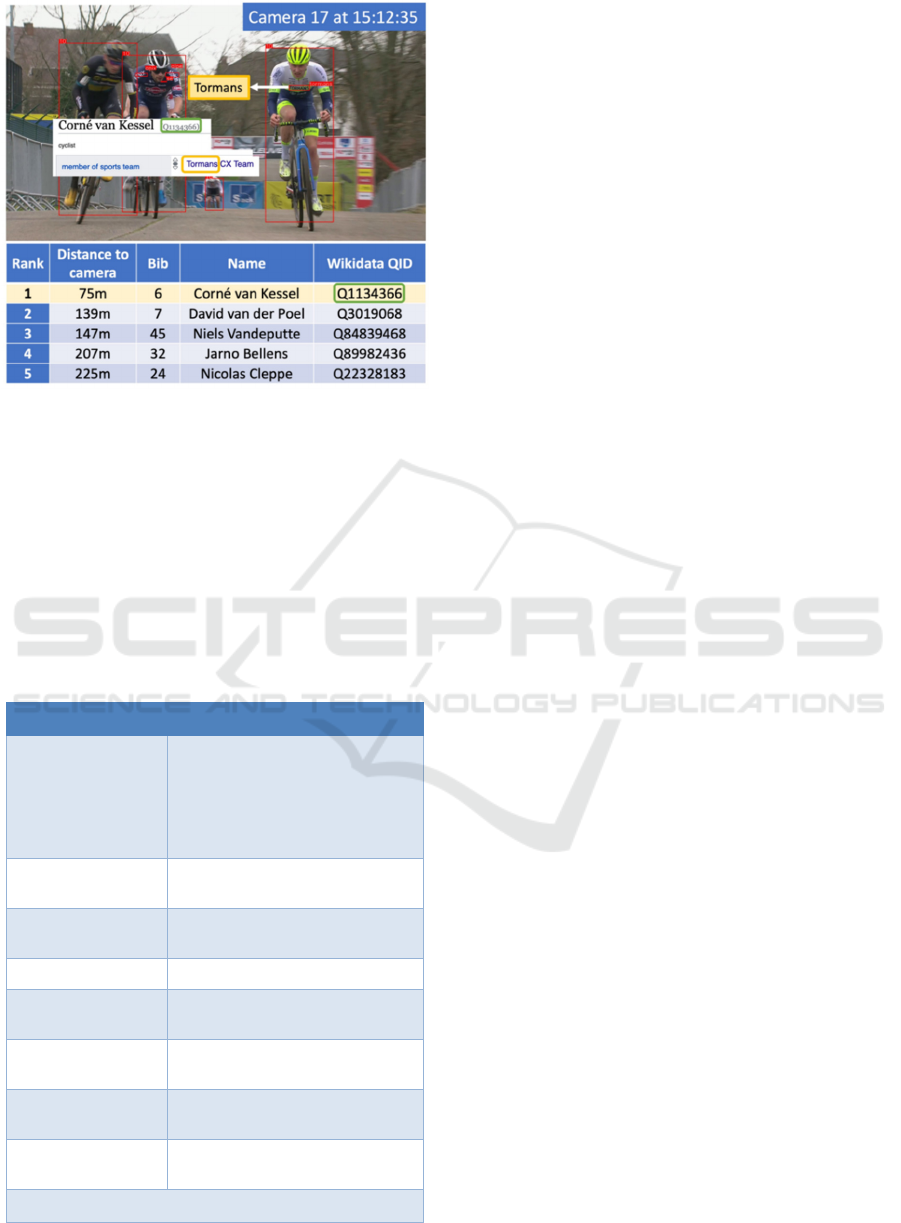
Figure 9: Example of how camera proximity algorithm can
help computer vision techniques with rider identification.
candidates for automatic rider recognition/annotation.
On the other side a certain rider could also be
followed across the different cameras which enables
the tracking of a specific rider across all cameras
during the race. This can be useful for teams or for
fans who are only interested in their favourite rider.
Table 1: Benchmark setup with execution times of pre-
processing stage and of some scenarios of the Leuven
cyclocross case.
Test setup – race moment 22/02/2020 15:05:43
Hardware
Apple MacBook Pro (2018)
Intel Core i5 – 2.3 Ghz – Quad Core
8GB RAM
Intel Iris Plus Graphics 655 1536
MB
Total number of
cameras
17
Total number of
riders
13
Pre-processing
45.5 s
Loading
configuration
0.01 s
Distance all riders to
all cameras
3.11 s
Distance 1 camera
to all riders
0.18 s *
Distance from 1
rider to all cameras
0.23 s *
* time scales linearly when #cameras/riders increase.
The last cyclocross races were held before the
suggested methodology was developed, we could
only test this approach in an offline manner.
Nevertheless, it is important that the performance of
the implemented workflow is appropriate for real-
time querying as well. To verify the feasibility of live
camera proximity tracking in cyclocross races, the
proximity algorithm was tested in several different
race scenarios. Detailed results of the test can be
found in Table 1. We used a total of 17 cameras and
13 riders with tracking information in this test. The
most expensive operation was the retrieval of
proximity of all riders to all cameras, which took
roughly 3 seconds. This can be improved with further
reasoning and knowledge of the sequence in which
the cameras were positioned. For instance, if only one
of the 17 cameras detects nearby riders, it doesn’t
make sense to run the camera proximity algorithm
five seconds later on a camera that is on the other side
of the course. Moreover, as GPS systems have an
accuracy of around 10 meters (Fong et al.) and riders
are riding at speeds ranging between 3 and 15 m/s, the
execution time of 3 seconds is justifiable.
#EXTVLCOPT:start-time=28
#EXTVLCOPT:stop-time=36
camera_1.mp4
#EXTVLCOPT:start-time=500
#EXTVLCOPT:stop-time=550
camera_17.mp4
#EXTVLCOPT:start-time=900
#EXTVLCOPT:stop-time=1100
camera_5.mp4
Code 2: Sample .m3u file. An m3u file is a kind of playlist
that extracts specific parts from larger video files (in our
example the different camera streams) and plays them
subsequently.
With this information in mind, we can start
collecting video extracts from different camera
streams and compile them in either a rider specific
summary or extract only the parts from a raw camera
stream in which riders were nearby. When the streams
are available as individual files (e.g. camera_1.mp4,
camera_17.mp4 and camera_5.mp4 in code extract 2)
it is possible to make an m3u playlist which is
bundling all the separate clips as one continuous
video, without the need to duplicate the data of the
original camera streams (Garcia et al.). Code extract
2 shows the content of an m3u file, selecting 3 video
extracts from three different camera stream files.
icSPORTS 2020 - 8th International Conference on Sport Sciences Research and Technology Support
72
4 CONCLUSIONS AND FUTURE
WORK
The proposed mechanism is not only useful for race
broadcast directors, but the filtered streams can also
be further processed by video processing algorithms
to annotate, index and document the race footage. The
camera proximity algorithm can serve as a first filter
for the video footage before it is processed by the
video processing tools which are also currently being
developed within our cyclocross video research
project. Techniques such as text recognition, face
recognition and pose estimation are used to further
annotate the filtered video extracts from the camera
streams.
The camera proximity algorithm can also further
assist the computer vision modules (Xue et al.).
Currently the main components of our computer
vision pipeline are a Detectron2 pose estimator to
locate the riders and a Keras-OCR (Python library
that combines a CRAFT text detector and CRNN text
recognition to read jersey numbers and sponsors, Nag
et al. and Baek et al.) and text recognition module.
For instance, as the example in Figure 9 illustrates,
our text recognition detects “Tormans” and the output
of the camera proximity algorithm (see table in Figure
9) outputs that only one rider of that team is in the
neighborhood of the camera in question (i.e. camera
17). Combined with the help of the WikiData
information available about the riders and their teams,
we can easily find out the rider’s identity (i.e. Corné
van Kessel).
Moreover, the use of WikiData information of
riders has also been found to be beneficial as it offers
a semi-automated way to get up-to-date data about
riders. In the future we plan to even further extend
this WikiData approach. Participants of a cyclocross
race are usually available as a PDF document roughly
an hour before the race. We are currently writing a
Python library to process these formatted PDF
documents and extract riders and their bib numbers.
A similar approach can be used on the PDF of the race
results. The parsed information of both PDF
documents can then be committed to the WikiData
page of the cyclocross race. New WikiData entities
are automatically created if the race or rider isn’t on
WikiData yet. Ultimately, this extra information
could be very helpful to link the output of the camera
proximity algorithm with insights gathered from the
computer vision techniques applied on the camera
streams. For instance, in Figure 10, the WikiData race
participant information helps the computer vision
pipeline to identify the rider based on the shoulder
number on the rider’s left arm.
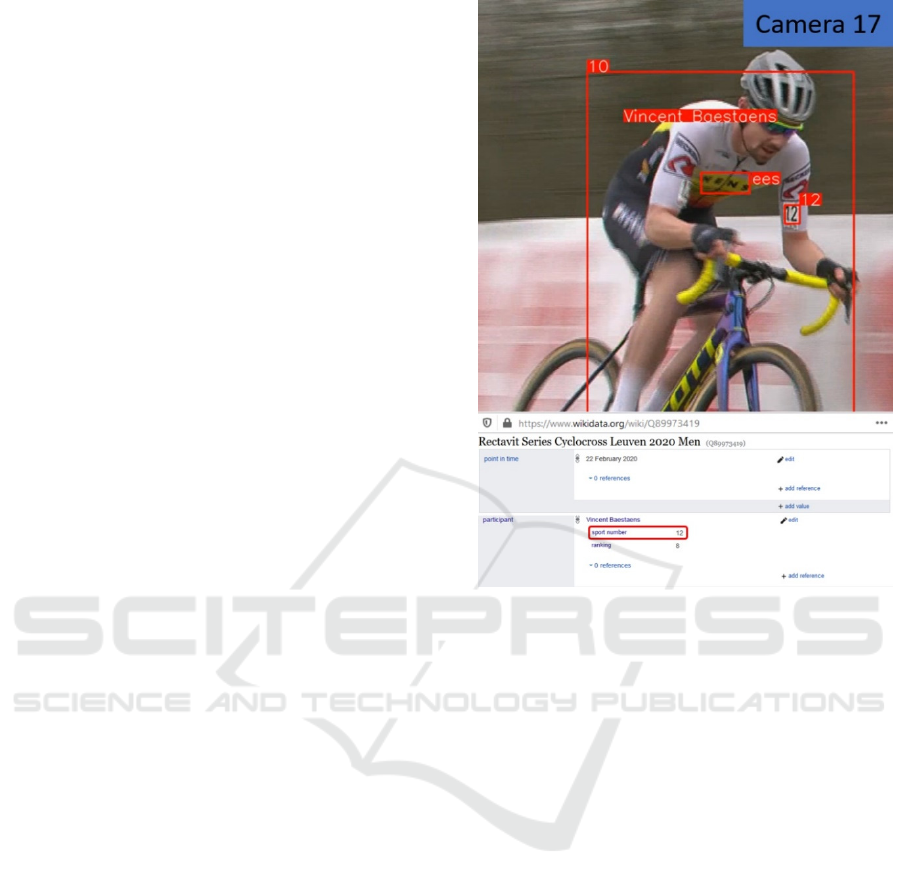
Figure 10: Example of optical character recognition (OCR)
on camera 17 output stream. With the combination of the
detected shoulder number and the participant list added to
the race’s WikiData page the rider was correctly
recognized. In combination with the camera proximity
algorithm this can produce an accurate rider detector and
tracker.
As mentioned, another aspect we’re currently
focussing on is the creation of an intuitive camera
coverage labelling tool for the race directors. Such a
tool should allow them to easily label the locations of
the cameras on the racecourse using a web application
on a wearable device. The tool could do the
conversion process to the GeoJSON standard
automatically, which would be a huge step towards a
fully automated camera proximity algorithm.
As a final note, the proposed methodology of
linking participant location data with camera and
course/playfield information can also be repurposed
in other sports such as cross country skiing (Swarén
et al.) or motorsports. With some adaptations the
proposed methodology can also be used in team
sports such as hockey, rugby or soccer. However,
these type of team sports might benefit from a more
accurate location tracking system such as Ultra Wide
Band (UWB) or Radio-Frequency Identification
(RFID) (Gudmundsson and Horton) position tracking
as GPS accuracy errors and the relatively small
GPS Driven Camera Selection in Cyclocross Races for Automatic Rider Story Generation
73

dimensions of the playgrounds might give false
camera proximity results (Castillo et al.).
ACKNOWLEDGEMENTS
This research is funded by the imec ICON project
DAIQUIRI (Agentschap Innoveren en Ondernemen
project nr. HBC.2019.0053).
REFERENCES
Baek, Y., Lee, B., Han, D., Yun, S., & Lee, H. (2019).
Character region awareness for text detection. In
Proceedings of the IEEE Conference on Computer
Vision and Pattern Recognition (pp. 9365-9374).
Bastida Castillo, A., Gómez Carmona, C. D., De la cruz
sánchez, E., & Pino Ortega, J. (2018). Accuracy, intra-
and inter-unit reliability, and comparison between GPS
and UWB-based position-tracking systems used for
time–motion analyses in soccer. European journal of
sport science, 18(4), 450-457.
Chen, J., Lu, K., Tian, S., & Little, J. (2019, January).
Learning sports camera selection from internet videos.
In 2019 IEEE Winter Conference on Applications of
Computer Vision (WACV) (pp. 1682-1691). IEEE.
Fong, W. T., Ong, S. K., & Nee, A. Y. (2008, September).
A differential GPS carrier phase technique for precision
outdoor AR tracking. In 2008 7th IEEE/ACM
International Symposium on Mixed and Augmented
Reality (pp. 25-28). IEEE.
Garcia, A., Kalva, H., & Furht, B. (2010, October). A study
of transcoding on cloud environments for video content
delivery. In Proceedings of the 2010 ACM multimedia
workshop on Mobile cloud media computing (pp. 13-
18).
Gudmundsson, J., & Horton, M. (2017). Spatio-temporal
analysis of team sports. ACM Computing Surveys
(CSUR), 50(2), 1-34.
Hess, B., Farahani, A. Z., Tschirschnitz, F., & von
Reischach, F. (2012, November). Evaluation of fine-
granular GPS tracking on smartphones. In Proceedings
of the First ACM SIGSPATIAL International Workshop
on Mobile Geographic Information Systems (pp. 33-
40).
Ingole, P. V., & Nichat, M. M. K. (2013). Landmark based
shortest path detection by using Dijkestra Algorithm
and Haversine Formula. International Journal of
Engineering Research and Applications (IJERA), 3(3),
162-165.
Merry, K., & Bettinger, P. (2019). Smartphone GPS
accuracy study in an urban environment. PloS one,
14(7), e0219890. https://doi.org/10.1371/journal.
pone.0219890
Nag, S., Ramachandra, R., Shivakumara, P., Pal, U., Lu, T.,
& Kankanhalli, M. (2019, September). CRNN Based
Jersey-Bib Number/Text Recognition in Sports and
Marathon Images. In 2019 International Conference on
Document Analysis and Recognition (ICDAR) (pp.
1149-1156). IEEE.
SPOT (n.d.). About Spot. Retrieved on May 13, 2020 from
https://www.findmespot.com/en-us/about-
spot/company-info
Shen, C., Zhang, C., & Fels, S. (2007, September). A multi-
camera surveillance system that estimates quality-of-
view measurement. In 2007 IEEE International
Conference on Image Processing (Vol. 3, pp. III-193).
IEEE.
Swarén, M., Stöggl, T., Supej, M., & Eriksson, A. (2016).
Usage and validation of a tracking system to monitor
position and velocity during cross-country skiing.
International Journal of Performance Analysis in
Sport
, 16(2), 769-785.
Quarq Qollector. (2015). quarq-qollector. Retrieved on May
13, 2020 from https://prod.quarq.com/product/quarq-
qollector/
Westra, E. (2010). Python geospatial development. Packt
Publishing Ltd.
Xue, Y., Song, Y., Li, C., Chiang, A., & Ning, X. (2017).
Automatic Video Annotation System for Archival
Sports Video. 2017 IEEE Winter Applications of
Computer Vision Workshops (WACVW), 23-28.
icSPORTS 2020 - 8th International Conference on Sport Sciences Research and Technology Support
74
