
Using IoT Platform for 360-Degree Video User Logging and Analysis
Antti Luoto
a
, Kari Syst
¨
a
b
, Otto Hylli and Ville Heikkil
¨
a
Computing Sciences, Tampere University, Korkeakoulunkatu 1, Tampere, Finland
Keywords:
FIWARE, 360-Degree Video, IoT, MQTT, User Data Visualization.
Abstract:
Smart cities are getting more and more attention due to urbanization and IoT trends. At the same time, 360-
degree videos are also getting more popular. The watchers of 360-degree videos provide a data source that
fit to the data collection aim of smart cities. This paper explores how well 360-degree video user data can
be collected, using MQTT as a data transfer protocol, and analyzed with an open source IoT platform. The
results suggest that using MQTT with the chosen IoT platform is convenient and general chart visualizations
can provide useful insight about 360-degree video watchers. The used research method is design science.
1 INTRODUCTION
The amount of people living in urban areas is ex-
pected to grow in the near future. This growth can
lead to a variety of problems (Nam and Pardo, 2011).
Smart city is a concept that offers a partial solu-
tion. Smart city has multiple definitions (Nam and
Pardo, 2011), out of which, we can use one that sees
the smart city as a combination of technologies that
make the critical infrastructure components and ser-
vices of a city more intelligent, interconnected and
efficient (Washburn et al., 2009).
Smart cities have an interconnection with Internet
of Things (IoT) (Su et al., 2011). The idea of IoT is
that objects can be embedded with sensors that can
be connected to cloud technologies via Internet. In
smart city context, it means that city infrastructure can
be equipped with sensors collecting data from various
domains and sending the data to data collection plat-
forms via Internet. Thus, the technologies that enable
IoT also support smart cities.
Unfortunately, IoT suffers from a diverse set
of initiatives, standards and implementations (Fersi,
2015) (Araujo et al., 2019). However, the recent in-
terest in smart cities has motivated the development
of IoT platforms that provide scalability, reliability,
sustainability and security. One of such platforms is
FIWARE. It is a framework of open source compo-
nents to help the development of smart solutions (fi-
ware.org, 2020b). We used FIWARE because it pro-
vides a number of reusable building blocks and it is
a
https://orcid.org/0000-0002-9318-7665
b
https://orcid.org/0000-0001-7371-0773
present in many different sectors in Europe, for ex-
ample, healthcare, telecommunications, environmen-
tal services and agriculture (Rodriguez et al., 2018).
In addition, this study was done in a research project
called CityIoT (CityIoT, 2020). One of the objectives
of the project was to build a smart city IoT piloting
environment for and this study works as one of the
pilots. The project had not used a popular IoT data
transfer protocol called Message Queuing Telemetry
Transport (MQTT) and we thought it would be impor-
tant to experiment with it.
360-degree video watchers provide an interesting
data source for experimenting with an IoT platform
in a smart city context. 360-degree videos are rela-
tively popular nowadays (Qian et al., 2016) and they
have applications in multiple smart city related do-
mains such as surveillance, remote working, robotics,
traffic, etc. 360-degree videos can be watched with
smart phones that contain various sensors for collect-
ing data.
An example benefit of 360-degree video watcher
analysis in a smart city is that it is possible to analyze
where video watchers focus their attention in traffic or
near tourist attraction. By analyzing video watchers,
it is possible, for example, to place advertisements so
that they are often seen.
For analyzing 360-degree video watchers, it is
important to log their view orientation since only a
cropped view port of the video can be seen at a time.
It is clear that lots of view orientation data can be
collected from the users from a constantly updating
video. However, what is not clear, is that how the
data collection can be implemented with FIWARE
Luoto, A., Systä, K., Hylli, O. and Heikkilä, V.
Using IoT Platform for 360-Degree Video User Logging and Analysis.
DOI: 10.5220/0010015600410050
In Proceedings of the 16th International Conference on Web Information Systems and Technologies (WEBIST 2020), pages 41-50
ISBN: 978-989-758-478-7
Copyright
c
2020 by SCITEPRESS – Science and Technology Publications, Lda. All rights reserved
41

and MQTT, and how well general visualizations, such
as two-dimensional charts provided by open source
dashboard tool Grafana, support visualizing and ana-
lyzing view orientation data.
Thus, our research questions are the following.
(1) How to use an IoT platform for collecting 360-
degree video watching logs via MQTT? (2) What are
the pros and cons of using a combination of an IoT
platform and a general dashboard tool for visualizing
360-degree video watching logs?
In short, the experiment was successful. We were
able to collect 360-degree video watching data from a
smart phone to an IoT platform using MQTT and then
use Grafana for creating useful visualization.
2 BACKGROUND
The most important data gathered from users is the ro-
tation of their device while playing 360-degree video.
Yaw, pitch and roll format is one way of presenting
rotations in a spherical space. Yaw is the vertical ro-
tation, pitch is the horizontal rotation, and roll is the
rotation around front-to-back axis. We use that for-
mat as well but without roll. The main reason for that
is that the API of Google VR SDK used by our smart
phone application does not provide the roll angle.
One challenge with 360-degree video watcher log-
ging is that the view orientation changes constantly
when the user moves, turns, etc. If the view orienta-
tion is recorded for every frame in a 23 FPS video,
a set of values is collected every 43th millisecond.
Some back ends might suffer from such a fast pace
if there are multiple users being logged simultane-
ously. Therefore, a trade-off decision must be made
between the precision and the amount of data. For
example, some other 360-degree video user logging
studies have had a sampling rate of 7-10 Hz (Bao
et al., 2016) (Nasrabadi et al., 2017). So, meaning-
ful 360-degree video user analysis should be possible
even if the view orientation is not recorded for every
frame. We decided to experiment with a sampling rate
of about two times a second. We were able to see nice
results already with our 2-Hz pace and there should
not be challenges in increasing the sampling rate for a
small number of simultaneous users. Naturally, some
accuracy is lost but the analysis is already inaccu-
rate since the gaze orientation is not considered. If
a faster sampling rate is needed and the performance
suffers, the performance of FIWARE can be improved
by scaling (Araujo et al., 2019).
It is possible to make expressive visualizations of
360-degree video watching logs on top of 360-degree
video applications but implementing such visualiza-
tions can require writing custom source code (Luoto,
2019). Thus, it is beneficial to find out what can be vi-
sualized with general graphs, charts, etc. provided by
web-based dashboard tools. What is lost in usefulness
can be made up in the easiness of implementation.
MQTT is a lightweight publish-subscribe data
transfer protocol aimed for constrained devices.
While MQTT is mainly used to send data from low-
resource IoT sensors to (edge) gateways, it can be
used with smart phones as well, especially when a lot
of small data packets are sent, request-response is not
needed, and there can be multiple simultaneous data
sources. MQTT is among the most popular IoT pro-
tocols (Skerrett, 2016). MQTT has potential for send-
ing 360-degree video user data from a smart phone to
an IoT platform. MQTT works via cellular or Wi-Fi
connections.
3 RELATED WORK
We are not aware of studies where 360-degree video
watching data that would have been collected or ana-
lyzed with IoT platforms. Neither, we are not aware
of IoT platforms being used for traditional video user
analysis. In general, there is a relatively small amount
of research literature about user logging and analysis
architectures in 360-degree video domain available.
There are some publications that connect IoT and
360-degree videos, such as, a study about using 360-
degree videos for teaching IoT security (Okada et al.,
2019). In another study, the combination of IoT in-
frastructure including 360-degree videos is used to
generate VR spaces (You et al., 2018). However,
these studies do not use IoT platform to collect or an-
alyze video user orientation data.
3.1 Traditional Video and Smart City
There are clearly research efforts in using traditional
videos (i.e non-360-degree videos) with smart cities.
However, it seems that there is not a strong explicit
connection between 360-degree videos and smart
cities in the research literature. For example, in a
systematic mapping review about big data in smart
cities (Brohi et al., 2018), there is only one paper out
of 65 that has word ’video’ in its title. However, it
is possible that some of the papers included in the re-
view do discuss using videos with smart cities despite
not having the word ’video’ in title. Especially, 360-
degree videos are not mentioned at all in the review.
That particular paper with word ’video’ presents
a study about real-time video processing for traffic
control in a smart city context using Hadoop with
WEBIST 2020 - 16th International Conference on Web Information Systems and Technologies
42

GPUs (Rathore et al., 2018). In contrast to our work,
they study video processing whereas we concentrate
on user analysis. There are also other video process-
ing studies for traffic management in a smart city con-
text such as a study about vehicle counting for smart
cities (Trivedi et al., 2018) and a study about auto-
mated pedestrian data collection (Sayed et al., 2016).
3.2 360-Degree Content and Smart City
Neither does a survey on 360-degree video stream-
ing emphasize smart cities (Fan et al., 2019). How-
ever, they have included a study that discusses ob-
ject tracking application that would, according to
Fan et al., have use in various smart city applica-
tions (Delforouzi and Grzegorzek, 2017). Again, that
study is on the field of video processing rather than on
the field of video watcher analysis.
A study that explicitly discusses smart cities
provides analysis of panoramic images (instead of
panoramic videos) (Feriozzi et al., 2019). An example
of relatively rare study, that explicitly connects 360-
degree videos with smart cities, presents real-time an-
notation of 360-degree videos (Tang et al., 2018). The
authors plan to extend their work by using it in a smart
city context. Once again, their work is about video
processing and not about video user analysis.
3.3 User Logging and Analysis
There are some 360-degree video watcher logging
and analysis studies available. For the most part, their
aim is not in multi-user logging, smart city context,
nor making interactive web-based dashboards.
There are a few studies that offer a public 360-
degree video user logging data. In the first one, the
authors use an architecture primarily for local logging
and they use the logs for creating saliency and motion
maps (Lo et al., 2017). In the second one, the authors
used the logs to create example statistics for analyz-
ing users’ navigation patterns (Corbillon et al., 2017).
In the third one, the authors present preliminary anal-
ysis of their data set by presenting visualizations such
as plotting gaze data over video, density maps, and
gazing directions in a 3D graph (Wu et al., 2017). 3D
graphs should be possible with a Grafana plugin, but
we concentrated on 2D graphs.
Another study predicted head orientation with
weighted linear regression (Qian et al., 2016). Such
advanced analysis could be very difficult (or impos-
sible) with our dashboards made with simple SQL
queries. A study about 360-degree video streaming
in 5G networks presents two 360-degree video user
traces on a timeline (Sun et al., 2018), but the study
does not concentrate on producing visualizations.
View Similarity visualization, which shows the
angular proximity of all 360-degree video viewers’
viewing directions over time, helps to quickly analyze
attentional synchrony (L
¨
owe et al., 2015). Such visu-
alization would definitely be useful but making one
would be difficult with our toolbox.
An exceptional study presents a platform for log-
ging interaction in 360-degree multimedia (Bibiloni
et al., 2018). In addition to logging view orientation,
the authors log interactions such as pressing play or
pause. They exceptionally discuss the logging and vi-
sualization architecture in detail and have a dashboard
with web support. They present, for example, user ac-
tivities on a timeline and view orientation histograms.
3.4 FIWARE, MQTT, and Grafana
There is some research on the performance of FI-
WARE available. In an extensive performance eval-
uation of FIWARE, the authors aimed to a real smart
city scale with their testbed that can send data via
MQTT (Araujo et al., 2019). Their conclusions in-
clude that FIWARE’s IoT Agents do not scale well
due to Node.js implementation. This could be a prob-
lem in a real-life use case, but in our experiments with
only a few users, we did not encounter performance
issues. Another FIWARE study includes performance
evaluations of IoT components in an agricultural do-
main (Mart
´
ınez et al., 2016).
In 360-degree video context, Grafana has been
used at least for monitoring tile-based stream-
ing (Tagami et al., 2019), and potentially for mon-
itoring 5G network while streaming 360-degree
video (Kanstr
´
en et al., 2018).
4 METHODOLOGY
The research was conducted by following design sci-
ence methodology. It is a research method used in
software engineering (Vaishnavi and Kuechler, 2004)
that includes six steps: problem identification and mo-
tivation, definition of the objectives for a solution, de-
sign and development, demonstration, evaluation and
communication (Peffers et al., 2007).
We include the steps of design science in this pub-
lication as follows. Problem identification and mo-
tivation is presented in Sections 1-3 but it is sum-
marized here: the problem is that 360-degree video
watchers could provide useful data in smart city con-
text but logging and analyzing users requires infras-
tructure. We think that usage of IoT infrastructure and
Using IoT Platform for 360-Degree Video User Logging and Analysis
43

Figure 1: How MQTT integrates with FIWARE platform.
techniques, such as, IoT platform FIWARE, MQTT,
and visualization tool Grafana can provide a promis-
ing solution for the data collection and analysis needs.
The essential parts of design and development are pre-
sented in Section 4. Demonstration is included in
Section 5 by presenting the produced visualizations.
Evaluation is included in Sections 5-6 by stating the
essential pros and cons of the approach, and Commu-
nication is covered by writing the publication and the
presenting the work to a scientific audience. Lastly,
to define the objectives for a solution, our objective
is to use FIWARE so that 360-degree video user log
transferred via MQTT can be visualized with Grafana
conveniently.
4.1 Architecture Overview
We used FIWARE platform as the tool for providing
communication interfaces, storing data, and creating
visualizations. An overview of the architecture can be
seen in Figure 1. The idea is that smart phones send
data to MQTT broker which delivers the data to IoT
Agent in FIWARE platform. That data is then stored
to a database and used for creating visualizations.
4.2 FIWARE
FIWARE is a framework of open source components
to accelerate the development of smart solutions (fi-
ware.org, 2020b). Orion Context Broker is a core
component of the system. It enables the system to
perform updates and access the data via FIWARE
Next Generation Service Interface version 2 (NG-
SIv2) API. The Context Broker is surrounded by a
set of additional components which may be gathering
data from diverse sources, such as mobile applications
or IoT sensors, help with data processing, analysis,
and visualization of data.
4.3 IoT Agent
Among the mentioned ’additional components’, FI-
WARE provides components called IoT Agents. “An
IoT Agent is a component that lets groups of devices
send their data to and be managed from a FIWARE
NGSI Context Broker using their own native proto-
cols” (fiware.org, 2020a). There are a few IoT Agents
that support MQTT. We decided to use IoT Agent for
Ultralight since it seemed easy to try Ultralight format
with our simple log data. IoT Agent for Ultralight is
a bridge that can be used for communication between
the devices using Ultralight 2.0 protocol and NGSI
Context Brokers (fiware.org, 2019).
Ultralight 2.0 is a lightweight text-based protocol
aimed to constrained devices. It is used by sensor de-
vices to send data to IoT platform. Ultralight 2.0 does
not order the use of communication protocol, only the
format the of the payload. The payload follows the
format of the example: “a|1|b|2”, which includes val-
ues for two attributes: value 1 for attribute a and value
2 for attribute b. When compared to JSON, the for-
mat makes a shorter payload which helps saving re-
sources. The usage of Ultralight was not very essen-
tial in this experiment. The format is just explained
here to clarify a few things later.
After installing IoT Agent, the following steps are
required for setting up devices communicating via
MQTT (fiware.org, 2020c). Figure 2 summarizes the
steps.
1. Provisioning a Service Group. The idea of ’ser-
vice group’ is to create a top level MQTT topic for a
group of devices related to the same service. A ser-
vice group is provisioned by making an HTTP POST
to Service API of IoT Agent (Telefonica IoT, nd). The
request payload defines the base MQTT topic for a
group of devices that form a service.
2. Provisioning a Device: HTTP POST which con-
tains information about a new device. In our case, ’de-
vice’ is a vague concept meaning that any entity can
be a ’device’. For example, the ’devices’ we provision
are 360-degree videos, and view orientations in a view
session of a 360-degree video. While ’view orienta-
tion’ is not a real device, it constains sensor measure-
ments. Here is an example of HTTP POST made with
curl that adds an entity for 360-degree video view ori-
entation:
curl -iX POST ’http://<host>/iot/devices’ \
-H ’Content-Type: application/json’ \
-H ’fiware-service: 360video’ \
-H ’fiware-servicepath: /’ \
-d ’{ "devices": [
{
"device_id":
"viewOrientationInViewSession001",
WEBIST 2020 - 16th International Conference on Web Information Systems and Technologies
44
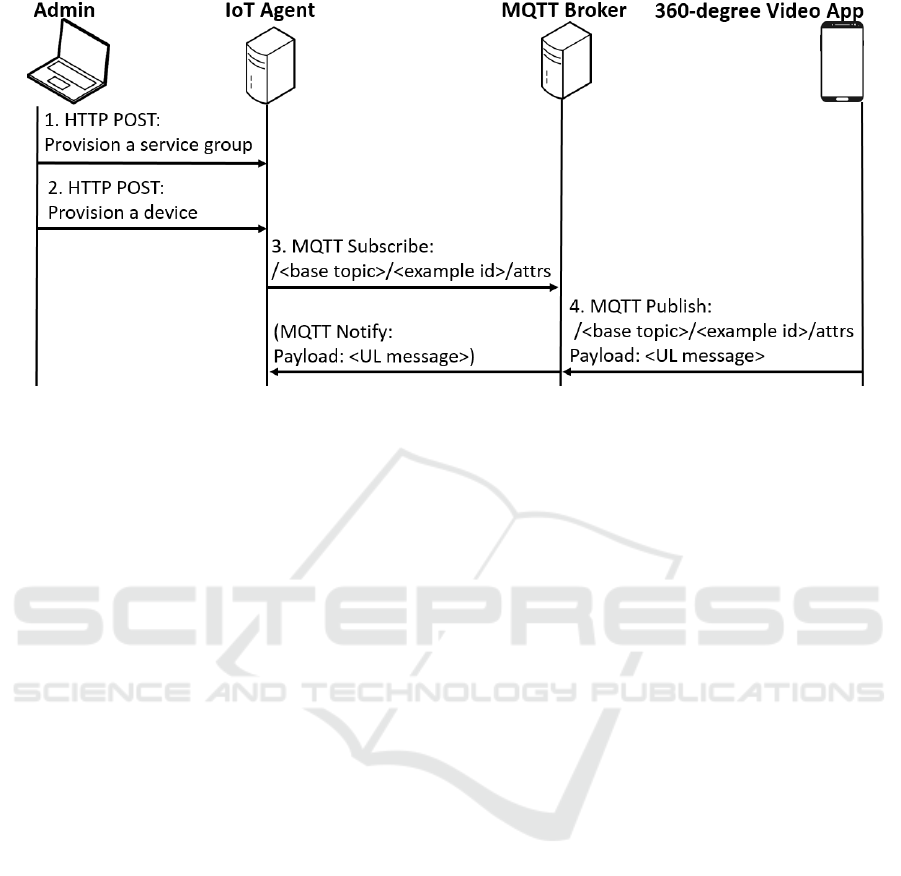
Figure 2: The steps for setting up devices communicating via MQTT.
"entity_type": "Device",
"transport": "MQTT",
"attributes": [
{
"object_id": "y",
"name": "yaw",
"type": "Integer" },
{
"object_id": "p",
"name": "pitch",
"type": "Integer" },
{
"object_id": "t",
"name": "videoTime",
"type": "Integer" } ],
"static_attributes": [
{ "name":"ref360Video",
"type": "Relationship",
"value": "360VideoExample" } ]
} ] } ’
IoT Agent HTTP API is described in (Telefonica
IoT, nd). The ’device’ resource (<host>/iot/devices)
is used to publish data to context broker via IoT
Agent. There are two mandatory HTTP headers:
fiware-service and fiware-servicepath. FIWARE ser-
vice is a multi-tenancy feature which ensures that en-
tities, attributes and subscriptions inside one service
are invisible to other services (fiware.org, 2018a).
Service path is a hierarchical scope where entities can
be divided to hierarchies (fiware.org, 2018b). We did
not use service paths as they only work with HTTP
and we used on MQTT. The actual data is sent as
a JSON object that has an attribute named ’devices’
which contains a list of devices to be provisioned.
3. MQTT Subscription: setting the value ’MQTT’
for the attribute ’transport’ is enough for the IoT
Agent to subscribe to the service group base topic
(made in step 1) extended with the device id, for
example, /<base topic>/<device-id> (fiware.org,
2020c). The ’attributes’ list contains attributes that
are active readings from the device. It has also a map-
ping from abbreviated Ultralight 2.0 attributes to ac-
tual entity attributes. For example, an entity attribute
named ‘yaw’ can be mapped to ’y’. Static attributes
can be also defined. The idea of those is that their
values cannot be changed via the chosen IoT protocol
and they are initialized in the provisioning phase. In
our example, we add only one static attribute that is a
reference to the video being watched.
4. MQTT Message: attributes of the added entity
can be updated with an MQTT message. For ex-
ample, the view orientation entity can be updated by
publishing a message to the base topic that is cate-
nated with a device id and ‘/attrs’ string, for exam-
ple, /<base topic>/ExampleId/attrs. The payload of
the message follows the Ultralight 2.0 format, for ex-
ample, ”y|15.05 |p|0.50|t|1234” where yaw is 15.05
degrees, pitch is 0.50 degrees and videoTime is 1234
milliseconds of video time.
4.4 Smart Phone Application
The smart phone application uses Google VR SDK
for Android. It has a 360-degree video player with
basic controls. Figure 3 presents an example view
on the application. The application sends event-based
measurements to FIWARE, in other words, it does not
send only updated values.
Using IoT Platform for 360-Degree Video User Logging and Analysis
45
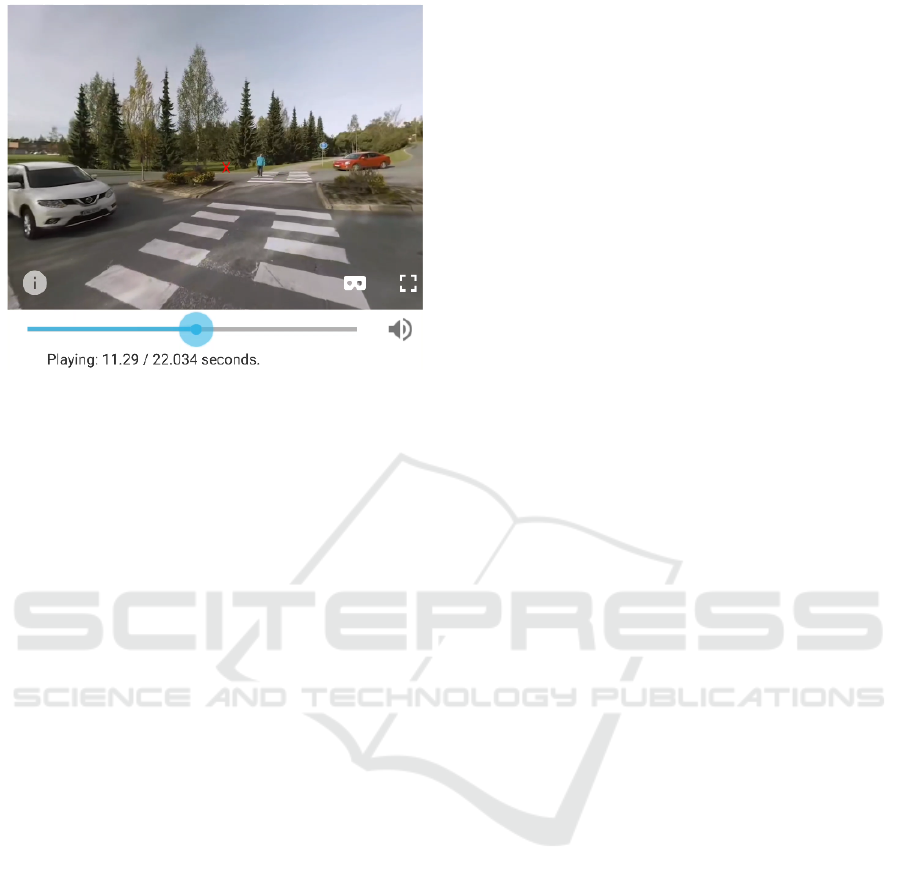
Figure 3: Screenshot of the smart phone application.
4.5 Visualization
Grafana is an open source visualization dashboard
platform for multiple databases. We used version
6.5.3. The default graph visualization provided by
Grafana is not conventional for visualizing user traces
of non-streaming videos since the charts require hav-
ing real-world timestamps on X axis. Luckily, a
Grafana plugin named Plotly allows using any data
on X axis which allows setting video time on X axis.
4.6 Database
By default, FIWARE’s Orion Context Broker uses
MongoDB and stores only the latest value of the at-
tribute. That is not conventional for time-based anal-
ysis. Luckily, FIWARE component QuantumLeap of-
fers a database that can be used to store data as time
series data that can be visualized with Grafana. The
data is not automatically copied from Orion to Quan-
tumLeap unless there is a subscription for that. Thus,
we made a subscription to Orion using the /notify
endpoint of the QuantumLeap API.
5 RESULTS
This section discusses the three Grafana visualiza-
tions, ’Graph’, ’Plotly’, and ’Table’, and other related
features that were used. We present the visualizations
we made and remark other observations and experi-
ences gathered while using the visualization tool, and
the IoT platform in general. The data in the visual-
izations is a result of an SQL query that is written
individually for each visualization via Grafana UI.
5.1 Graph
The graph visualization is a general-purpose tool for
visualizing data on timeline. FIWARE automatically
generates a timestamp for logged data records which
helps making timelines. However, timeline charts do
not allow using other than real-world timestamp data
on X axis. That makes analyzing user data of non-
streaming videos difficult since the video time is of-
ten more important than the moment of time when
the video was being watched. On the other hand, for
streaming videos real-world timestamps can be useful
because streaming fits better in real-world time.
Graph tool also provides histograms which can
show counted data. In 360-degree video user analysis,
this feature can be used, for example, to see which are
the most watched seconds of the video as presented in
Figure 4. It is a clear and quick visualization that can
be used, for example, for analyzing which parts of
the video people consider interesting. For example,
in Figure 4 more people have watched the start of the
video than the end of the video.
5.2 Plotly
Plotly plugin is not installed by default in Grafana.
Plotly allows using any data on X axis which makes
it useful for making visualizations that are not depen-
dent on real-world time.
Figure 5 presents a Plotly visualization that shows
all the recorded view orientations within a single
video. On X axis there is video time in milliseconds,
and both the yaw and pitch are on Y axis in degrees.
Those measurements were selected because they pro-
vide the device orientation at the certain moment in
video time. With the visualization, it is possible to
get an overall impression where multiple users have
watched during video playback. Thus, it is possible
to see, for example, that most users have watched to
yaw direction 0 between -50 degrees at the video time
of 10 seconds.
Figure 6 presents a visualization of a single-user
view session trace. Similarly to visualization pre-
sented in Figure 5, it contains video time on X axis,
and both the yaw and pitch on Y axis. The wanted
view session can be selected using a drop-down menu
on top of the dashboard. The visualization also shows
that our two Hz sampling rate can be enough for ana-
lyzing a single user at least in some situations. When
compared to multi-user visualization in Figure 5, a
single-user visualization is clearer and helps concen-
trating on an interesting user.
Plotly supports showing additional information
about the data point with a hover tooltip. Only one
WEBIST 2020 - 16th International Conference on Web Information Systems and Technologies
46
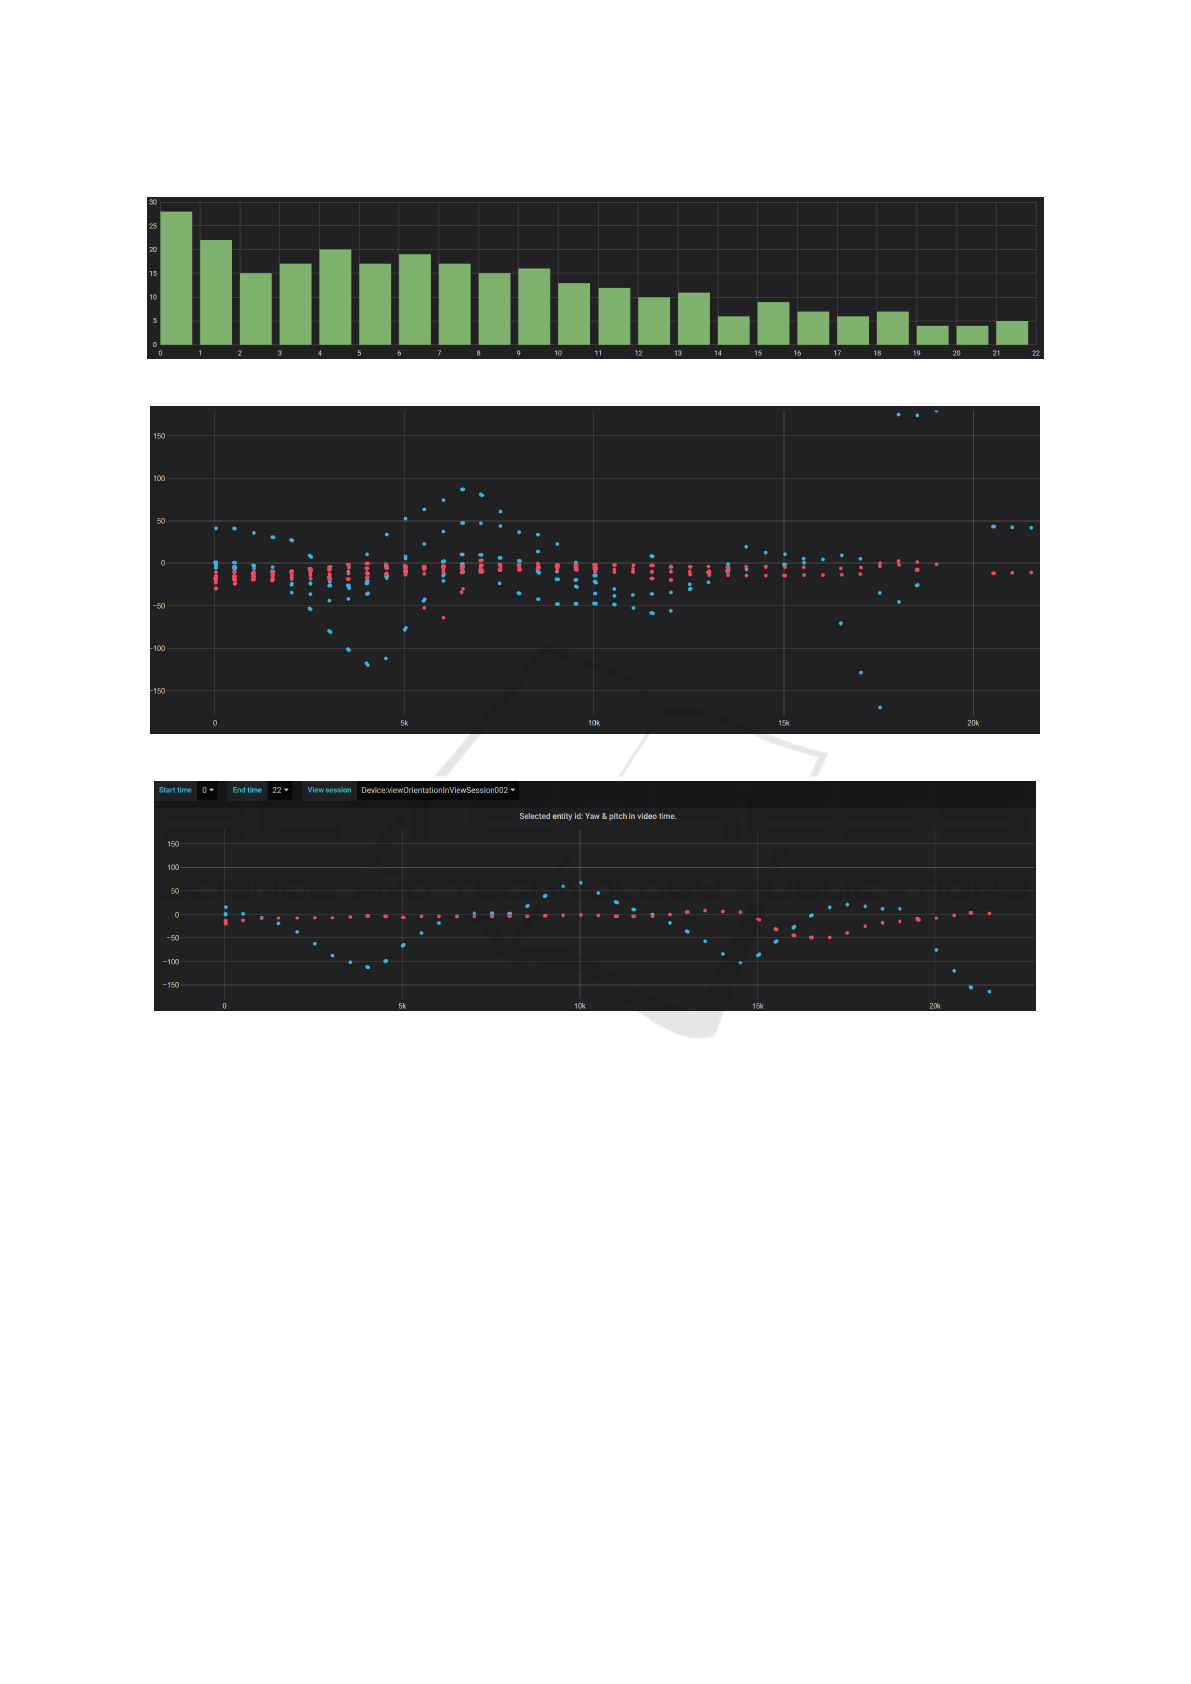
Figure 4: Most watched seconds of the video.
Figure 5: All the data from all the view sessions for a single video. Blue is for yaw and red is for pitch.
Figure 6: Selected view session.
field for additional information is available, so adding
more information to the tooltip requires using string
functions, such as concat, in SQL query.
5.3 Table
Table visualization provides a way a see data in a ba-
sic tabular format. The pros include a detailed view
on the raw data and a way to choose and organize
columns freely. However, it is not a good tool for
getting an overall picture.
5.4 Drop-down Menu
Grafana allows creating a drop-down menus for mak-
ing more dynamic graphs. A chosen value is then
used in SQL queries that generate the graphs. Drop-
down menus can be seen in top of Figure 6. The Fig-
ure has three drop-down menus: Start time, End time,
and View session.
As an example, to make a drop-down menu, we
defined a variable called VideoStartTime that can be
used to adjust the video start time:
SELECT videoTime / 1000
FROM mt360video.etdevice
ORDER BY 1
The query is explained in detail in the following.
SELECT: videoTime is divided by 1000 to convert
it to seconds because using milliseconds in a drop-
down menu would be inconvenient, FROM: Quan-
tumLeap makes a table for every FIWARE service
and entity type pair where the used table name is
Using IoT Platform for 360-Degree Video User Logging and Analysis
47

mt<fiware service>.et<entity type>, and ORDER
BY: the result needs to be ordered to be user friendly
in a drop-down menu.
The variable can then be used in SQL queries for
the graphs in the following way:
SELECT yaw, pitch, videoTime, entity_Id
FROM mt360video.etdevice
WHERE entity_Id = ’$entity_Id’
AND videoTime BETWEEN ’$VideoStartTime’ * 1000
AND ’$VideoEndTime’ * 1000
The variables are used in the queries by adding a
dollar sign to the beginning of the variable name and
wrapping the string with single quotation marks. The
variables for video start and end times need to be mul-
tiplied by 1000 to convert seconds back to millisec-
onds. The resulting visualization, with video time set
between 0 to 22 seconds, can be seen in Figure 6.
5.5 Pros and Cons
To answer the second research question and to gen-
eralize the results, we ponder what are the pros and
cons of using a general purpose IoT platform and a
dashboard tool for storing and analyzing 360-degree
video user data. By no means using an IoT platform
for the described case is necessary. However, using
one is meaningful considering the following pros:
General Building Blocks and General Workflow:
it is possible to add different kind of devices and
send diverse data for storage using the same work-
flow. Once installed, a general purpose IoT platform
can be used for various use cases.
High Abstraction Level: APIs help with abstraction
and many operations are automated – developers do
not need to worry about details, such as the database
solution. For example, IoT Agent of FIWARE pro-
vides an useful API for provisioning devices.
MQTT Support: since MQTT is an important IoT
protocol, it is expected to be supported by IoT plat-
forms. For example, FIWARE supports MQTT via
IoT Agent.
General Visualizations: since it is a common prac-
tice to visualize IoT data with dashboards, IoT plat-
forms often offer a general visualization tool. Ac-
cording to our experiments, a general web-based vi-
sualization tool can provide an easy way for creating
useful 360-degree video user log visualizations.
Naturally there are also cons in using an IoT plat-
form for 360-degree video user analysis. We were
able to cope with all of them, but the cons include:
Installation, Maintenance, etc.: lots of work can be
required for setting up and maintaining an IoT plat-
form. However, this work can be outsourced and
reused at least to some extent.
Complexity: using a whole IoT platform for log-
ging and visualization naturally increases complexity
of the system. Taking FIWARE as an example, while
much of the complexity is located under the hood and
many details of the FIWARE core components are not
important in the context of this publication, knowl-
edge of the whole system is important, for example,
for debugging.
Lack of Specialized Visualizations: 360-degree
video user logs are a special case of visualization
where, for example, having the video and visualiza-
tion overlapping or placed next to each other could be
useful, but having such a special visualization out-of-
the-box cannot be expected from a general IoT plat-
form.
Defects: IoT platforms can have defects. Using FI-
WARE as an example, we experienced that the used
IoT Agent assumes that new entities are devices. It is
conceptually confusing when adding entities that are
not clear devices. Further, FIWARE provides ready-
made data models which can help in many use cases
(Smart Cities, Smart Agrifood, Smart Environment,
Smart Energy, etc.), but we did not find a useful data
model for our data. We also observed some errors in
the documentation of FIWARE.
Poor UI: when using general components, UI is not
necessarily optimized for special use cases. For ex-
ample, visualizations can get messy if there are over-
lapping traces, similarly to Figure 5. Drop-down
menus can be used for limiting the shown data in
Grafana, but a more user-friendly way, for example,
by selecting a trace with a mouse, would be nice.
6 DISCUSSION
We mostly concentrated on using the IoT Agent
with MQTT and making visualizations with Grafana.
However, there are other aspects to be taken into ac-
count when creating an implementation for public
use. The functionality described in this publication
can be naturally implemented without an IoT plat-
form, but our research interests were aimed at what
are the benefits of using general IoT infrastructure.
We used only a single 22-seconds video. For
longer videos UX will need to be considered better.
E.g., a drop-down menu for every second in video that
is five minutes long would be an annoying to use. Fur-
ther, we did not see the difficulties of visualizing mul-
tiple videos making comparisons between two videos.
One might argue that using MQTT and Ultralight,
that are meant for constrained devices, is not con-
venient with modern smart phones that do not lack
memory. However, we wanted to try the MQTT sup-
WEBIST 2020 - 16th International Conference on Web Information Systems and Technologies
48

port of FIWARE, and 360-degree video user logging
provides a domain that produces data that goes well
with IoT. Since the amount of data is expected to grow
in the future, it is good to prepare by using lightweight
technologies. In addition, the low memory and CPU
footprint of MQTT helps saving batteries.
Further, one might argue that IoT communication
systems are designed to transport data from a vast
amount of distributed sensors. That is true, and in
a future smart city there is a vast amount of sensors,
and the 360-degree user data provided by smart phone
sensors is just a small subset. Probably it is not mean-
ingful to set up an IoT platform just for one use case,
but the platform should be used for many use cases
collecting data from various domains.
7 CONCLUSIONS & FUTURE
WORK
The experiment was successful, using MQTT with FI-
WARE platform was relatively easy, and making visu-
alizations with Grafana was practical. We managed to
implement many useful 360-degree video watcher log
visualizations with a relatively low effort. The biggest
challenges were related to some inconsistencies with
FIWARE documentation when performing the steps
of setting up MQTT communication.
The 360-degree videos are often divided to tiles,
for example, to deliver only the needed parts of the
video in high-quality. Tiles can be used in user anal-
ysis as well. It can be enough to know which tiles are
seen by the user instead of the exact yaw and pitch ori-
entation. Integrating object detection algorithms for
360-degree video content analysis would be interest-
ing as well.
While we mostly discuss non-streaming videos,
the used approach could be more useful with stream-
ing videos since many smart city applications require
streaming video. Using alerts in Grafana could be
useful for automating parts of the analysis.
Smart cities are more efficient when smart objects
and applications operate without human intervention.
However, there are situations where a human is re-
quired to make decisions with the help of collected
data. Visualizations help with such decisions and
are a steppingstone on the way towards autonomous
smart city.
REFERENCES
Araujo, V., Mitra, K., Saguna, S., and
˚
Ahlund, C. (2019).
Performance evaluation of fiware: A cloud-based iot
platform for smart cities. Journal of Parallel and Dis-
tributed Computing, 132:250–261.
Bao, Y., Wu, H., Zhang, T., Ramli, A. A., and Liu, X.
(2016). Shooting a moving target: Motion-prediction-
based transmission for 360-degree videos. In 2016
IEEE International Conference on Big Data (Big
Data), pages 1161–1170. IEEE.
Bibiloni, T., Oliver, A., and del Molino, J. (2018). Auto-
matic collection of user behavior in 360 multimedia.
Multimedia Tools and Applications, 77(16):20597–
20614.
Brohi, S. N., Bamiah, M., and Brohi, M. N. (2018). Big data
in smart cities: a systematic mapping review. Journal
of Engineering Science and Technology, 13(7):2246–
2270.
CityIoT (2020). Cityiot – future operator independent data
integration platform. https://www.cityiot.fi/english
Last accessed: August 12, 2020.
Corbillon, X., De Simone, F., and Simon, G. (2017). 360-
degree video head movement dataset. In Proceedings
of the 8th ACM on Multimedia Systems Conference,
MMSys’17, page 199–204, New York, NY, USA. As-
sociation for Computing Machinery.
Delforouzi, A. and Grzegorzek, M. (2017). Robust and fast
object tracking for challenging 360-degree videos. In
2017 IEEE International Symposium on Multimedia
(ISM), pages 274–277. IEEE.
Fan, C.-L., Lo, W.-C., Pai, Y.-T., and Hsu, C.-H. (2019). A
survey on 360 video streaming: Acquisition, transmis-
sion, and display. ACM Computing Surveys (CSUR),
52(4):1–36.
Feriozzi, R., Meschini, A., Rossi, D., and Sicuranza, F.
(2019). Virtual tours for smart cities: A comparative
photogrammetric approach for locating hot-spots in
spherical panoramas. ISPRS - International Archives
of the Photogrammetry, Remote Sensing and Spatial
Information Sciences, XLII-2/W9:347–353.
Fersi, G. (2015). Middleware for internet of things: A
study. In 2015 International Conference on Dis-
tributed Computing in Sensor Systems, pages 230–
235. IEEE.
fiware.org (2018a). Multi tenancy. https:
//github.com/telefonicaid/fiware-orion/blob/
c59401dcead76a77e28daddbd0e127628b19422d/
doc/manuals/user/multitenancy.md Last accessed:
April 3, 2020.
fiware.org (2018b). Service paths. https:
//github.com/telefonicaid/fiware-orion/blob/
d07ced613432237728c0983e11223a5d68d1e163/
doc/manuals/user/service path.md Last accessed:
April 3, 2020.
fiware.org (2019). Iot agent for the ultralight 2.0 proto-
col. https://github.com/telefonicaid/iotagent-ul/tree/
8557733aaac1a7428f295eec7b74dac8b805e91e Last
accessed: April 3, 2020.
fiware.org (2020a). Fiware iot agent node.js library.
https://github.com/telefonicaid/iotagent-node-lib/
tree/d76d0216f6d2247bcc2131ebbf81c74867afa447
Last accessed: April 3, 2020.
Using IoT Platform for 360-Degree Video User Logging and Analysis
49

fiware.org (2020b). What is fiware. https://www.fiware.org/
about-us/ Last accessed: April 3, 2020.
fiware.org (2020c). What is mqtt? https:
//github.com/FIWARE/tutorials.IoT-over-MQTT/
tree/c1c27aa7d29a388001d62d0c51f2d8df66208123
Last accessed: April 3, 2020.
Kanstr
´
en, T., M
¨
akel
¨
a, J., Uitto, M., Apilo, O., Pouttu, A.,
Liinamaa, O., Destino, G., Kivinen, P., and Mati-
lainen, A. (2018). Vertical use cases in the finnish
5g test network. In 2018 European Conference on
Networks and Communications (EuCNC), pages 329–
334. IEEE.
Lo, W.-C., Fan, C.-L., Lee, J., Huang, C.-Y., Chen, K.-
T., and Hsu, C.-H. (2017). 360-degree video viewing
dataset in head-mounted virtual reality. In Proceed-
ings of the 8th ACM on Multimedia Systems Confer-
ence, pages 211–216. ACM.
L
¨
owe, T., Stengel, M., F
¨
orster, E.-C., Grogorick, S., and
Magnor, M. (2015). Visualization and analysis of head
movement and gaze data for immersive video in head-
mounted displays. In Proceedings of the Workshop
on Eye Tracking and Visualization (ETVIS), volume 1.
Citeseer.
Luoto, A. (2019). Log analysis of 360-degree video users
via mqtt. In Proceedings of the 2019 2nd Interna-
tional Conference on Geoinformatics and Data Anal-
ysis, pages 130–137.
Mart
´
ınez, R., Pastor, J.
´
A.,
´
Alvarez, B., and Iborra, A.
(2016). A testbed to evaluate the fiware-based iot plat-
form in the domain of precision agriculture. Sensors,
16(11):1979.
Nam, T. and Pardo, T. A. (2011). Conceptualizing smart
city with dimensions of technology, people, and insti-
tutions. In Proceedings of the 12th annual interna-
tional digital government research conference: digi-
tal government innovation in challenging times, pages
282–291.
Nasrabadi, A. T., Mahzari, A., Beshay, J. D., and Prakash,
R. (2017). Adaptive 360-degree video streaming us-
ing scalable video coding. In Proceedings of the 25th
ACM international conference on Multimedia, pages
1689–1697.
Okada, Y., Haga, A., Wei, S., Ma, C., Kulshrestha, S., and
Bose, R. (2019). E-learning material development
framework supporting 360vr images/videos based on
linked data for iot security education. In Interna-
tional Conference on Emerging Internetworking, Data
& Web Technologies, pages 148–160. Springer.
Peffers, K., Tuunanen, T., Rothenberger, M. A., and Chat-
terjee, S. (2007). A design science research method-
ology for information systems research. Journal of
management information systems, 24(3):45–77.
Qian, F., Ji, L., Han, B., and Gopalakrishnan, V. (2016). Op-
timizing 360 video delivery over cellular networks. In
Proceedings of the 5th Workshop on All Things Cellu-
lar: Operations, Applications and Challenges, pages
1–6. ACM.
Rathore, M. M., Son, H., Ahmad, A., and Paul, A. (2018).
Real-time video processing for traffic control in smart
city using hadoop ecosystem with gpus. Soft Comput-
ing, 22(5):1533–1544.
Rodriguez, M. A., Cuenca, L., and Ortiz, A. (2018). Fiware
open source standard platform in smart farming-a re-
view. In Working Conference on Virtual Enterprises,
pages 581–589. Springer.
Sayed, T., Zaki, M., and Tageldin, A. (2016). Automated
pedestrians data collection using computer vision. In
Smart City 360, volume 166, pages 31–43.
Skerrett, I. (2016). Iot developer survey 2016. Eclipse IoT
Working Group, IEEE IoT and Agile IoT, pages 1–39.
Su, K., Li, J., and Fu, H. (2011). Smart city and the ap-
plications. In 2011 international conference on elec-
tronics, communications and control (ICECC), pages
1028–1031. IEEE.
Sun, L., Duanmu, F., Liu, Y., Wang, Y., Ye, Y., Shi, H.,
and Dai, D. (2018). Multi-path multi-tier 360-degree
video streaming in 5g networks. In Proceedings of
the 9th ACM Multimedia Systems Conference, pages
162–173.
Tagami, A., Ueda, K., Lukita, R., De Benedetto, J., Aru-
maithurai, M., Rossi, G., Detti, A., and Hasegawa, T.
(2019). Tile-based panoramic live video streaming on
icn. In 2019 IEEE International Conference on Com-
munications Workshops (ICC Workshops), pages 1–6.
IEEE.
Tang, L., Subramony, H., Chen, W., Ha, J., Moustafa, H.,
Sirlapu, T., Deshpande, G., and Kwasniewska, A.
(2018). Edge assisted efficient data annotation for re-
altime video big data. In IECON 2018-44th Annual
Conference of the IEEE Industrial Electronics Soci-
ety, pages 6197–6201. IEEE.
Telefonica IoT (n.d.). Iot agent provision api documenta-
cion. https://telefonicaiotiotagents.docs.apiary.io Last
accessed: April 3, 2020.
Trivedi, J., Devi, M. S., and Dhara, D. (2018). Vehicle
counting module design in small scale for traffic man-
agement in smart city. In 2018 3rd International Con-
ference for Convergence in Technology (I2CT), pages
1–6. IEEE.
Vaishnavi, V. and Kuechler, B. (2004). Design science re-
search in information systems. Association for Infor-
mation Systems.
Washburn, D., Sindhu, U., Balaouras, S., Dines, R. A.,
Hayes, N., and Nelson, L. E. (2009). Helping cios
understand “smart city” initiatives. Growth, 17(2):1–
17.
Wu, C., Tan, Z., Wang, Z., and Yang, S. (2017). A dataset
for exploring user behaviors in vr spherical video
streaming. In Proceedings of the 8th ACM on Mul-
timedia Systems Conference, pages 193–198. ACM.
You, D., Seo, B.-S., Jeong, E., and Kim, D. H. (2018). In-
ternet of things (iot) for seamless virtual reality space:
Challenges and perspectives. IEEE Access, 6:40439–
40449.
WEBIST 2020 - 16th International Conference on Web Information Systems and Technologies
50
