
Anylogic Simulation Research on Passenger Evacuation System of
Urban Transportation Hub
Hui Wang
1, a
, Yue Cui
1, b, *
1
North China Electric Power University, Beijing102206, China
Keywords: Crowd Evacuation; Pedestrian Simulation; Rail Transit.
Abstract: In recent years, the rapid development of rail transit has led to a sharp increase in the number of people, and
there are certain security risks in many important urban transport hubs. This article selects AnyLogic
simulation software that can reflect the characteristics of pedestrian behavior to study how to evacuate the
crowd emergency in the subway station hall. Taking a certain tier city as an example, establish a station model,
simulate it through field survey data, and finally use the pedestrian density in the results to analyze the
problems in crowd evacuation, and optimize the facility layout to propose improvements.
1 INTRODUCTION
People's daily life is inseparable from transportation,
so the safety of traffic has become an increasingly
concerned issue. In recent years, due to the impact of
some major events such as the Olympic Games and
the World Expo, pedestrian simulation has become a
hot field in simulation, which has attracted much
attention at home and abroad. In different scenarios,
the assessment of the accommodation and capacity of
the area improves the planning plan, which plays an
important role in solving the problem of crowd
evacuation in key areas.
At present, many scholars have conducted
research on such issues to varying degrees. Reference
(Zhao Jinlong, et.al, 2020) in order to ensure the
safety of travellers taking the subway, Pathfinder
software is used to model a special subway station in
Beijing to improve the efficiency of response to
emergency events. Reference (Pan Ke, Xiu Shunyan,
2017) simulates the time of crowd evacuation in
different subway stations under different scenarios,
and analyzes the distribution rules of its personnel.
Reference (Deng Yuanyuan, et.al, 2020) proposed an
emergency evacuation scenario, and conducted
simulation experiments on people with different
familiarity and different numbers. Reference (Liu
Zhen, 2019) improves the crowd simulation model
through monitoring analysis and user surveys, and
combines physical technology to describe emergency
evacuation scenarios. Reference (Haibo Lin, et.al,
2020) added new modes in user-defined form by
analyzing and improving the existing simulation
framework, which is important for comparing
different evacuation models. Rreference (Li F, Chen
S, Wang X, et al, 2014) improves there are many
ways to study the problem of crowd evacuation.
Reference (Lei Hou, et.al, 2014) added an influence
model with leadership effect to solve the current
evacuation problem. Reference (Weiliang Zeng, et.al,
2014) introduces how to apply social force model in
pedestrian behavior analysis of pedestrian crossing.
Therefore, this article will use the interaction of
crowd organization, a complex dynamic system, and
a transportation hub as a carrier, consider the
particularity of the existence of a large urban
transportation hub, and take a large crowded subway
station in a city as an example to build a dynamic
model in the subway station. To provide a theoretical
basis and analytical means for solving the problem of
crowd evacuation in crowded places.
2 ANALYSIS OF THE
COMPLEXITY OF CROWD
BEHAVIOR IN URBAN
TRANSPORTATION HUB
In densely populated cities, there are a wide range of
transportation options. However, due to the
advantages of time guarantee, low price and good
Wang, H. and Cui, Y.
Anylogic Simulation Research on Passenger Evacuation System of Urban Transportation Hub.
DOI: 10.5220/0010002800050011
In Proceedings of the International Symposium on Frontiers of Intelligent Transport System (FITS 2020), pages 5-11
ISBN: 978-989-758-465-7
Copyright
c
2020 by SCITEPRESS – Science and Technology Publications, Lda. All rights reserved
5

environment, such as subway transportation, more
and more people will choose this way to travel.
1) Because of the difference and particularity of
individual behavior, the behavior of passengers will
be limited in the subway platform, which forms a kind
of restriction for the behavior of passengers.
2) Due to the different destinations, there are
particularity and complexity in the routes of
passengers. The routes will be restricted by the
facilities and space in the subway station, and there
are individual differences caused by factors such as
travel speed and walking speed among individuals.
3) Due to the complexity of the subway station
environment, passengers have different behaviors and
different time points, which lead to obvious
differences in the flow of people in the subway
station. It is necessary to consider the density of the
subway station hall.
Because of the particularity and complexity of
subway station and passengers, a clear dynamic
model is needed to analyze the subway station hall,
which is conducive to further solve how to evacuate
people in special circumstances.
2.1 Simulation Implementation Method
2.1.1 Simulation Method Selection
Because crowd evacuation is a problem that needs to
be considered from both macro and onlookers, it is
necessary to use the model to dynamically display the
evacuation process. There are characteristics such as
pedestrian path differences and complicated flow
lines in the subway station. The micro simulation
model is used to simulate the situation in the subway
station. Therefore, the social force model is selected
as the analysis tool.
Some traditional modeling software use a specific
modeling method, and AnyLogic is a tool which can
simulate from many aspects, angles and methods.
Other pedestrian simulation software is in a closed
architecture scenario, while AnyLogic provides a
social force model as a basis for pedestrian
simulation, while providing a high degree of freedom
for the development environment, which can be
highly customized.
2.2 Simulation Principle
2.2.1 Principle of Social Force Model
Solving the crowd evacuation problem generally uses
a social force model, which is based on Newton ’s
mechanical formulas and pedestrians ’escape
behavior, simplifying each pedestrian to be described
as a particle, which is attracted by the destination to
generate its own drive At the same time, the particle
is subjected to repulsive and frictional forces with
obstacles and other particles. Under the action of
these forces, the particle generates acceleration in a
two-dimensional space, driving the particle to move
continuously. The dynamic formula is as follows:
00
()
(()() ())
m
iiii i
iijiw
ji w
i
dv m v t e t v t
f
f
dt
(1)
Among the dynamic formula,
is the driving force for
pedestrians to point to the destinations,
ij
f
is the force
of the pedestrian,
iw
f
is the interaction between
pedestrians and obstacles,
i
m
is pedestrian quality,
0
i
v
and
()
i
vt
is pedestrian expected speed and actual
speed,
0
()
i
et
is Desired direction of movement,
i
is
Adaptation time.
The acting force between pedestrians and
obstacles is composed of repulsive force and friction
force, and its calculation formula is as follows:
( exp[ ] ( )) ( )( )
iiw
iw i i iw iw i iw i iw iw
i
rd
fA kgrdngrdvtt
B
(2)
Among the calculation formula,
iw
d
indicates the
distance between the pedestrian and the edge of the
obstacle,
iw
n
represents a standardized vector from
the edge of the obstacle to the pedestrian,
i
v
represents the actual speed of pedestrians,
iw
t
represents the tangent direction of pedestrian and
obstacle edges, Ai, Bi, k,
is constant quantity.
2.2.2 Pedestrian Library Application
Principle
This article will mainly apply the pedestrian library in
AnyLogic. The pedestrian library is a high-level
pedestrian library used to simulate the performance of
pedestrian flow in the actual traffic environment.
Pedestrian library includes environment modeling
and behavior modeling:
1)Environmental modeling includes building
walls, columns, platforms, service facilities, queuing,
etc.
00
(()() ())/
ii i i i
mv te t vt
FITS 2020 - International Symposium on Frontiers of Intelligent Transport System
6
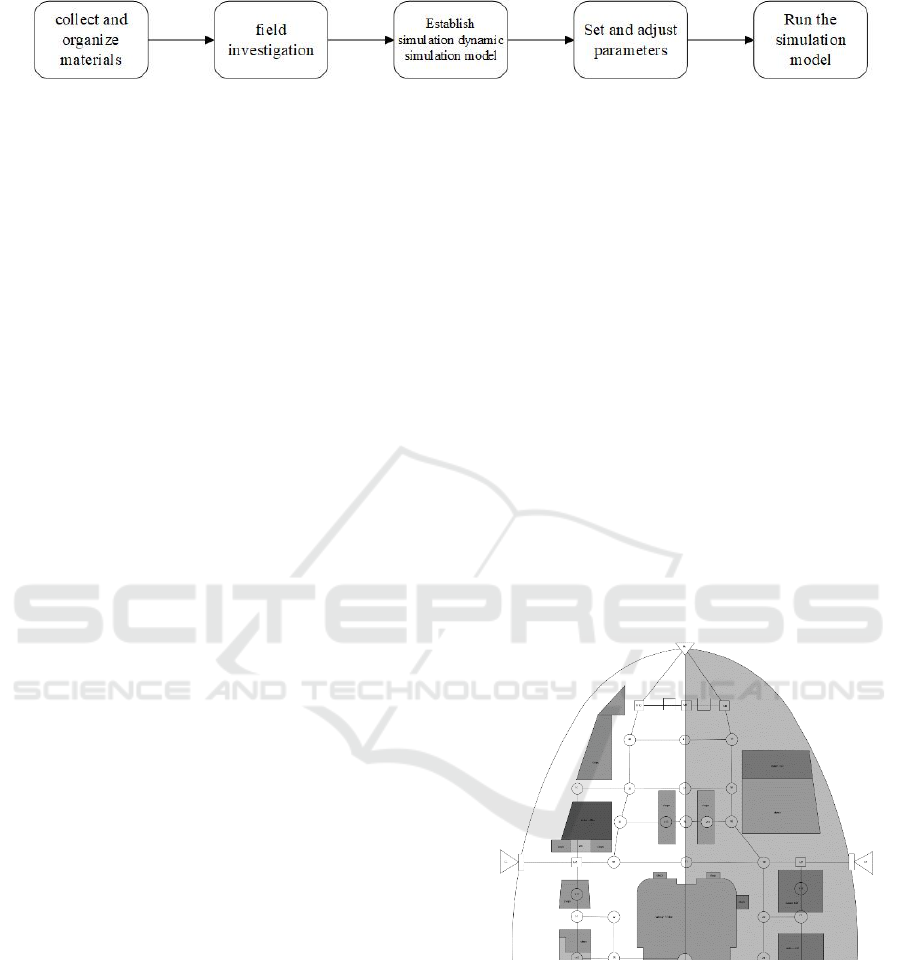
Figure 1: Step chart for building crowd evacuation model.
2) Behavior modeling needs to be achieved
through flow charts. Determine pedestrian routes and
behaviors, and establish a flow chart of the entire
process from pedestrian generation to pedestrian
departure.
When multiple locations in the model need to
reuse the same function, a function can be defined.
These functions are implemented in the Java
language. AnyLogic can check the syntax of types,
parameters and graphics. For each error, its location
and description are displayed in the problem view.
2.3 Create the Simulation Model
This article uses AnyLogic simulation software as a
modeling tool. The construction process is shown in
Fig.1, and the specific steps are shown in 1) to 5).
1) Collect and organize materials. According to
the specific information of the transportation hub
metro station hall to be investigated, the preliminary
information collection work needs to be carried out,
and the important information such as facilities,
environment, and people flow in the metro station
needs to be collected.
2) Site investigation. Due to the lag of the relevant
data on the Internet, and the actual situation needs to
be analyzed and calculated on site, so check the
relevant preliminary data in the subway station and
collect the on-site information.
3) Establish simulation dynamic simulation
model. Based on the data collected and sorted out in
the early stage, the plan of the subway station is
drawn with CAD software to determine the layout of
the facilities in the subway station, and the plan layout
of the subway station is established with AnyLogic
software.
4) Set and adjust parameters. Organize and
analyze the data recorded during the on-site survey,
calculate the pedestrian flow and path in the subway
station at different times, and further count other data
(pace, pedestrian type, number, etc.) generated during
pedestrian walking. Record the sorted parameters in
the created simulation system, and check the
difference with the actual situation.
5) Run the simulation model. Run the established
dynamic model and analyze the output indicators,
such as the density of people in the subway station at
different times and the specific action time of
pedestrians.
2.4 Empirical Research
2.4.1 Scene Construction of Related Subway
Stations in a Railway Station
Because of the particularity of the subway station,
part of its underground area is public area, and
because the subway station is underground in the
railway station, there are many entrances and exits, its
environment has certain complexity. And the walking
path of pedestrians is different from that of other
subway stations in that pedestrians enter and exit
from different railway stations, so the path has certain
complexity. Therefore, it can help to solve the
problem of evacuation in the later stage.
1) Drawing of plane model in subway station hall.
The plan of metro transfer part is shown in Fig.2,
and the shaded part is the main modeling part.
Figure 2: Environment modeling in subway station hall.
2) Statistics on the flow of people in different
subway entrances and exits during the evening peak
hours. Taking person/hour as the statistical unit, the
station north exit 1 is 720, the train station arrival exit
4 is 791, the subway north exit 2 is 2705, and the
subway east entrance is 1550. The specific survey
data is shown in Fig.3.
Anylogic Simulation Research on Passenger Evacuation System of Urban Transportation Hub
7
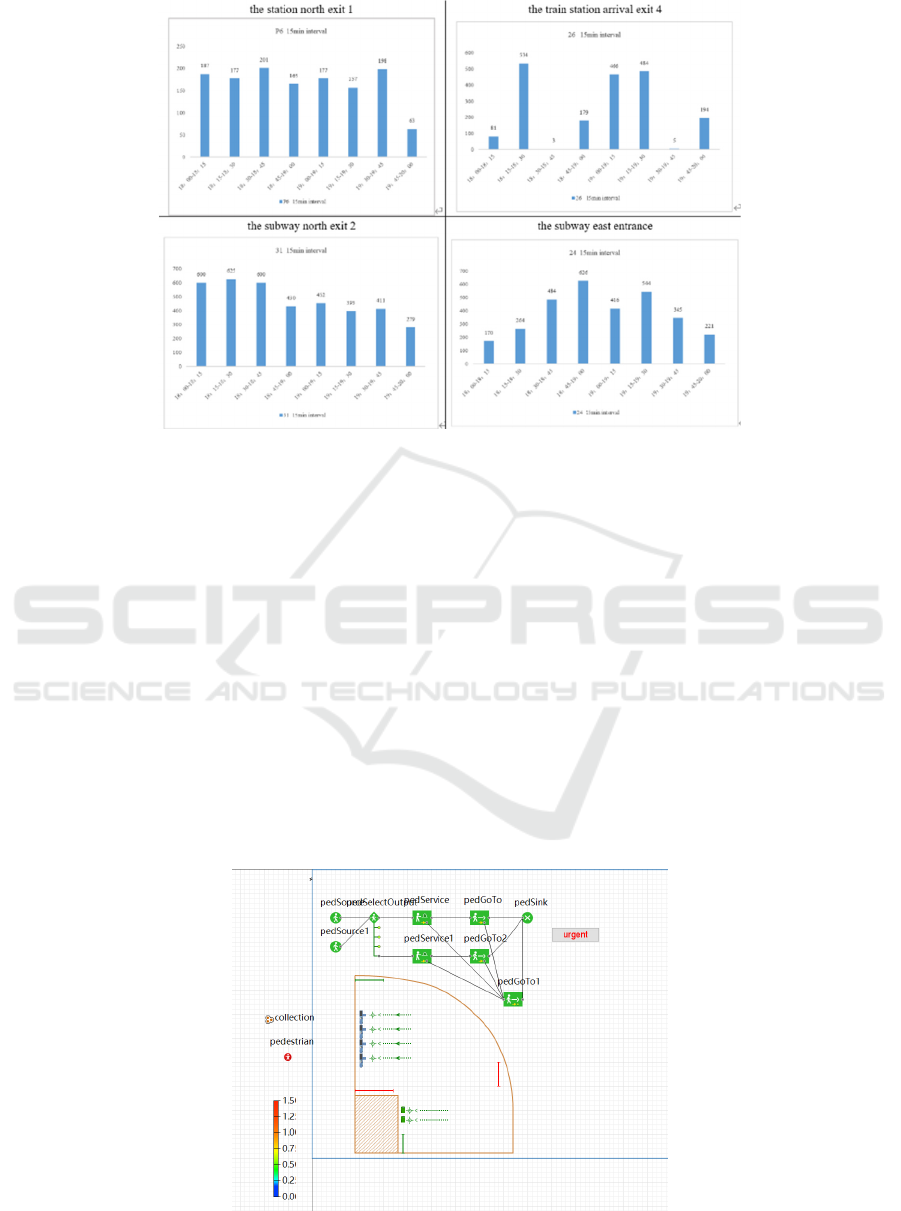
Figure 3:.Survey data at each exit of the station hall.
2.5
Creating a Behavior Flow Chart in
a Subway Station
In most cities, pedestrians can choose a mobile phone
QR code or a transportation card to enter the subway
station after entering the subway and choose the
appropriate entrance security check. It can also
choose a manual window ticket machine to buy
tickets and enter the station. After purchasing the
ticket and entering the station, the pedestrians choose
the stairs or escalator to enter the second floor.
Considering that the connection process between the
train station and the subway is complicated, and
pedestrians have a similar process after entering the
station hall, so this article only selects four outbound
entrances: north entrance 1 of a certain subway
station, arrival gate 4, a certain subway’s north
entrance and the east entrance are simulated.
According to the travel logic, the flow chart of the
logic modeling of the behavior of the station hall on
the negative first floor is shown in Fig.4.
2.6
Parameter Setting of Simulation
Model
In AnyLogic software, each facility-related attribute
has default values, but it is necessary to select objects
according to actual conditions and combine actual
survey data to change the default values in the
simulation software to actual measured data. Specific
parameter settings are shown in Table 1:
Figure 4: Survey data at each exit of the station hall.
FITS 2020 - International Symposium on Frontiers of Intelligent Transport System
8
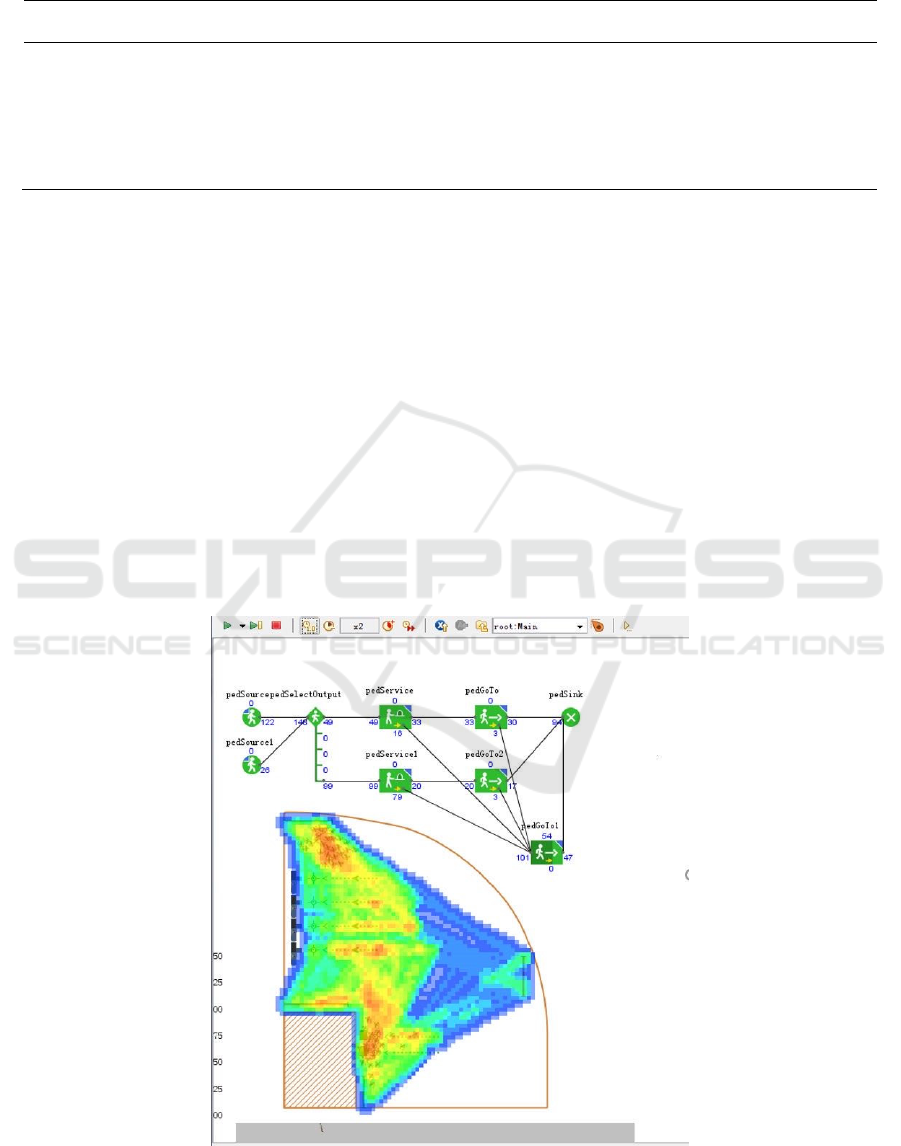
Table 1: Comparison table of simulation model parameter settings.
Control type
Corresponding
Environmental Elements
Parameter Name Assignment Parameters
Pedsource Reach the Goal
Moving Rate 2705(per hour)
Moving Rate 791(per hour)
pedSelectOutput
Pedestrian Selection
Probability
Usage Probability 0.2, 0, 0, 0, 0.44
Pedservice Shortest Queue
Delay Time Uniform (2.0, 3.0)
Delay Time Uniform (2.0, 3.0)*8
Pedgoto Reach the Target Recent Exports ped.getNearestGate()
This article additionally sets an emergency button
in the model, which is used to simulate the simulation
results when an emergency occurs, and for setting the
function in the nearest exit. This can provide an
effective basis for how to solve the crowd evacuation
in emergency situations. In order to get a more
accurate solution, three functions are set in the
simulation, which are average residence time, area
density and queue length.
1) Average residence time function
Average residence time function=
timeMeasureEnd.disturbution.mean()
2) Regional density function
Regional density= pedAreaDescriptor.density()
3) Queue length function
Queuing number = pedService. queueSize
(queueLine1)
2.7 Simulation Results and
Optimization Analysis
2.7.1 Analysis of Simulation Results
As shown in Fig.5, setting the pedestrian density map
in the simulation results can clearly show the degree
of congestion in the station with the color depth. It
can be observed from the results that there are
relatively many people entering the subway station
from the entrance of the train station, which is also
The particularity of this type of subway station. Due
to the large number of trains entering and leaving the
train station every day, many passengers choose the
nearest subway entrance to enter the station.
Figure 5: Pedestrian density simulation results show.
Anylogic Simulation Research on Passenger Evacuation System of Urban Transportation Hub
9
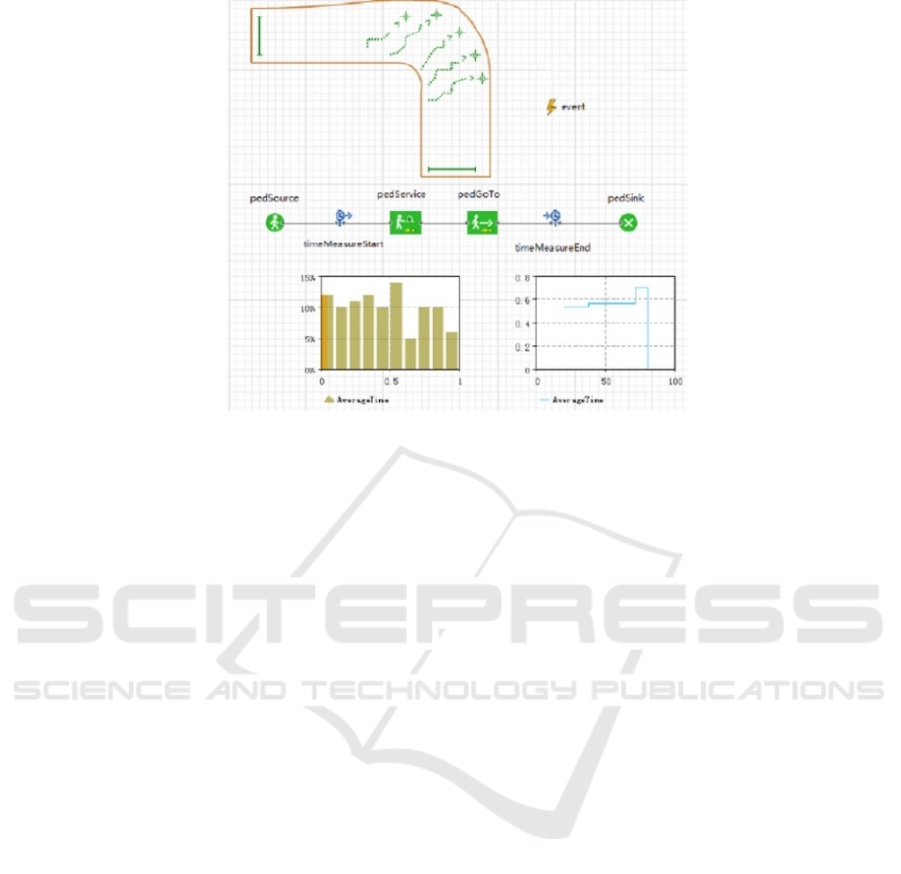
Figure 6: Model derived from running average residence time.
There will be different levels of crowding at
different times in the subway station hall. Because the
subway station selected in this article belongs to the
station hall connected to the railway station, the
personnel density will be higher than other subway
stations, and it is more difficult to solve the problem
of crowd evacuation. As shown in Fig. 6, running the
simulation model yields the average stay time of
passengers in the subway station hall.
2.8 Improve Proposals
Because the subway station is connected to the train
station, what is different from other subway stations
is that the station does not have the characteristics of
only a large number of people in the morning and
evening peaks, and the number of people in each time
period of the station is different. If set too many
evacuation exits, there will be resource redundancy.
In response to the above problems, based on the
operation results and the problems found, the
following optimization and improvement schemes
are proposed:
1) Due to the lack of gates for ticket checking, the
inbound passenger flow is not smooth, leading to
congestion in some areas of the station hall floor.
Therefore, when the crowd is crowded, two outbound
gates can be moved to the inbound gate. Taking into
account operating costs, the number of ticket vending
machines can be reduced by one.
2) When there are more passengers and the
elevator load is insufficient, you can add indicator
signs and manual guidance to transfer part of the
concentrated passengers. Properly extend the
passenger transfer route to increase the transfer time
to avoid trampling accidents caused by crowded
stairs.
3 CONCLUSION
In this paper, AnyLogic software is used to simulate
the layout of the underground station hall of a subway
station in the city, and four different entrances and
exits are used for example simulation. By analyzing
the simulation results and using the pedestrian density
map to analyze the crowd density of the underground
station hall of the station, to simulate how to evacuate
the crowd when the crowd is crowded, it is found that
the optimized simulation results are more reasonable
and provide reasonable construction for the subway
station hall. Reference. Therefore, from the
perspective of modeling and simulation, the study
found that AnyLogic simulation has certain
application value for improving the operating
conditions of subway stations and optimizing the
layout of facilities, and can provide help for the
construction of subway stations in cities.
REFERENCES
Deng Yuanyuan, Zheng Liping, Cai Ruiwen.Study on
social behavior driven evacuation simulation method
[J] .Journal of System Simulation, 2020,32 (01): 130-
141.
FITS 2020 - International Symposium on Frontiers of Intelligent Transport System
10

Haibo Lin, Liping Zheng, Jianwei Wang, Shujie Zhang. A
general hierarchical crowd evacuation simulation
framework [J / OL]. System Simulation: 1-7 [2020-03-
26].
Lei Hou,JianGuo Liu,Xue Pan,BingHong Wang. A social
force evacuation model with the leadership effect[J].
Physica A: Statistical Mechanics and its
Applications,2014,400.
Li F, Chen S, Wang X, et al. Pedestrian evacuation
modeling and simulation on metro platforms
considering panic impacts[J].procedia-Social and
Behavioral Sciences,2014,138:314-322.
Liu Zhen. Research progress and problems in visual
simulation of crowd emergency evacuation [J] .Chinese
Journal of Image and Graphics, 2019,24 (10): 1619-
1626.
Pan Ke, Xiu Shunyan.Numerical simulation of large
passenger flow evacuation in sudden environment [J]
.Journal of Dalian Jiaotong University, 2017, 38 (04):
142-146.
Weiliang Zeng, Peng Chen, Hideki Nakamura,Miho Iryo-
Asano. Application of social force model to pedestrian
behavior analysis at signalized crosswalk[J].
Transportation Research Part C,2014,40.
Zhao Jinlong, Sun Boyang, Wang Shansheng, Yuan Jie,
Huang Hong. Simulation of crowd evacuation of
special subway stations based on Pathfinder [J]. China
Safety Production Technology, 2020, 16 (01): 146-150.
Anylogic Simulation Research on Passenger Evacuation System of Urban Transportation Hub
11
