
Study of Bioaccumulation and Depuration of Pb Metal Ions in Green
Mussels (Perna viridis)
Riska Tamala
1
, Budiawan
1
and Sri Handayani
2
1
Departement of Chemistry, FMIPA Universitas Indonesia, Kampus UI Depok, 16424, Indonesia
Abstract: In this study, bioaccumulation and depuration studies of Pb in green mussels were performed. The
bioaccumulation process was carried out using flowing water method for 7 days. The Pb ion concentration
used was 1.225 ppm. During bioaccumulation, Pb contained in mussels was determined every 24 hours. Two
depuration methods were applied in this study, flowing clean water method for 7 days and immersing in acid
solution for 2 hours. Two variations of acid solutions used were acetic acid and citric acid with variations
concentration of 0.75%; 1.5%; and 2.25%. Pb contained in mussels was analyzed using AAS. The research
showed that the highest value of Pb contained was reach after 7 days exposure with concentration of 41.92
mg/kg and concentration factor (CF) value of 32.15 L/kg. The lowest content of Pb was reached after
depuration by immersing in 2.25% citric acid for 2 hours. Pb content after depuration was 16.96 mg/kg with
the decrease of Pb by 59.5%. Bioaccumulation ability was expressed by Concentration Factor (CF). Based
on this experiment, green mussel can be classified as low category bioindicator biota for Pb accumulation.
Keywords: Green mussel, Depuration, Lead, Atomic Absorption Spectroscopy (AAS)
1 INTRODUCTION
The development of industrial sector around Jakarta
impact on pollution in the region. This is due to the
Jakarta Bay area that accommodate the waste
generated by 13 rivers that bring millions of waste
every year to the sea. So level of polution from year
to year increase. (Hutagalung, 1991). Water
pollution in this area causes a decrease in water
quality, so the water can no longer be used as
intended. Liquid waste is entering the Jakarta Bay
often carries hazardous pollutants, such as heavy
metal. The impact of heavy metal pollution due to its
nature that cannot decompose and easily absorbed
by marine organisms, so it can accumulate in the
body. Heavy metals can also indirectly damage
fisheries and human health (Supriharyono, 2000).
One method that can be used to monitor
pollution in aquatic environments is by using marine
organisms called bioindicators. In choosing the
bioindicator should be based on laboratory research
to obtain a mechanism of pollutant or biokinetic
behaviour. The data acquisition can be used as a
reference for data interpretation in the real aquatic
environment (Suseno, 2006). The phenomenon may
indicate the potential of aspecies as bioindicator in
detecting heavy metals pollution (Hamed, 2006).
One of marine organism that can be used as a bio-
indicator is a green mussel. Green mussels (Perna
viridis) belong to the Bivalvia class that is widely
consumed by humans, because it is rich in protein.
(Ismail, 2006). The edible portion of the shell is all
parts of the body, including the digestive tract. This
aquatic biota is highly susceptible to heavy metal
contamination due to its filter feeder intake and
relatively immobile (sessile) (Gosling, 2004). This
makes it easy for heavy metals to accumulate in
mussels because heavy metals are readily bonded to
particles in the water and difficult to dissolve, thus
settling on the bottom of the waters or feeding
phytoplankton and marine organisms (Siddall,
1980). Aquatic plants and soft animals such as
shells, snails, etc., which are immobile or slow in
mobility, cannot regulate metals like other aquatic
animals (Darmono, 1995). Therefore, it is important
to know how much metal content in an organism
before it is consumed by humans. Prevention or
effort to reduce the level of metal pollution needs to
be done, among others by depuration method.
In this research, bioaccumulation and depuration
study of lead (Pb) was conducted using green
mussels as bioindicator. Two depuration methods
Tamala, R., Budiawan, . and Handayani, S.
Study of Bioaccumulation and Depuration of Pb Metal Ions in Green Mussels (Perna viridis).
DOI: 10.5220/0008358801450150
In Proceedings of BROMO Conference (BROMO 2018), pages 145-150
ISBN: 978-989-758-347-6
Copyright
c
2018 by SCITEPRESS – Science and Technology Publications, Lda. All rights reserved
145

were applied, i.e by continuous flowing clean water
method and immersing in acid solution. Pb
contained in mussels were then analysed by using
Atomic Absorption Spectroscopy.
2 MATERIAL AND METHODS
2.1 Material
Materials used in this reasearch were Green Mussel,
Aquabidest, Boiling Stones, Arthemia sp., Sea
Water, Aquadest, HNO
3
65%, H
2
SO
4
97%, Lead
Solution 1000 μg/mL, CH
3
COOH
(l)
25%, Citric
Acid, Selenium, NaOH
(l)
30%, H
3
BO
3
5%,
Phenolpthalein, BCG-MR Indicator, MR Indicator,
Hydrocholric Acid 1,0 N, Na
2
B
4
O
7
.10H
2
O.
2.2 Methods
2.2.1 Acclimatization
The acclimatization was performed for seven days in
an aquarium of clean seawater. Green mussels were
fed with Artemia sp. every day. During feeding, the
filtration system was switched off for 1 hour.
Research can be further conducted if the number of
dead green mussels were less than 20%.
2.2.2 Process of Bioaccumulation
Lead (Pb) exposure was carried out in an aquarium
with a capacity of 80 L. The concentration of Pb
ions presented is 1.225 ppm, which is half of the
LC
50
value (Dobson, 1991). Bioaccumulation was
conducted for 7 days.
2.2.3 Process of Depuration
Two variation depuration methods were performed.
The first method was the recycling of water using
aquarium filled with seawater and equipped with
fitration and aeration system. Previously also carried
out measurements of temperature, pH, salinity, and
Pb
2+
concentration in seawater were measured.
Depuration was performed for 7 days.. Samples of
green mussels were taken daily to determine the
level of Pb. The second method was immersion in
acid solution. Two variations of acid solution used
were acetic acid and citric acid. The variations of
concentration of the two acid solutions used were
0.75%, 1.5%, and 2.25%, with variations of
sampling time 24, 48, 72, 96, and 120 minutes.
2.2.4 Pb Content Analysis
The determination of Pb content, the green mussels
meat were destructed using 5 mL of HNO
3
and 1 mL
of H
2
SO
4
. Pb levels were then analyzed using
Atomic Absorption Spectrometer (AAS).
3 RESULT AND DISCUSSION
3.1 Process of Bioaccumulation
The process of accumulation on green mussels body
can occur because heavy metal ion entering into the
body of the green mussel form a complex with the
cell follows several steps, including metal diffusion
from solution to the biological surface, metal
adsorption/complexation on the passive side of the
bond in a protective layer or spesific binding side of
the outer surface of the plasma membrane and
internal metal picking transported along the plasma
membrane. One of the passive diffusion processes
experienced by metals passes through epithelial
tissue located in the green mussel’s tissue, especially
in the gills that are the most significant limbs
associated with the outflow of substances derived
from the aquatic environment. Heavy metals
entering the gills will tend to form complexes with
proteins in glycoprotein constituents of gill mucus
(Palar, 1994). In mussels, heavy metal like Pb can
replace the essential metal and induce changes in
protein conformation that caused protein
denaturation. Heavy metals may bind to sulfhydryl
(-SH), carboxyl (-COOH), hydroxyl (-OH), or
amino groups of proteins. One of the ligands present
in the green mussels body is the sulfihydryl (-SH)
group of cysteine (Grant, 2008).
The formation of metal-protein complexes
can be attributed to hard of acid base (HSAB)
concept which describes the tendency of hard or soft
an acids and base. The metal which is the Lewis acid
will act as an electron acceptor and a protein that is
Lewis base will act as electron donor. The -SH
group of cysteine belongs to the soft-base group.
Therefore heavy metals have a tendency to form
complexes with soft base groups as well. The
complex forming reaction is presented in Figure 1.
BROMO 2018 - Bromo Conference, Symposium on Natural Products and Biodiversity
146
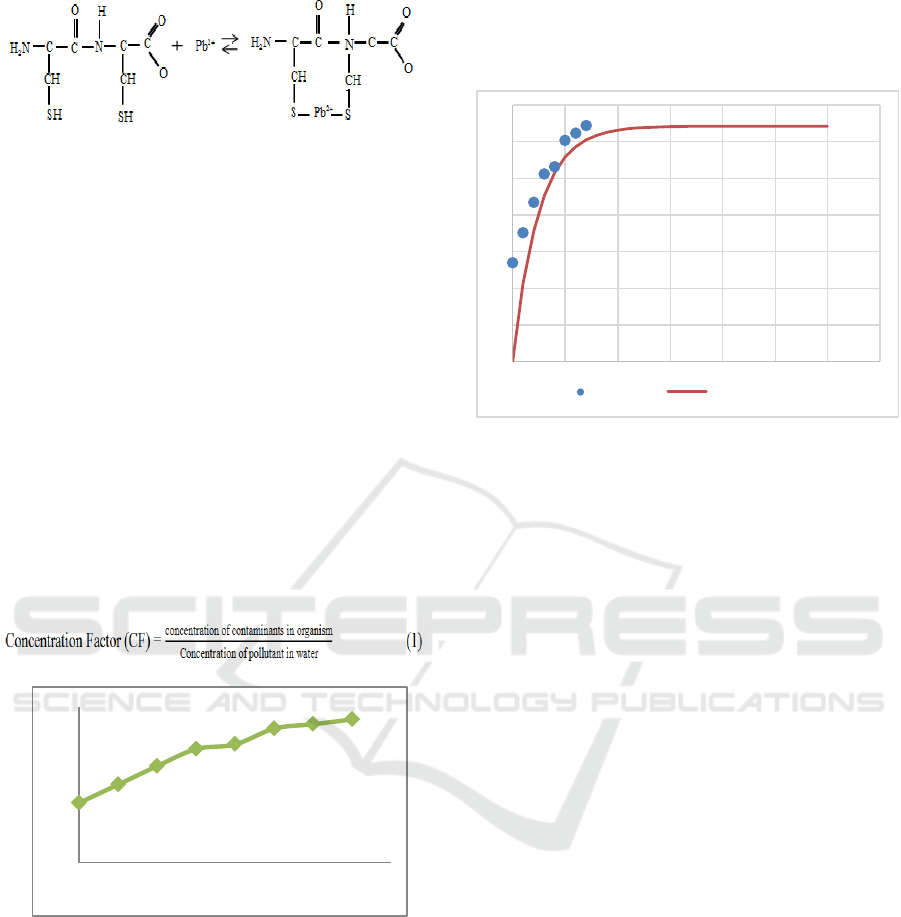
Figure 1. Reaction of Complex Formation
The form of equilibrium equation is a bond with
heavy metal deprecating the bonding amide of a
nitrogen atom of a peptide. The metal is electrophile
with d orbitals which having number of unfilled
electrons, while the thiol (sulfhydryl) group in the
amino acid cysteine is nucleophile, so that between
heavy metals and thiols have a tendency to form
bonds. In the process of exposure is used metal in
nitrate salts, it allows nitrate ions in the water to
form nitric acid compounds that can reduce the pH
of the solution, there by triggering in increased
toxicity of the green mussel, so the toxicity of heavy
metals increasingly great (Hutagalung, 1990). In
bioaccumulation process will get the value of CF
(Concentration Factor). This value proves the ability
of accumulation of green mussel with contaminants.
To obtain the value of CF by comparing the metal
ion content in green mussel with the metal ion
content in water using equation 1.
Figure 2. Pb Content in Green Mussels During
Bioaccumulation
The value of CF continues to increase and tend to
reach the state of steady state was started from the 7
days was 32.15 L/kg. Condition based on the data,
indicating that green mussel can accumulate as much
as 32 times the concentration of lead ion in the sea
water. The implementation of the experimental
resuts, if there is lead ion pollution in Jakarta bay
then after 1 day the concentration of lead reaches 13
times compared with concentration in sea water. If
the pollution is still going on, then in 7 days the
concentration wil increase to 32 times compared
with concentration in sea water. Then a 30-days was
modeled in Figure 3.
Figure 3. Modeling of CF values if observed until 30 days
When the bioaccumulation is done for 5 days, there
is steady state and it can use to get CF
ss
value. It is a
maximum capability of green mussel when
accumulate lead ion. It is 32.15 mL/g. The
bioaccumulation capasity of the green mussel was
also represented by the rate of taking the
contaminant (k
u
). In a single compartement, value of
k
u
is assumed as a contaminant uptake mechanism
by the entire body of the green mussel. However, the
speed of distribution into various type of organs was
neglected. Value of k
u
(mL/g.day) was an uptake
rate calculated based on the slope of the CFt curve to
t (from t = 0 to t in steady state (Umbara, 2007). The
value of k
u
was the influence of physiological
factors of green mussel, chemical species of
contaminants and the interaction between
physiological factors and chemical species. The rate
constant is determined by converting equation (2) to
a liniear equuation so that (3) is obtained:
CF
t
= CF
ss
(1-e
-ku.t
) (2)
ln(CF
ss
-CF
t
) = -k
u
.t (3)
Then pass the equation (3) in the graph where the x
axis is the duration of exposur to the contaminant
(day) and the y axis is ln(CFss-CFt). The slope value
obtained from the line equation in the graph
represents the constant value of the uptake constanta
(k
u
) by the green mussel. Based on the experiment,
the uptake constanta (k
u
) was 0.403 mL/g.day.
3.2 Process of Depuration
In this method is done by transferring samples
derived from the bioaccumulation aquarium to a
0
7
14
21
28
35
0 2 4 6 8
Concentration Factor (L/kg)
time (days)
0
5
10
15
20
25
30
35
0 5 10 15 20 25 30 35
research modeling until 30 days
Study of Bioaccumulation and Depuration of Pb Metal Ions in Green Mussels (Perna viridis)
147

contaminant free aquarium to allow the green mussel
to continue the filter feeding process. Therefore, it’s
important to keep the green mussel to stay alive. The
process is carried out for 7 days and for 7 days also
done replacement of seawater. Factors that can
weaken the complex bonds between metals and
protein is in the presence of other ligands that can
form more stable complexes with metals, such as
H
2
O. Therefore, a water solvent is used as a provider
of H
2
O ligands in the depuration process which will
disupt the stability of the metal complex with –SH
group in the amino acid cysteine protein constituent.
In this water-treatment is done with the replacement
of seawater media everyday with the speed of flow
from water made constant.
Figure 4. % Retention Value on Depuration Using
Continuous Flowing Water
From figure 4, it can be seen that the percentage (%)
retention of metal ion of lead retained on the green
mussel body decreases during depuration time as the
replacement of water is repeated. Retention rate is
percentage in the body of the green mussel against
the predicted time (Sari, 2005). The decrease in
metal ion of lead content may be due to the H
2
O
ligand which will form a complex with metal ion of
lead to [Pb(H
2
O)
6
]
2+
and it will cause the bond
between the –SH group in sistein and it cause the
metal bond to be disturbed. The H
2
O ligand is a
group of monodentic ligands which can donate one
pair of free electrons to fill the empty d orbitals from
metal ion of lead. The process of release or excretion
from metal ion of lead is one of the processes to
maintain electrolyte balance in the body of green
mussel. The ability to release contaminants by the
green mussel bodies is represented by the value of
the realease constant (t
0
). The value to be obtained
by changing the equation of model depuration (eq.
4) into linear equation (eq. 5).
C
t
= A
0
.e – k
e
.t (4)
ln (A
0
-A
t
) = k
e
.t (5)
Equation 5 is plotted into graph and a line equation
of the graph is determined. The slope of the line
equation represent the value to the green mussel.
The value obtained is 0.129 day
-1
. This may indicate
a decrease in the ability of the green mussel to
eliminate contaminants from the body. In the other
depuration method by using acid solution, that is
asectic acid and citric acid. The use of immersion
media with that acid is expected to interfere with the
bond between metal and protein. The observed
results are presented in Figure 5-a and Figure 5-b.
(a)
(b)
Figure 5. % Retention on Depuration Using (a)
Acetic Acid, (b) Using Citric Acid
From figure 5 is seen that retention (%) of Pb metal
ions retained on the green mussel body decrease
during depuration time along with the addition of
cencentration to the acid. The determination of
heavy metals in green mussel can be caused of
insoluble acetat salts from the metals (Suprapti,
2016). The ability to realease contaminants by the
biota bodies is represented by the value of the
realease constant (k
e
). The gain of the value to be
derieved from equation 5 is plotted into a graph and
the line equation of the graph is determined. The
slope of the line equation represents the k
e
value of
the green mussel. This may indicate a decrease in
the ability of the green mussel to eliminate
0
10
20
30
40
50
60
70
80
90
100
0 20 40 60 80 100 120 140
Retention (%)
time (minutes)
0,75% 1,50% 2,25%
0
10
20
30
40
50
60
70
80
0 20 40 60 80 100 120 140
Retention (%)
time (minutes)
0,75% 1,50% 2,25%
0
10
20
30
40
50
60
70
80
90
0 2 4 6 8
Retention (%)
Time (days)
BROMO 2018 - Bromo Conference, Symposium on Natural Products and Biodiversity
148

contaminants from the body. The values to those
obtained are presented in Tabel 1.
Table 1. Biokinetic of Lead In Green Mussel
CF
ss
k
u
(day
-
1
)
k
e
(day
-
1
)
BCF
T
1/2(b)
(day)
Depuration
Using
Water
Drainage
32.15
0.41
0.13
3.12
5.37
Depuration
Using
Acetic Acid
0,75%
32.15
0.41
0.06
6.88
11.75
Depuration
Using
Acetic Acid
1,5%
32.15
0.41
0.05
8.83
15.07
Depuration
Using
Acetic Acid
2,25%
32.15
0.41
0.02
27.07
46.20
Depuration
Using
Citric Acid
0,75%
32.15
0.41
0.07
5.64
9.63
Depuration
Using
Citric Acid
1,5%
32.15
0.41
0.06
6.34
10.83
Depuration
Using
Citric Acid
2,25%
32.15
0.41
0.06
6.66
11.36
Biokinetic data is a mode that can be implemented in
sea water conditions. The rate of taking lead by
green mussel is 0.41 times per-day from the
concentration in seawater.release rate of 0.02-0.13
perday from the animal cody with several different
realease methods. Biological residence time so that
the concentration become half time (T
1/2
). The lead
ion in the body of green mussel is 5.37 to 46.20
days. The bioaconcentration factor (BCF) lead ion
the animal is 3.12 to 27.07 times compared to the
concentration in seawater with several different
dischange methods.
4 CONCLUSIONS
Heavy metal ion of Lead can accumulate in green
mussels seen from CF (Concentration Factor) value
obtained that is equal to 32.15 L/kg.day, the value of
k
u
(Uptake Constanta) obtained from treatment of
exposure of heavy metal ion of Lead foor 7 days
equal to 0.403 L/Kg.day, the value of k
e
(Elimination Constanta) for depuration treatment
with a recurrent water-draining method equal to
0.129 day
-1
, the smallest value of depuration with
immersion of acetic acid is 0.0015 day
-1
when the
variation of concentration in 2.25%, and the smallest
value of depuration with immersion of citric acid is
0.0061 day
-1
when variation of concentration in
2.25%, the value of %retention obtained by 44% in
reccurent water drainage, 49.87% when immersion
of acetic acid with variation of concentration in
2.25% and 40.46% when immersion of acetic acid
with variation of concentration in 2.25%.
REFERENCES
Darmono. 1995. Logam dalam sistem biologi makhluk
hidup. Penerbit Universitas Indonesia. Jakarta.
Dr. Dobson, S. 1991. International Programme On
Chemical Safety Environmental Health Criteria Lead-
Environmental Aspects. United Kingdom: Institute of
Terrestrial Ecology World Health Organization
Geneva.
Grant LD. (2008). Lead and compounds. Environmental
Toxicants (John Wiley & Sons, Inc.). pp. 757–809.
GOSLING, E. 2004. Bivalvia Mollusc Biology, Ecology
and Culture. Fishing Bews Books: 327 pp.
Hamed, M.A. and A.M Emara, 2006. Marine molluscs as
biomonitors for heavy metal levels in the Gulf of
Suez, Red Sea. J. Mar. Syst., 60: 220-234.
Hutagalung, H. P. 1990. Logam Berat Dalam Lingkungan
Laut. Pewarta Oseana IX No. 1 Tahun 1984 LON-
LIPI, Jakarta.
Hutagalung, H. P. 1991. Pencemaran Laut oleh Logam
Berat dalam Status Pencemaran Laut di Indonesia dan
Teknik Pemantauannya. Jakarta: P30-LIPI. Hlm 45-
58.
Ismail, A., 2006. The use of intertidal molluscs in the
monitoring of heavy metal levels and organotin
compounds in the west coast of Peninsular Malaysia,
Coast. Mar. Sci., 30: 401-406.
Palar, Heryando Drs. 1994. Pencernaan dan Toksikologi
Logam berat. PT. Rineka Cipta : Jakarta.
Sari, F.I., Keman, & Soedjajadi. 2005. Efektifitas Larutan
Asam Cuka untuk Menurunkan Kandungan Logam
Berat Cadmium dalam Kerang Bulu. Jurnal Kesehatan
Lingkungan Vol. 1, 120-129.
Siddall, Scott E. 1980. A clarification of the genus Perna
(Mytilidae). Bulletin of Marine Science 30 (4):858-
870.
Smith, J., 1998. The book, The publishing company.
London, 2
nd
edition.
Suprapti, Nanik Heru, dkk. 2016. Removal of Heavy
Metals from a Contaminated Green Mussel [Perna
Viridis (Linneaus, 1758)] Using Acetic Acid as
Chelating Agents. Aquatic Procedia.
Supriharyono. 2000. Pengelolaan Ekosistem Terumbu
Karang, Penerbit Djambatan, Jakarta.
Suseno, Heny. 2006. Bioakumulasi Kadmium Melalui
Jalur Air Laut pada Kerang hijau (Perna viridis) :
Study of Bioaccumulation and Depuration of Pb Metal Ions in Green Mussels (Perna viridis)
149

Studi Pengambilan dan Depurasi Kadmium
menggunakan perunut
109
Cd. Prosiding PPI-PDIPTN
Pustek Akselerator dan Proses Bahan-BATAN. 10 Juli
2006. hlm. 167-174.
Umbara, Heru and Heny Suseno. 2007. Lead
Bioaccumulation Factor of Cockle Shell (Anadara
granosa) base on Biokinetic Study that used
Radiotracer
210
Pb. Prosiding PPI-PDIPTN Pustek
Akselerator dan Proses Bahan - BATAN. 10 Juli
2007.130-135.
BROMO 2018 - Bromo Conference, Symposium on Natural Products and Biodiversity
150
